Estimated zip code population in 2022: 29,898 Zip code population in 2010: 28,706 Zip code population in 2000: 22,619
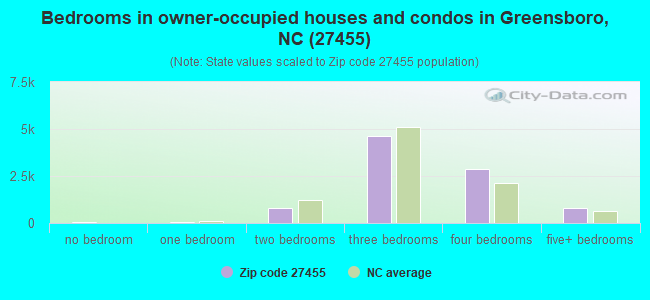
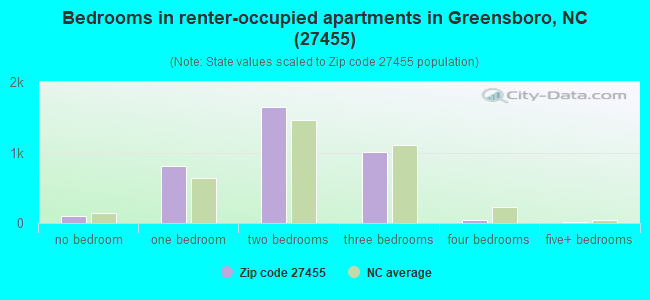
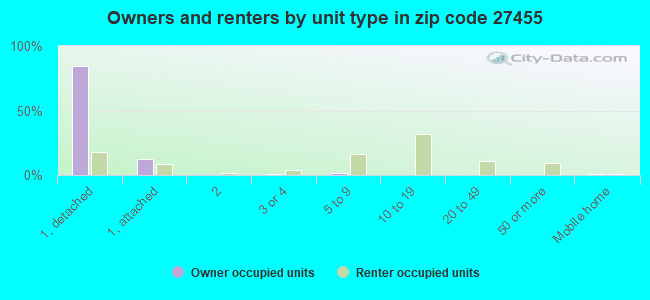
Houses and condos: 13,401 Renter-occupied apartments: 3,630
% of renters here:
28%
State:
33%
March 2022 cost of living index in zip code 27455: 92.1 (less than average, U.S. average is 100)
Land area: 29.7 sq. mi. Water area: 1.6 sq. mi.
Population density: 1,008 people per square mile
(low).
OSM Map
General Map
Google Map
MSN Map
OSM Map
General Map
Google Map
MSN Map
OSM Map
General Map
Google Map
MSN Map
OSM Map
General Map
Google Map
MSN Map
Please wait while loading the map...
Real estate property taxes paid for housing units in 2022:
This zip code:
0.8% ($2,934)
North Carolina:
0.6% ($1,769)
Median real estate property taxes paid for housing units with mortgages in 2022: $2,983 (0.8%) Median real estate property taxes paid for housing units with no mortgage in 2022: $2,785 (0.9%)
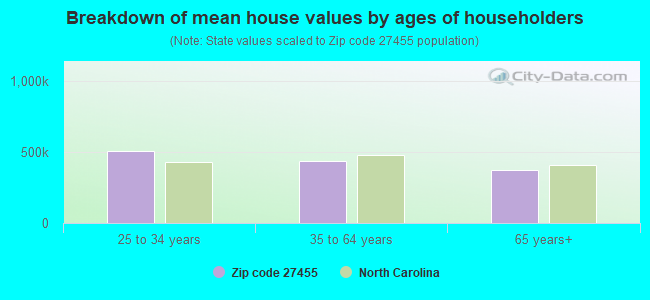
Estimated median house/condo value in 2022: $356,693
27455:
$356,693
North Carolina:
$280,600
According to our research of North Carolina and other state lists, there were 23 registered sex offenders living in 27455 zip code as of April 27, 2024. The ratio of all residents to sex offenders in zip code 27455 is 1,303 to 1. The ratio of registered sex offenders to all residents in this zip code is much lower than the state average.
Median resident age:
This zip code:
43.5 years
North Carolina median age:
39.2 years
Average household size:
This zip code:
2.3 people
North Carolina:
2.4 people
Averages for the 2020 tax year for zip code 27455, filed in 2021:
Average Adjusted Gross Income (AGI) in 2020: $97,967 (Individual Income Tax Returns)
Here:
$97,967
State:
$70,020
Salary/wage: $82,500 (reported on 81.0% of returns)
Here:
$82,500
State:
$58,387
(% of AGI for various income ranges: 1144.7% for AGIs below $25k, 3772.9% for AGIs $25k-50k, 6563.3% for AGIs $50k-75k, 10229.9% for AGIs $75k-100k, 19215.0% for AGIs $100k-200k, 91183.1% for AGIs over 200k)
Taxable interest for individuals: $1,433 (reported on 37.7% of returns)
This zip code:
$1,433
North Carolina:
$1,479
(% of AGI for various income ranges: 17.9% for AGIs below $25k, 21.1% for AGIs $25k-50k, 48.9% for AGIs $50k-75k, 94.4% for AGIs $75k-100k, 135.9% for AGIs $100k-200k, 783.3% for AGIs over 200k)
Ordinary dividends: $8,214 (reported on 28.6% of returns)
Here:
$8,214
State:
$7,888
(% of AGI for various income ranges: 44.8% for AGIs below $25k, 67.6% for AGIs $25k-50k, 163.6% for AGIs $50k-75k, 278.5% for AGIs $75k-100k, 525.4% for AGIs $100k-200k, 4268.0% for AGIs over 200k)
Net capital gain/loss in AGI: +$20,894 (reported on 25.8% of returns)
Here:
+$20,894
State:
+$23,652
(% of AGI for various income ranges: 21.1% for AGIs below $25k, 45.8% for AGIs $25k-50k, 165.9% for AGIs $50k-75k, 270.7% for AGIs $75k-100k, 685.9% for AGIs $100k-200k, 13587.1% for AGIs over 200k)
Profit/loss from business: +$17,351 (reported on 17.6% of returns)
Here:
+$17,351
State:
+$11,710
(% of AGI for various income ranges: 128.9% for AGIs below $25k, 141.3% for AGIs $25k-50k, 300.7% for AGIs $50k-75k, 421.3% for AGIs $75k-100k, 757.8% for AGIs $100k-200k, 4293.5% for AGIs over 200k)
Taxable individual retirement arrangement distribution: $22,271 (reported on 12.6% of returns)
27455:
$22,271
North Carolina:
$20,247
(% of AGI for various income ranges: 84.4% for AGIs below $25k, 139.6% for AGIs $25k-50k, 333.4% for AGIs $50k-75k, 597.2% for AGIs $75k-100k, 1184.6% for AGIs $100k-200k, 2150.8% for AGIs over 200k)
Self-employed (Keogh) retirement plans: $22,288 (reported on 1.1% of returns)
27455:
$22,288
North Carolina:
$26,749
(% of AGI for various income ranges: 28.9% for AGIs $50k-75k, 53.9% for AGIs $100k-200k, 537.8% for AGIs over 200k)
Total itemized deductions: $34,111 (reported on 13.5% of returns)
Here:
$34,111
State:
$34,549
(% of AGI for various income ranges: 77.1% for AGIs below $25k, 157.8% for AGIs $25k-50k, 381.5% for AGIs $50k-75k, 663.2% for AGIs $75k-100k, 1436.6% for AGIs $100k-200k, 6744.3% for AGIs over 200k)
Charity contributions: $11,963 (reported on 11.8% of returns)
Here:
$11,963
State:
$13,360
(% of AGI for various income ranges: 6.7% for AGIs below $25k, 25.9% for AGIs $25k-50k, 67.2% for AGIs $50k-75k, 142.9% for AGIs $75k-100k, 381.2% for AGIs $100k-200k, 2695.9% for AGIs over 200k)
Taxes paid: $8,189 (reported on 13.4% of returns)
27455:
$8,189
State:
$7,586
(% of AGI for various income ranges: 10.8% for AGIs below $25k, 25.0% for AGIs $25k-50k, 76.5% for AGIs $50k-75k, 185.3% for AGIs $75k-100k, 406.4% for AGIs $100k-200k, 1535.9% for AGIs over 200k)
Earned income credit: $1,989 (reported on 11.5% of returns)
Here:
$1,989
State:
$2,337
(% of AGI for various income ranges: 71.6% for AGIs below $25k, 55.9% for AGIs $25k-50k, 1.0% for AGIs $50k-75k)
Percentage of individuals using paid preparers for their 2020 taxes: 92.7%
Here:
93%
State:
93%
(% for various income ranges: 91.1% for AGIs below $25k, 93.1% for AGIs $25k-50k, 92.3% for AGIs $50k-75k, 93.1% for AGIs $75k-100k, 93.6% for AGIs $100k-200k, 94.3% for AGIs over 200k)
Averages for the 2012 tax year for zip code 27455, filed in 2013:
Average Adjusted Gross Income (AGI) in 2012: $86,374 (Individual Income Tax Returns)
Here:
$86,374
State:
$54,937
Salary/wage: $74,390 (reported on 83.6% of returns)
Here:
$74,390
State:
$46,336
(% of AGI for various income ranges: 73.8% for AGIs below $25k, 77.5% for AGIs $25k-50k, 72.3% for AGIs $50k-75k, 73.0% for AGIs $75k-100k, 76.7% for AGIs $100k-200k, 67.4% for AGIs over 200k)
Taxable interest for individuals: $1,322 (reported on 43.4% of returns)
This zip code:
$1,322
North Carolina:
$1,298
(% of AGI for various income ranges: 1.3% for AGIs below $25k, 0.6% for AGIs $25k-50k, 0.7% for AGIs $50k-75k, 0.7% for AGIs $75k-100k, 0.6% for AGIs $100k-200k, 0.7% for AGIs over 200k)
Ordinary dividends: $6,010 (reported on 30.2% of returns)
Here:
$6,010
State:
$6,213
(% of AGI for various income ranges: 2.7% for AGIs below $25k, 1.3% for AGIs $25k-50k, 1.8% for AGIs $50k-75k, 1.6% for AGIs $75k-100k, 1.7% for AGIs $100k-200k, 2.7% for AGIs over 200k)
Net capital gain/loss in AGI: +$11,771 (reported on 25.0% of returns)
Here:
+$11,771
State:
+$12,740
(% of AGI for various income ranges: 0.2% for AGIs $25k-50k, 0.8% for AGIs $50k-75k, 0.7% for AGIs $75k-100k, 1.5% for AGIs $100k-200k, 6.9% for AGIs over 200k)
Profit/loss from business: +$15,704 (reported on 17.8% of returns)
Here:
+$15,704
State:
+$10,311
(% of AGI for various income ranges: 6.8% for AGIs below $25k, 3.4% for AGIs $25k-50k, 2.9% for AGIs $50k-75k, 2.3% for AGIs $75k-100k, 2.9% for AGIs $100k-200k, 3.3% for AGIs over 200k)
Taxable individual retirement arrangement distribution: $20,923 (reported on 13.3% of returns)
27455:
$20,923
North Carolina:
$15,575
(% of AGI for various income ranges: 4.1% for AGIs below $25k, 3.3% for AGIs $25k-50k, 3.9% for AGIs $50k-75k, 4.3% for AGIs $75k-100k, 3.9% for AGIs $100k-200k, 2.3% for AGIs over 200k)
Self-employment retirement plans: $19,719 (reported on 1.2% of returns)
27455:
$19,719
North Carolina:
$21,078
(% of AGI for various income ranges: 0.3% for AGIs $25k-50k, 0.2% for AGIs $100k-200k, 0.5% for AGIs over 200k)
Total itemized deductions: $27,289 (19% of AGI, reported on 49.2% of returns)
Here:
$27,289
State:
$23,438
Here:
18.8% of AGI
State:
21.5% of AGI
(% of AGI for various income ranges: 14.6% for AGIs below $25k, 13.7% for AGIs $25k-50k, 16.8% for AGIs $50k-75k, 17.5% for AGIs $75k-100k, 18.3% for AGIs $100k-200k, 13.6% for AGIs over 200k)
Charity contributions: $4,718 (reported on 43.6% of returns)
Here:
$4,718
State:
$4,687
(% of AGI for various income ranges: 1.3% for AGIs below $25k, 1.8% for AGIs $25k-50k, 2.4% for AGIs $50k-75k, 2.5% for AGIs $75k-100k, 2.7% for AGIs $100k-200k, 2.4% for AGIs over 200k)
Taxes paid: $12,514 (reported on 49.0% of returns)
27455:
$12,514
State:
$8,823
(% of AGI for various income ranges: 3.0% for AGIs below $25k, 3.8% for AGIs $25k-50k, 5.5% for AGIs $50k-75k, 7.4% for AGIs $75k-100k, 8.1% for AGIs $100k-200k, 7.9% for AGIs over 200k)
Earned income credit: $2,111 (reported on 13.4% of returns)
Here:
$2,111
State:
$2,376
(% of AGI for various income ranges: 5.7% for AGIs below $25k, 0.9% for AGIs $25k-50k)
Percentage of individuals using paid preparers for their 2012 taxes: 49.9%
Here:
50%
State:
53%
(% for various income ranges: 44.8% for AGIs below $25k, 46.3% for AGIs $25k-50k, 49.7% for AGIs $50k-75k, 51.2% for AGIs $75k-100k, 52.9% for AGIs $100k-200k, 73.5% for AGIs over 200k)
Averages for the 2004 tax year for zip code 27455, filed in 2005:
Average Adjusted Gross Income (AGI) in 2004: $67,935 (Individual Income Tax Returns)
Here:
$67,935
State:
$45,376
Salary/wage: $61,278 (reported on 85.6% of returns)
Here:
$61,278
State:
$39,442
(% of AGI for various income ranges: 169.4% for AGIs below $10k, 77.7% for AGIs $10k-25k, 81.0% for AGIs $25k-50k, 79.0% for AGIs $50k-75k, 83.0% for AGIs $75k-100k, 73.6% for AGIs over 100k)
Taxable interest for individuals: $1,289 (reported on 50.9% of returns)
This zip code:
$1,289
North Carolina:
$1,515
(% of AGI for various income ranges: 7.9% for AGIs below $10k, 1.8% for AGIs $10k-25k, 1.1% for AGIs $25k-50k, 1.0% for AGIs $50k-75k, 0.6% for AGIs $75k-100k, 0.9% for AGIs over 100k)
Taxable dividends: $3,401 (reported on 33.6% of returns)
Here:
$3,401
State:
$4,016
(% of AGI for various income ranges: 12.5% for AGIs below $10k, 1.9% for AGIs $10k-25k, 1.4% for AGIs $25k-50k, 1.3% for AGIs $50k-75k, 1.2% for AGIs $75k-100k, 1.8% for AGIs over 100k)
Net capital gain/loss: +$9,444 (reported on 28.1% of returns)
Here:
+$9,444
State:
+$11,152
(% of AGI for various income ranges: -5.6% for AGIs below $10k, 0.5% for AGIs $10k-25k, 0.5% for AGIs $25k-50k, 1.1% for AGIs $50k-75k, 1.0% for AGIs $75k-100k, 6.3% for AGIs over 100k)
Profit/loss from business: +$15,048 (reported on 16.5% of returns)
Here:
+$15,048
State:
+$9,490
(% of AGI for various income ranges: 4.6% for AGIs below $10k, 4.7% for AGIs $10k-25k, 3.6% for AGIs $25k-50k, 3.4% for AGIs $50k-75k, 2.6% for AGIs $75k-100k, 3.9% for AGIs over 100k)
IRA payment deduction: $2,929 (reported on 3.3% of returns)
27455:
$2,929
North Carolina:
$2,967
(% of AGI for various income ranges: 0.6% for AGIs below $10k, 0.2% for AGIs $10k-25k, 0.3% for AGIs $25k-50k, 0.2% for AGIs $50k-75k, 0.2% for AGIs $75k-100k, 0.1% for AGIs over 100k)
Self-employed pension: $14,505 (reported on 1.6% of returns)
Here:
$14,505
North Carolina:
$14,754
(% of AGI for various income ranges: 0.1% for AGIs $25k-50k, 0.2% for AGIs $50k-75k, 0.1% for AGIs $75k-100k, 0.5% for AGIs over 100k)
Total itemized deductions: $22,770 (21% of AGI, reported on 53.9% of returns)
Here:
$22,770
State:
$19,464
Here:
21.3% of AGI
State:
22.7% of AGI
(% of AGI for various income ranges: 33.8% for AGIs below $10k, 14.6% for AGIs $10k-25k, 18.5% for AGIs $25k-50k, 20.6% for AGIs $50k-75k, 20.6% for AGIs $75k-100k, 17.0% for AGIs over 100k)
Charity contributions deductions: $4,137 (4% of AGI, reported on 49.6% of returns)
Here:
$4,137
State:
$4,035
Here:
3.7% of AGI
State:
4.5% of AGI
(% of AGI for various income ranges: 1.9% for AGIs below $10k, 1.8% for AGIs $10k-25k, 2.6% for AGIs $25k-50k, 3.0% for AGIs $50k-75k, 3.0% for AGIs $75k-100k, 3.2% for AGIs over 100k)
Total tax: $12,237 (reported on 79.9% of returns)
27455:
$12,237
State:
$7,257
(% of AGI for various income ranges: 4.7% for AGIs below $10k, 4.1% for AGIs $10k-25k, 7.0% for AGIs $25k-50k, 8.9% for AGIs $50k-75k, 10.1% for AGIs $75k-100k, 19.2% for AGIs over 100k)
Earned income credit: $1,614 (reported on 10.4% of returns)
Here:
$1,614
State:
$1,851
Percentage of individuals using paid preparers for their 2004 taxes: 55.8%
Here:
56%
State:
62%
(% for various income ranges: 49.2% for AGIs below $10k, 58.3% for AGIs $10k-25k, 53.2% for AGIs $25k-50k, 56.3% for AGIs $50k-75k, 54.7% for AGIs $75k-100k, 62.9% for AGIs over 100k)
Likely homosexual households (counted as self-reported same-sex unmarried-partner households)
Lesbian couples: 0.0% of all households
Gay men: 0.2% of all households
Household received Food Stamps/SNAP in the past 12 months: 779 Household did not receive Food Stamps/SNAP in the past 12 months: 11,916
Women who had a birth in the past 12 months: 527 (339 now married, 186 unmarried) Women who did not have a birth in the past 12 months: 6,172 (2,588 now married, 3,581 unmarried)
Housing units in zip code 27455 with a mortgage: 6,731 (818 second mortgage, 24 home equity loan, 725 both second mortgage and home equity loan) Houses without a mortgage: 159
Median monthly owner costs for units with a mortgage: $1,772 Median monthly owner costs for units without a mortgage: $550
Residents with income below the poverty level in 2022:
This zip code:
5.7%
Whole state:
12.8%
Residents with income below 50% of the poverty level in 2022:
This zip code:
2.6%
Whole state:
6.8%
Median number of rooms in houses and condos:
Here:
7.3
State:
6.4
Median number of rooms in apartments:
Here:
4.3
State:
4.4
Notable locations in this zip code not listed on our city pages
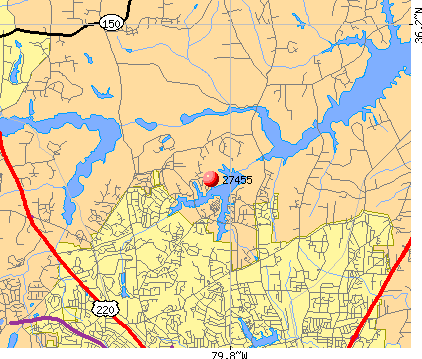
Churches in zip code 27455 include: Lake Brandt Church (A), Thomas Chapel (B), Bass Chapel (C), Wayside Church (D), Mount Pisgah Church (E), Center Church (F), Gethsemane Church (G). Display/hide their locations on the map
Reservoirs: Robins Nest Lake (A), Richland Lake (B), Richardson Lake (C), Greensboro Country Park Lake Five B (D), Greensboro Country Park Lake Five A (E). Display/hide their locations on the map
In group quarters: 249 (-1 institutionalized population)
Size of family households: 4,028 2-persons, 2,092 3-persons, 1,151 4-persons, 459 5-persons, 256 6-persons, 20 7-or-more-persons
Size of nonfamily households: 3,747 1-person, 954 2-persons, 89 3-persons
4,760 married couples with children.
1,103 single-parent households (38 men, 1,065 women).
90.1% of residents of 27455 zip code speak English at home.
2.4% of residents speak Spanish at home (68% very well, 19% well, 13% not well).
3.3% of residents speak other Indo-European language at home (94% very well, 6% well).
2.6% of residents speak Asian or Pacific Island language at home (26% very well, 63% well, 11% not well).
1.6% of residents speak other language at home (39% very well, 61% well).
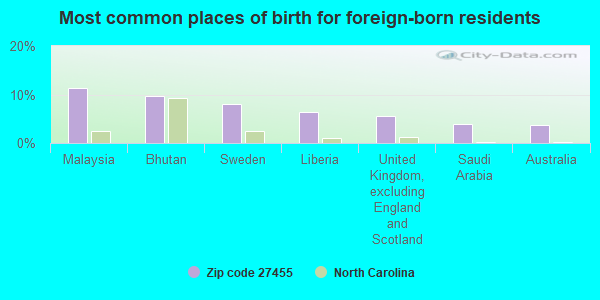
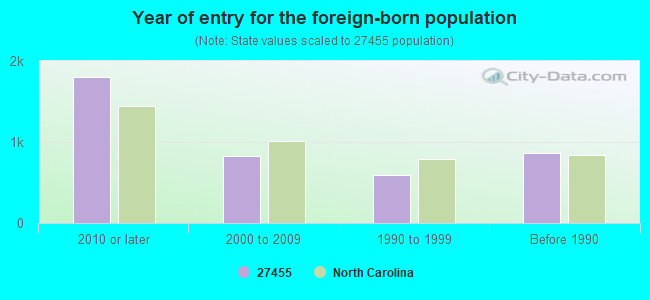
Foreign born population: 2,809 (9.4%) (68.8% of them are naturalized citizens)
Facilities with environmental interests located in this zip code:
CLEANER IMAGE DRY CLEANER & LAUNDRY (4711 LAWNDALE DR in GREENSBORO, NC)
AIR MINOR (AIRS/AFS) STATE MASTER (North Carolina facility info) - AIR PROGRAM Conditionally Exempt Small Quantity Generators, less than 100 kg/month of hazardous waste (Resource Conservation and Recovery Act (tracking hazardous waste)) - notification Business SIC classification: DRYCLEANING PLANTS, EXCEPT RUG CLEANING Organizations: EDWIN M CHAPMAN (CONTACT/OWNER)
Alternative names: CLEANER IMAGE INC
CHURCH CROSSING CLEANERS INACTIVE (1320-AA LEES CHAPEL ROAD in GREENSBORO, NC)
AIR MINOR (AIRS/AFS) STATE MASTER (North Carolina facility info) - AIR PROGRAM Business SIC classification: DRYCLEANING PLANTS, EXCEPT RUG CLEANING
DUKE ENERGY CORPORATION - UNITED HEALTH (3803 N. ELM STREET in GREENSBORO, NC)
AIR MINOR (AIRS/AFS) Business SIC classification: INSURANCE AGENTS, BROKERS, AND SERVICE
Housing units lacking complete plumbing facilities: 0.6% Housing units lacking complete kitchen facilities: 0.5%
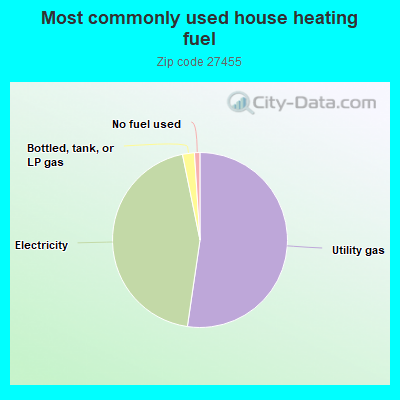
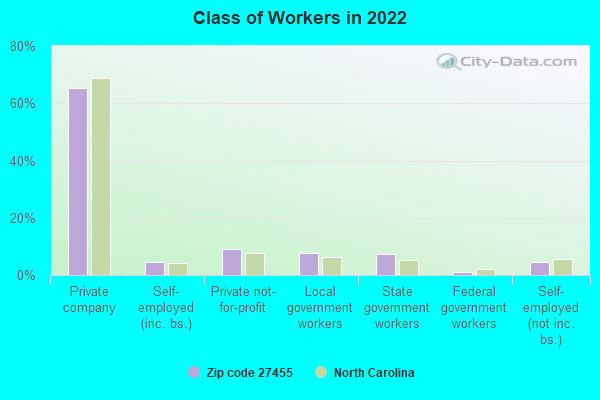
52.2%Utility gas
44.4%Electricity
2.2%Bottled, tank, or LP gas
1.0%No fuel used
Place of birth for U.S.-born residents:
This state: 12,923
Northeast: 3,937
Midwest: 2,797
South: 5,351
West: 1,047
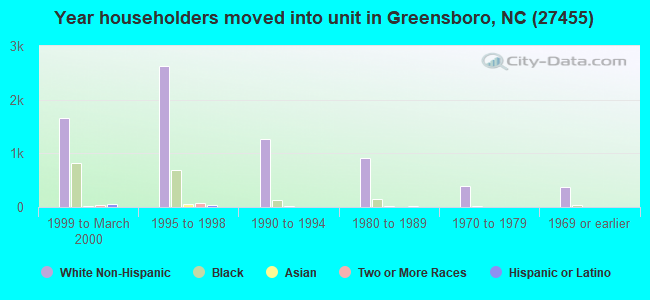
41% of the 27455 zip code residents lived in the same house 5 years ago. Out of people who lived in different houses, 53% lived in this county. Out of people who lived in different counties, 50% lived in North Carolina.
93% of the 27455 zip code residents lived in the same house 1 year ago. Out of people who lived in different houses, 43% moved from this county. Out of people who lived in different houses, 18% moved from different county within same state. Out of people who lived in different houses, 38% moved from different state. Out of people who lived in different houses, 5% moved from abroad.
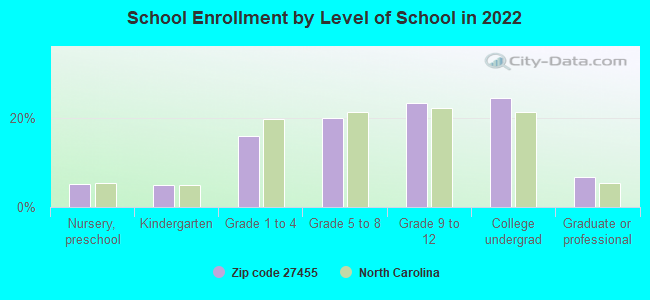
Private vs. public school enrollment:
Students in private schools in grades 1 to 8 (elementary and middle school): 670
Here:
24.9%
North Carolina:
13.8%
Students in private schools in grades 9 to 12 (high school): 277
Here:
16.0%
North Carolina:
11.9%
Students in private undergraduate colleges: 251
Here:
13.9%
North Carolina:
19.3%
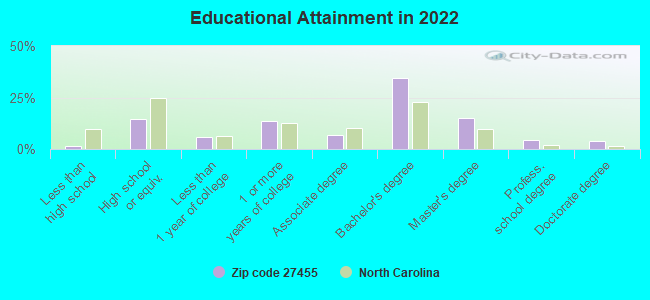
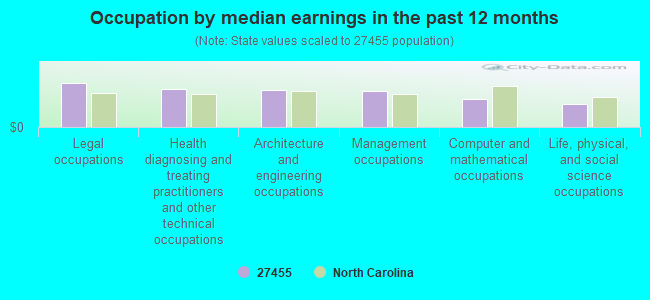
Occupation by median earnings in the past 12 months ($)
129,964Legal occupations
112,971Health diagnosing and treating practitioners and other technical occupations
110,295Architecture and engineering occupations
106,404Management occupations
82,018Computer and mathematical occupations
69,305Life, physical, and social science occupations
Companies with federal contracts located in this zip code (GREENSBORO, NC):
WILLIAM T BROOKS & ASSOCIATES (3810 NORTH ELM STREET; small business) : $1,258,864 in 10 contractsfrom 2000 to 2005
Contracts for Education Services, Other Education and Training Services, Food Items For Resale, Reserve Training (Military), and moreby Air Force Signed by year:2000: $150,000; 2001: $489,065; 2002: $99,990; 2003: $302,243; 2004: $109,542; 2005: $108,024; 2006: $0.
Biggest contracts:
$382,365 with Air Force for Education Services. Signed on 2001-09-30. Completion date: 2001-09-20.
$242,243 with Air Force for Other Education and Training Services. Signed on 2003-09-30. Completion date: 2004-09-29.
$150,000 with Air Force for Food Items For Resale. Signed on 2000-09-30. Completion date: 2000-11-10.
$109,542 with Air Force for Education Services. Signed on 2004-09-15. Completion date: 2005-09-29.
CAROLINA PROFESSIONALS INCORPO (818 NORTHERN SHORES POINT; small business)
$398,825 with Air Force for Maintenance, Repair or Alteration of Real Property -- Air Traffic Control Towers. Taking place in MD. Signed on 2005-09-30. Completion date: 2005-09-29.
SOUTHERN STATES MACHINERY, INC (415 PISGAH CHURCH RD; small business)
$94,200 with Air Force for Punching and Shearing Machines. Signed on 2005-09-20. Completion date: 2006-01-03.
CAROLINA RECREATIONAL PRODUCTS (300 AIR HARBOR RD; small business)
$35,305 with Air Force for Roofing and Siding Materials. Signed on 2000-08-31. Completion date: 2000-09-29.
LUECHT, RICHARD M (5204 SOUTHWIND ROAD; small business)
$4,685 with Army for Lectures For Training. Taking place in CA. Signed on 2002-06-27. Completion date: 2002-07-15.
JAMES O BRADY (204 KIRK ROAD; small business) : $440 in 3 contractsfrom 2003 to 2004
$440 with Public Buildings Service for Relocation Services. Signed on 2003-12-15. Completion date: 2003-12-19.
$0, same as above.Signed on 2004-01-05. Effective on 2003-12-29. Completion date: 2003-12-19.
$0, same as above.Signed on 2004-01-05. Completion date: 2003-12-19.
Top industries in this zip code by the number of employees in 2005:
Information: Cellular and Other Wireless Telecommunications (500-999 employees: 1 establishment, 250-499 employees: 1 establishment, 1-4 employees: 4 establishments)
Educational Services: Elementary and Secondary Schools (250-499: 1, 50-99: 1)
Health Care and Social Assistance: Homes for the Elderly (50-99: 2, 20-49: 1)
Health Care and Social Assistance: Nursing Care Facilities (100-249: 1, 1-4: 1)
Other Services (except Public Administration): Beauty Salons (50-99: 1, 20-49: 1)
Other Services (except Public Administration): Religious Organizations (20-49: 1, 10-19: 3, 5-9: 1, 1-4: 9)
2002 - 2018 National Fire Incident Reporting System (NFIRS) incidents
According to the data from the years 2002 - 2018 the average number of fires per year is 23. The highest number of reported fires - 52 took place in 2006, and the least - 9 in 2017. The data has a dropping trend.
When looking into fire subcategories, the most incidents belonged to: Structure Fires (47.6%), and Outside Fires (40.1%).
Fire incident types reported to NFIRS in Zip Code 27455


 Nearest zip codes: 27408, 27358, 27405, 27410, 27403, 27401.


 According to the data from the years 2002 - 2018 the average number of fires per year is 23. The highest number of reported fires - 52 took place in 2006, and the least - 9 in 2017. The data has a dropping trend.
 When looking into fire subcategories, the most incidents belonged to: Structure Fires (47.6%), and Outside Fires (40.1%).