Estimated zip code population in 2022: 7,705 Zip code population in 2010: 5,896 Zip code population in 2000: 4,504
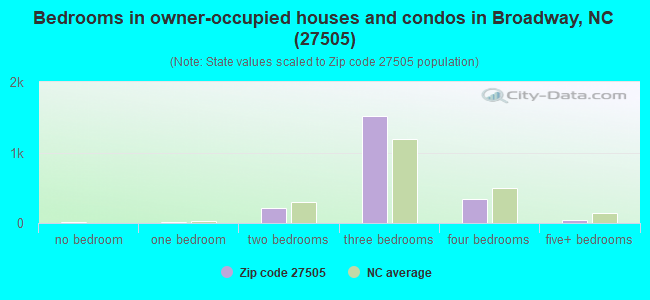
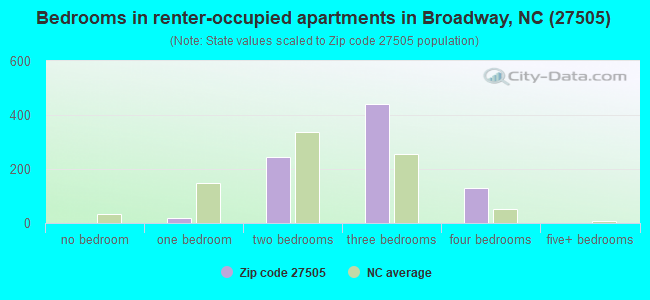
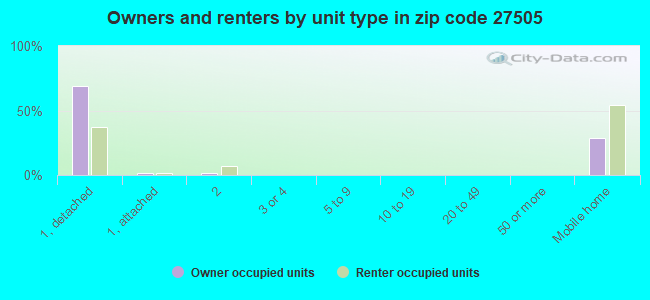
Houses and condos: 3,386 Renter-occupied apartments: 833
% of renters here:
28%
State:
33%
March 2022 cost of living index in zip code 27505: 80.1 (low, U.S. average is 100)
Land area: 56.8 sq. mi. Water area: 0.3 sq. mi.
Population density: 136 people per square mile
(very low).
OSM Map
General Map
Google Map
MSN Map
OSM Map
General Map
Google Map
MSN Map
OSM Map
General Map
Google Map
MSN Map
OSM Map
General Map
Google Map
MSN Map
Please wait while loading the map...
Real estate property taxes paid for housing units in 2022:
This zip code:
0.7% ($1,359)
North Carolina:
0.6% ($1,769)
Median real estate property taxes paid for housing units with mortgages in 2022: $1,603 (0.7%) Median real estate property taxes paid for housing units with no mortgage in 2022: $837 (0.6%)
Business Search- 14 Million verified businesses
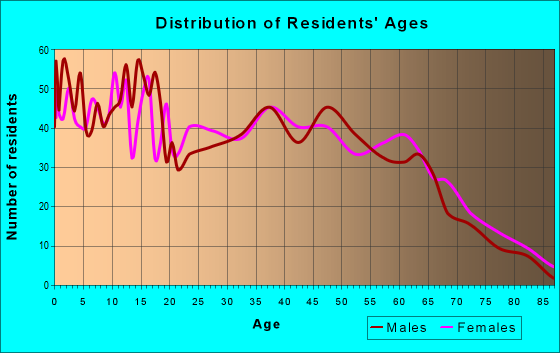
Males: 3,884
(50.4%)
Females: 3,821
(49.6%)
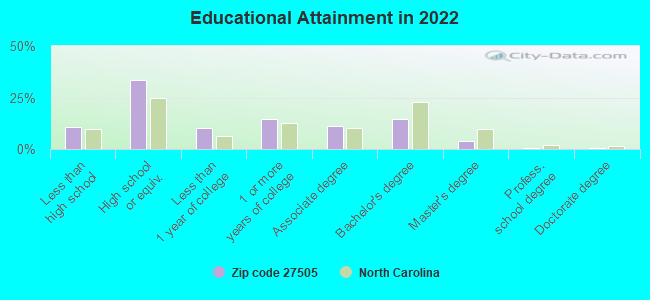
For population 25 years and over in 27505:
High school or higher: 88.1%
Bachelor's degree or higher: 19.5%
Graduate or professional degree: 4.9%
Unemployed: 3.3%
Mean travel time to work (commute): 27.8 minutes
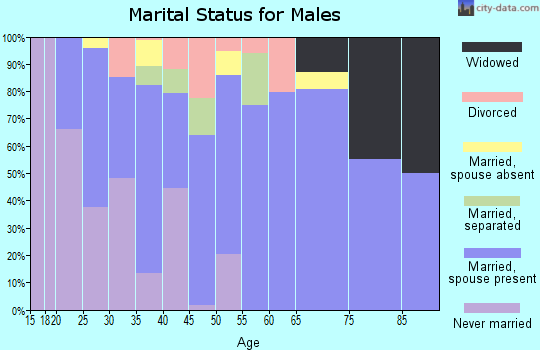
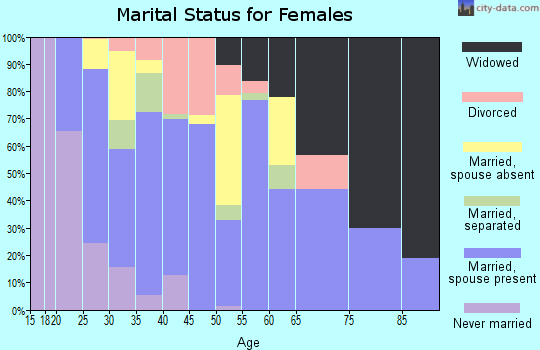
For population 15 years and over in 27505:
Never married: 31.1%
Now married: 49.2%
Separated: 3.9%
Widowed: 4.7%
Divorced: 11.2%
Zip code 27505 compared to state average:
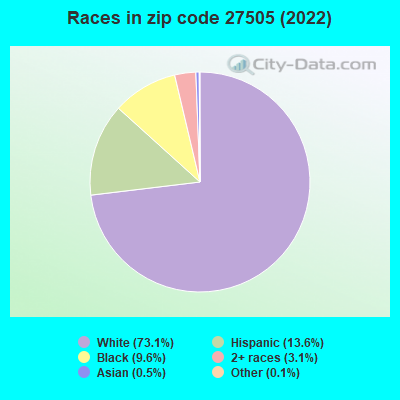
Black race population percentage below state average.
Median age below state average.
Foreign-born population percentage significantly below state average.
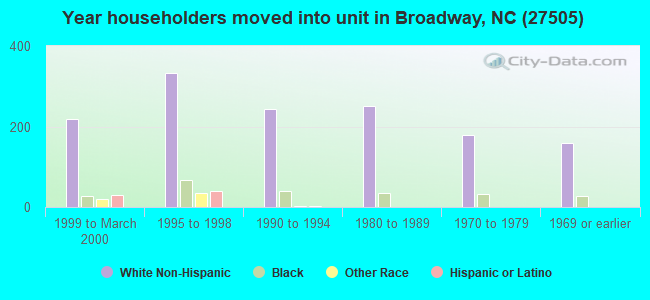
Length of stay since moving in significantly above state average.
Percentage of population with a bachelor's degree or higher below state average.
Averages for the 2020 tax year for zip code 27505, filed in 2021:
Average Adjusted Gross Income (AGI) in 2020: $51,878 (Individual Income Tax Returns)
Here:
$51,878
State:
$70,020
Salary/wage: $46,477 (reported on 85.0% of returns)
Here:
$46,477
State:
$58,387
(% of AGI for various income ranges: 1218.0% for AGIs below $25k, 3705.1% for AGIs $25k-50k, 6525.1% for AGIs $50k-75k, 9396.4% for AGIs $75k-100k, 16746.2% for AGIs $100k-200k)
Taxable interest for individuals: $799 (reported on 21.4% of returns)
This zip code:
$799
North Carolina:
$1,479
(% of AGI for various income ranges: 7.8% for AGIs below $25k, 13.7% for AGIs $25k-50k, 25.1% for AGIs $50k-75k, 35.0% for AGIs $75k-100k, 65.7% for AGIs $100k-200k)
Ordinary dividends: $3,781 (reported on 11.5% of returns)
Here:
$3,781
State:
$7,888
(% of AGI for various income ranges: 15.4% for AGIs below $25k, 22.6% for AGIs $25k-50k, 57.2% for AGIs $50k-75k, 97.3% for AGIs $75k-100k, 305.2% for AGIs $100k-200k)
Net capital gain/loss in AGI: +$7,415 (reported on 10.9% of returns)
Here:
+$7,415
State:
+$23,652
(% of AGI for various income ranges: 6.9% for AGIs below $25k, 16.0% for AGIs $25k-50k, 39.0% for AGIs $50k-75k, 189.5% for AGIs $75k-100k, 849.5% for AGIs $100k-200k)
Profit/loss from business: +$7,247 (reported on 14.4% of returns)
Here:
+$7,247
State:
+$11,710
(% of AGI for various income ranges: 121.6% for AGIs below $25k, 67.6% for AGIs $25k-50k, 143.8% for AGIs $50k-75k, 94.1% for AGIs $75k-100k, 492.9% for AGIs $100k-200k)
Taxable individual retirement arrangement distribution: $13,035 (reported on 7.3% of returns)
27505:
$13,035
North Carolina:
$20,247
(% of AGI for various income ranges: 38.5% for AGIs below $25k, 77.4% for AGIs $25k-50k, 114.4% for AGIs $50k-75k, 164.5% for AGIs $75k-100k, 636.2% for AGIs $100k-200k)
Total itemized deductions: $29,008 (reported on 3.8% of returns)
Here:
$29,008
State:
$34,549
(% of AGI for various income ranges: 145.0% for AGIs $25k-50k, 177.3% for AGIs $75k-100k, 988.6% for AGIs $100k-200k)
Charity contributions: $9,790 (reported on 3.2% of returns)
Here:
$9,790
State:
$13,360
(% of AGI for various income ranges: 85.6% for AGIs $50k-75k, 307.1% for AGIs $100k-200k)
Taxes paid: $6,817 (reported on 3.8% of returns)
27505:
$6,817
State:
$7,586
(% of AGI for various income ranges: 20.6% for AGIs $25k-50k, 58.2% for AGIs $75k-100k, 153.3% for AGIs $100k-200k)
Earned income credit: $2,520 (reported on 20.8% of returns)
Here:
$2,520
State:
$2,337
(% of AGI for various income ranges: 127.9% for AGIs below $25k, 86.0% for AGIs $25k-50k)
Percentage of individuals using paid preparers for their 2020 taxes: 94.6%
Here:
95%
State:
93%
(% for various income ranges: 93.4% for AGIs below $25k, 94.3% for AGIs $25k-50k, 96.1% for AGIs $50k-75k, 96.7% for AGIs $75k-100k, 94.3% for AGIs $100k-200k, 100.0% for AGIs over 200k)
Averages for the 2012 tax year for zip code 27505, filed in 2013:
Average Adjusted Gross Income (AGI) in 2012: $40,354 (Individual Income Tax Returns)
Here:
$40,354
State:
$54,937
Salary/wage: $36,500 (reported on 86.0% of returns)
Here:
$36,500
State:
$46,336
(% of AGI for various income ranges: 79.3% for AGIs below $25k, 84.3% for AGIs $25k-50k, 78.8% for AGIs $50k-75k, 83.6% for AGIs $75k-100k, 63.8% for AGIs $100k-200k)
Taxable interest for individuals: $759 (reported on 27.3% of returns)
This zip code:
$759
North Carolina:
$1,298
(% of AGI for various income ranges: 0.8% for AGIs below $25k, 0.5% for AGIs $25k-50k, 0.4% for AGIs $50k-75k, 0.4% for AGIs $75k-100k, 0.6% for AGIs $100k-200k)
Ordinary dividends: $2,473 (reported on 11.9% of returns)
Here:
$2,473
State:
$6,213
(% of AGI for various income ranges: 0.9% for AGIs below $25k, 0.6% for AGIs $25k-50k, 0.8% for AGIs $50k-75k, 0.4% for AGIs $75k-100k, 0.9% for AGIs $100k-200k)
Net capital gain/loss in AGI: +$3,683 (reported on 10.4% of returns)
Here:
+$3,683
State:
+$12,740
(% of AGI for various income ranges: 0.2% for AGIs below $25k, 0.6% for AGIs $25k-50k, 0.6% for AGIs $50k-75k, 0.1% for AGIs $75k-100k, 2.8% for AGIs $100k-200k)
Profit/loss from business: +$6,157 (reported on 12.6% of returns)
Here:
+$6,157
State:
+$10,311
(% of AGI for various income ranges: 5.6% for AGIs below $25k, 1.7% for AGIs $25k-50k, 0.5% for AGIs $50k-75k, 0.4% for AGIs $75k-100k, 2.4% for AGIs $100k-200k)
Taxable individual retirement arrangement distribution: $9,391 (reported on 7.9% of returns)
27505:
$9,391
North Carolina:
$15,575
(% of AGI for various income ranges: 2.4% for AGIs below $25k, 1.4% for AGIs $25k-50k, 2.3% for AGIs $50k-75k, 1.7% for AGIs $75k-100k, 1.7% for AGIs $100k-200k)
Total itemized deductions: $17,212 (23% of AGI, reported on 24.8% of returns)
Here:
$17,212
State:
$23,438
Here:
23.4% of AGI
State:
21.5% of AGI
(% of AGI for various income ranges: 5.9% for AGIs below $25k, 8.3% for AGIs $25k-50k, 11.1% for AGIs $50k-75k, 13.2% for AGIs $75k-100k, 13.8% for AGIs $100k-200k)
Charity contributions: $3,517 (reported on 19.1% of returns)
Here:
$3,517
State:
$4,687
(% of AGI for various income ranges: 0.6% for AGIs below $25k, 1.1% for AGIs $25k-50k, 1.8% for AGIs $50k-75k, 2.0% for AGIs $75k-100k, 2.6% for AGIs $100k-200k)
Taxes paid: $5,899 (reported on 24.8% of returns)
27505:
$5,899
State:
$8,823
(% of AGI for various income ranges: 1.0% for AGIs below $25k, 2.0% for AGIs $25k-50k, 3.6% for AGIs $50k-75k, 4.7% for AGIs $75k-100k, 6.4% for AGIs $100k-200k)
Earned income credit: $2,481 (reported on 28.1% of returns)
Here:
$2,481
State:
$2,376
(% of AGI for various income ranges: 9.2% for AGIs below $25k, 1.8% for AGIs $25k-50k)
Percentage of individuals using paid preparers for their 2012 taxes: 57.2%
Here:
57%
State:
53%
(% for various income ranges: 55.6% for AGIs below $25k, 54.1% for AGIs $25k-50k, 59.5% for AGIs $50k-75k, 66.7% for AGIs $75k-100k, 66.7% for AGIs $100k-200k)
Averages for the 2004 tax year for zip code 27505, filed in 2005:
Average Adjusted Gross Income (AGI) in 2004: $34,201 (Individual Income Tax Returns)
Here:
$34,201
State:
$45,376
Salary/wage: $32,004 (reported on 88.4% of returns)
Here:
$32,004
State:
$39,442
(% of AGI for various income ranges: 118.1% for AGIs below $10k, 85.6% for AGIs $10k-25k, 87.0% for AGIs $25k-50k, 84.0% for AGIs $50k-75k, 80.1% for AGIs $75k-100k, 66.6% for AGIs over 100k)
Taxable interest for individuals: $994 (reported on 28.4% of returns)
This zip code:
$994
North Carolina:
$1,515
(% of AGI for various income ranges: 3.3% for AGIs below $10k, 0.8% for AGIs $10k-25k, 0.7% for AGIs $25k-50k, 0.8% for AGIs $50k-75k, 0.9% for AGIs $75k-100k, 0.7% for AGIs over 100k)
Taxable dividends: $2,554 (reported on 13.6% of returns)
Here:
$2,554
State:
$4,016
(% of AGI for various income ranges: 3.5% for AGIs below $10k, 0.6% for AGIs $10k-25k, 0.6% for AGIs $25k-50k, 1.1% for AGIs $50k-75k, 0.7% for AGIs $75k-100k, 2.1% for AGIs over 100k)
Net capital gain/loss: +$4,156 (reported on 9.5% of returns)
Here:
+$4,156
State:
+$11,152
(% of AGI for various income ranges: -0.2% for AGIs below $10k, 0.3% for AGIs $10k-25k, 0.6% for AGIs $25k-50k, 0.2% for AGIs $50k-75k, 1.6% for AGIs $75k-100k, 4.4% for AGIs over 100k)
Profit/loss from business: +$5,927 (reported on 13.2% of returns)
Here:
+$5,927
State:
+$9,490
(% of AGI for various income ranges: 10.3% for AGIs below $10k, 4.8% for AGIs $10k-25k, 1.3% for AGIs $25k-50k, 1.3% for AGIs $50k-75k, 2.0% for AGIs $75k-100k, 2.3% for AGIs over 100k)
Profit/loss from farming: +$1,418 (reported on 2.3% of returns)
Here:
+$1,418
State:
-$3,231
(% of AGI for various income ranges: 2.2% for AGIs below $10k, 0.5% for AGIs $25k-50k, -0.2% for AGIs $50k-75k, -0.2% for AGIs $75k-100k)
IRA payment deduction: $3,433 (reported on 1.3% of returns)
27505:
$3,433
North Carolina:
$2,967
Total itemized deductions: $14,999 (24% of AGI, reported on 28.2% of returns)
Here:
$14,999
State:
$19,464
Here:
24.2% of AGI
State:
22.7% of AGI
(% of AGI for various income ranges: 10.4% for AGIs below $10k, 5.1% for AGIs $10k-25k, 12.0% for AGIs $25k-50k, 14.4% for AGIs $50k-75k, 14.1% for AGIs $75k-100k, 16.1% for AGIs over 100k)
Charity contributions deductions: $3,103 (5% of AGI, reported on 23.4% of returns)
Here:
$3,103
State:
$4,035
Here:
4.7% of AGI
State:
4.5% of AGI
(% of AGI for various income ranges: 0.8% for AGIs below $10k, 0.5% for AGIs $10k-25k, 2.1% for AGIs $25k-50k, 2.7% for AGIs $50k-75k, 2.4% for AGIs $75k-100k, 2.8% for AGIs over 100k)
Total tax: $4,105 (reported on 67.7% of returns)
27505:
$4,105
State:
$7,257
(% of AGI for various income ranges: 3.9% for AGIs below $10k, 3.3% for AGIs $10k-25k, 6.0% for AGIs $25k-50k, 8.3% for AGIs $50k-75k, 10.3% for AGIs $75k-100k, 16.0% for AGIs over 100k)
Earned income credit: $1,923 (reported on 26.4% of returns)
Here:
$1,923
State:
$1,851
Percentage of individuals using paid preparers for their 2004 taxes: 72.0%
Here:
72%
State:
62%
(% for various income ranges: 64.2% for AGIs below $10k, 75.8% for AGIs $10k-25k, 71.6% for AGIs $25k-50k, 75.1% for AGIs $50k-75k, 71.8% for AGIs $75k-100k, 72.7% for AGIs over 100k)
Household received Food Stamps/SNAP in the past 12 months: 737 Household did not receive Food Stamps/SNAP in the past 12 months: 2,296
Women who had a birth in the past 12 months: 127 (55 now married, 69 unmarried) Women who did not have a birth in the past 12 months: 1,866 (1,046 now married, 825 unmarried)
Housing units in zip code 27505 with a mortgage: 1,240 (110 second mortgage, 109 both second mortgage and home equity loan) Houses without a mortgage: 14
Median monthly owner costs for units with a mortgage: $1,355 Median monthly owner costs for units without a mortgage: $376
Residents with income below the poverty level in 2022:
This zip code:
13.8%
Whole state:
12.8%
Residents with income below 50% of the poverty level in 2022:
This zip code:
12.9%
Whole state:
6.8%
Median number of rooms in houses and condos:
Here:
5.9
State:
6.4
Median number of rooms in apartments:
Here:
5.6
State:
4.4
Notable locations in this zip code not listed on our city pages
Churches in zip code 27505 include: Holly Springs Church (A), Leaflet Church (B), Union Grove Church (C), Moore-Union Church (D), Mount Pisgah Church (E), Williams Chapel (F), Cameron Grove Church (G), Chapel Hill Church (H), Paradise Church (I). Display/hide their locations on the map
Streams, rivers, and creeks: Dry Branch (A), Cedar Creek (B), Camels Creek (C), Big Branch (D), Daniels Creek (E), Schoolhouse Branch (F), Mill Creek (G), McDougald Branch (H), Kiln Branch (I). Display/hide their locations on the map
In group quarters: 7 (-1 institutionalized population)
Size of family households: 890 2-persons, 512 3-persons, 409 4-persons, 186 5-persons, 55 6-persons, 48 7-or-more-persons
Size of nonfamily households: 671 1-person, 228 2-persons
1,019 married couples with children.
728 single-parent households (226 men, 502 women).
90.5% of residents of 27505 zip code speak English at home.
8.2% of residents speak Spanish at home (74% very well, 19% well, 7% not well).
0.5% of residents speak other Indo-European language at home (81% very well, 8% well, 11% not well).
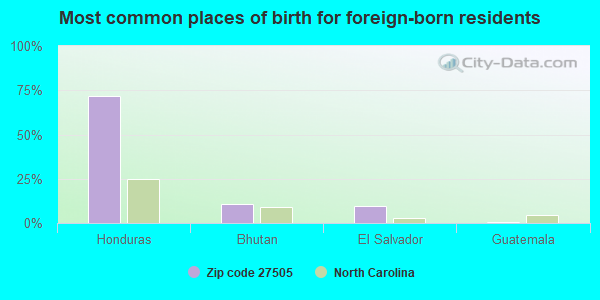
Foreign born population: 244 (3.2%) (38.8% of them are naturalized citizens)
This zip code:
3.2%
Whole state:
8.6%
72%Honduras
11%Bhutan
10%El Salvador
0%Guatemala
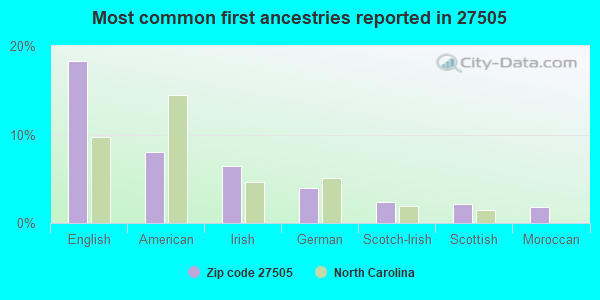
18%English
8%American
6%Irish
4%German
2%Scotch-Irish
2%Scottish
2%Moroccan
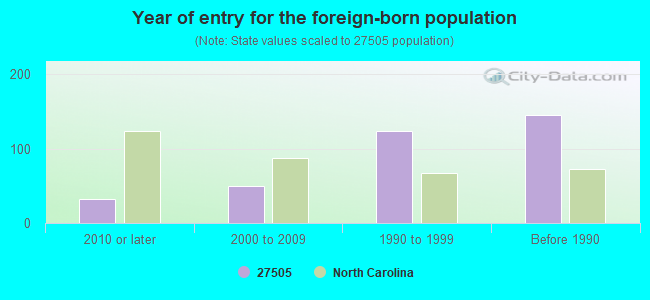
Year of entry for the foreign-born population
322010 or later
502000 to 2009
1231990 to 1999
145Before 1990
Facilities with environmental interests located in this zip code:
BROADWAY ELEMENTARY (307 S MAIN ST in BROADWAY, NC)
(National Center for Education Statistics) - STATE ID-308 Organizations: LEE COUNTY SCHOOLS (SCHOOL DISTRICT)
BROADWAY WWTP (OFF NCSR 1542 in BROADWAY, NC)
National Pollutant Discharge Elimination System NON-MAJOR (Tracking pollutant discharge elimination systems) - permit Business SIC classification: SEWERAGE SYSTEMS Alternative names: BROADWAY, TOWN - WWTP
Housing units lacking complete plumbing facilities: 5.4% Housing units lacking complete kitchen facilities: 4.6%
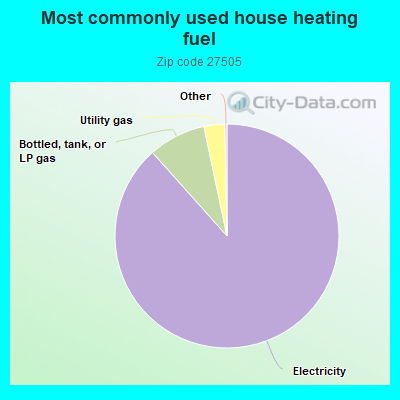
88.5%Electricity
8.3%Bottled, tank, or LP gas
3.0%Utility gas
Population in 1990: 5,551.
Place of birth for U.S.-born residents:
This state: 5,263
Northeast: 621
Midwest: 372
South: 881
West: 135
63% of the 27505 zip code residents lived in the same house 5 years ago. Out of people who lived in different houses, 31% lived in this county. Out of people who lived in different counties, 50% lived in North Carolina.
93% of the 27505 zip code residents lived in the same house 1 year ago. Out of people who lived in different houses, 25% moved from this county. Out of people who lived in different houses, 52% moved from different county within same state. Out of people who lived in different houses, 29% moved from different state. Out of people who lived in different houses, 4% moved from abroad.
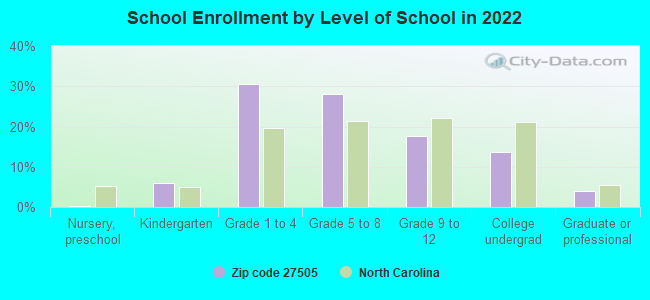
Private vs. public school enrollment:
Students in private schools in grades 1 to 8 (elementary and middle school): 47
Here:
4.1%
North Carolina:
13.8%
Students in private schools in grades 9 to 12 (high school): 42
Here:
12.3%
North Carolina:
11.9%
Students in private undergraduate colleges: 22
Here:
8.4%
North Carolina:
19.3%
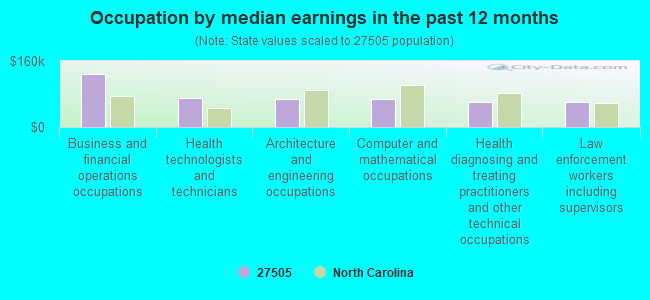
Occupation by median earnings in the past 12 months ($)
128,996Business and financial operations occupations
69,472Health technologists and technicians
67,089Architecture and engineering occupations
66,948Computer and mathematical occupations
61,155Health diagnosing and treating practitioners and other technical occupations
60,811Law enforcement workers including supervisors
Companies with federal contracts located in this zip code:
GARY F. SHAFFER (188 MCCLOUD ROAD in BROADWAY, NC; small business) : $12,537 in 3 contractsin 2000
$5,166 with Army for Maintenance, Repair or Alteration of Real Property -- Tank Automotive Facilities. Signed on 2000-04-27. Completion date: 2000-06-07.
$3,865 with Army for Maintenance, Repair or Alteration of Real Property -- Office Buildings. Signed on 2000-03-07. Completion date: 2000-04-07.
$3,506, same as above.Signed on 2000-02-23. Completion date: 2000-04-04.
Top industries in this zip code by the number of employees in 2005:
Other Services (except Public Administration): Religious Organizations (10-19: 1, 5-9: 1, 1-4: 3)
Health Care and Social Assistance: Offices of Dentists (10-19: 1, 5-9: 1)
Health Care and Social Assistance: Other Residential Care Facilities (10-19: 1)
Finance and Insurance: Commercial Banking (5-9: 2)
Other Services (except Public Administration): General Automotive Repair (5-9: 1, 1-4: 2)
People in group quarters in 2010:
4 people in workers' group living quarters and job corps centers
Fatal accident statistics in 2014:
Fatal accident count: 1
Vehicles involved in fatal accidents: 1
Fatal accidents caused by drunken drivers: 1
Fatalities: 1
Persons involved in fatal accidents: 1
Pedestrians involved in fatal accidents: 0
Fatal accident statistics in 2013:
Fatal accident count: 1
Vehicles involved in fatal accidents: 1
Fatal accidents caused by drunken drivers: 1
Fatalities: 4
Persons involved in fatal accidents: 4
Pedestrians involved in fatal accidents: 0
2002 - 2018 National Fire Incident Reporting System (NFIRS) incidents
Based on the data from the years 2002 - 2018 the average number of fires per year is 57. The highest number of reported fire incidents - 80 took place in 2010, and the least - 44 in 2009. The data has a rising trend.
When looking into fire subcategories, the most incidents belonged to: Structure Fires (45.4%), and Outside Fires (37.6%).
Fire incident types reported to NFIRS in Zip Code 27505


+$1,418
-$3,231
(% of AGI for various income ranges: 2.2% for AGIs below $10k, 0.5% for AGIs $25k-50k, -0.2% for AGIs $50k-75k, -0.2% for AGIs $75k-100k) Nearest zip codes: 27332, 27546, 28323, 28390, 27526, 27330.
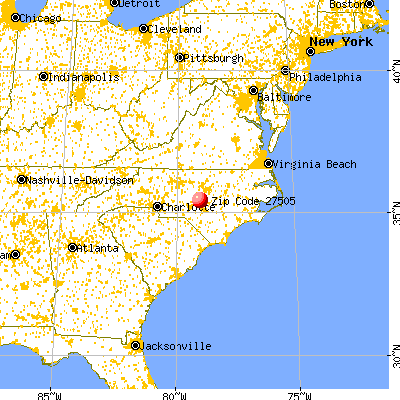


 Based on the data from the years 2002 - 2018 the average number of fires per year is 57. The highest number of reported fire incidents - 80 took place in 2010, and the least - 44 in 2009. The data has a rising trend.
 When looking into fire subcategories, the most incidents belonged to: Structure Fires (45.4%), and Outside Fires (37.6%).