Estimated zip code population in 2022: 7,444 Zip code population in 2010: 7,358 Zip code population in 2000: 6,127
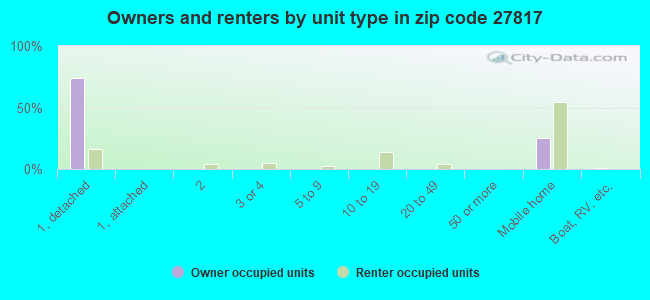
Houses and condos: 3,674 Renter-occupied apartments: 705
% of renters here:
23%
State:
33%
March 2022 cost of living index in zip code 27817: 79.8 (low, U.S. average is 100)
Land area: 112.3 sq. mi. Water area: 4.4 sq. mi.
Population density: 66 people per square mile
(very low).
OSM Map
General Map
Google Map
MSN Map
OSM Map
General Map
Google Map
MSN Map
OSM Map
General Map
Google Map
MSN Map
OSM Map
General Map
Google Map
MSN Map
Please wait while loading the map...
Real estate property taxes paid for housing units in 2022:
This zip code:
0.7% ($1,295)
North Carolina:
0.6% ($1,769)
Median real estate property taxes paid for housing units with mortgages in 2022: $1,860 (0.6%) Median real estate property taxes paid for housing units with no mortgage in 2022: $879 (0.7%)
Business Search- 14 Million verified businesses
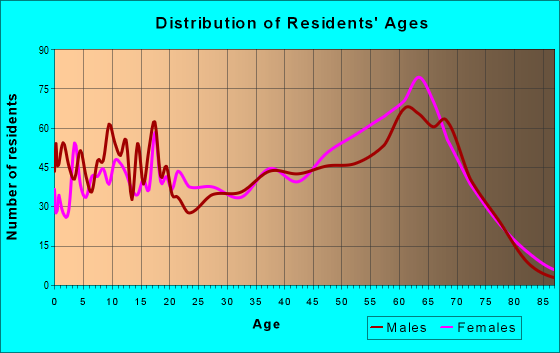
Males: 3,464
(46.5%)
Females: 3,980
(53.5%)
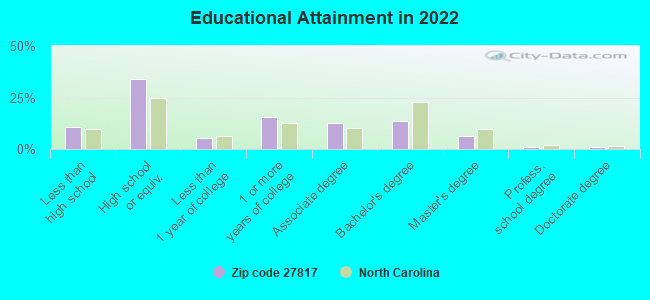
For population 25 years and over in 27817:
High school or higher: 88.1%
Bachelor's degree or higher: 21.4%
Graduate or professional degree: 8.1%
Unemployed: 5.3%
Mean travel time to work (commute): 25.0 minutes
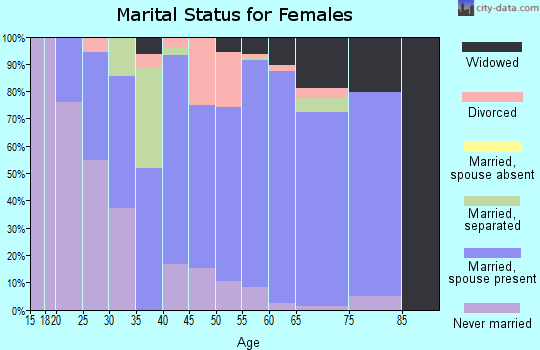
For population 15 years and over in 27817:
Never married: 24.8%
Now married: 58.2%
Separated: 1.6%
Widowed: 6.2%
Divorced: 9.2%
Zip code 27817 compared to state average:
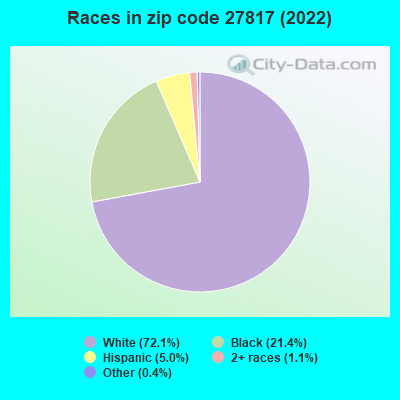
Hispanic race population percentage below state average.
Median age significantly above state average.
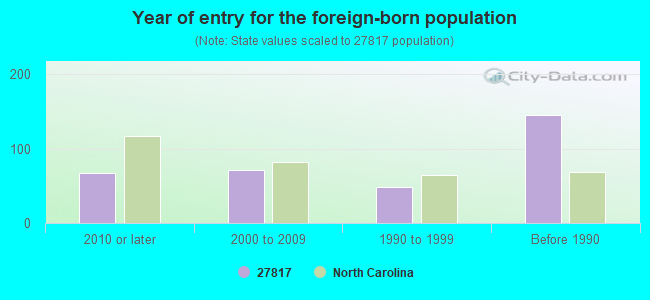
Foreign-born population percentage significantly below state average.
Length of stay since moving in significantly above state average.
Percentage of population with a bachelor's degree or higher below state average.
Averages for the 2020 tax year for zip code 27817, filed in 2021:
Average Adjusted Gross Income (AGI) in 2020: $60,909 (Individual Income Tax Returns)
Here:
$60,909
State:
$70,020
Salary/wage: $47,006 (reported on 75.4% of returns)
Here:
$47,006
State:
$58,387
(% of AGI for various income ranges: 1226.0% for AGIs below $25k, 3712.1% for AGIs $25k-50k, 6584.3% for AGIs $50k-75k, 7913.3% for AGIs $75k-100k, 14283.5% for AGIs $100k-200k, 61980.0% for AGIs over 200k)
Taxable interest for individuals: $1,408 (reported on 33.6% of returns)
This zip code:
$1,408
North Carolina:
$1,479
(% of AGI for various income ranges: 12.6% for AGIs below $25k, 22.9% for AGIs $25k-50k, 62.5% for AGIs $50k-75k, 101.1% for AGIs $75k-100k, 218.1% for AGIs $100k-200k, 1520.0% for AGIs over 200k)
Ordinary dividends: $7,026 (reported on 19.1% of returns)
Here:
$7,026
State:
$7,888
(% of AGI for various income ranges: 19.7% for AGIs below $25k, 65.6% for AGIs $25k-50k, 110.7% for AGIs $50k-75k, 236.1% for AGIs $75k-100k, 688.8% for AGIs $100k-200k, 5103.3% for AGIs over 200k)
Net capital gain/loss in AGI: +$12,821 (reported on 18.3% of returns)
Here:
+$12,821
State:
+$23,652
(% of AGI for various income ranges: 0.9% for AGIs below $25k, 53.9% for AGIs $25k-50k, 81.8% for AGIs $50k-75k, 276.1% for AGIs $75k-100k, 770.4% for AGIs $100k-200k, 16686.7% for AGIs over 200k)
Profit/loss from business: +$9,622 (reported on 14.2% of returns)
Here:
+$9,622
State:
+$11,710
(% of AGI for various income ranges: 110.1% for AGIs below $25k, 96.9% for AGIs $25k-50k, 71.8% for AGIs $50k-75k, 196.1% for AGIs $75k-100k, 358.1% for AGIs $100k-200k, 5533.3% for AGIs over 200k)
Taxable individual retirement arrangement distribution: $23,620 (reported on 14.2% of returns)
27817:
$23,620
North Carolina:
$20,247
(% of AGI for various income ranges: 63.0% for AGIs below $25k, 132.1% for AGIs $25k-50k, 373.6% for AGIs $50k-75k, 766.7% for AGIs $75k-100k, 2361.5% for AGIs $100k-200k, 5450.0% for AGIs over 200k)
Total itemized deductions: $32,038 (reported on 6.1% of returns)
Here:
$32,038
State:
$34,549
(% of AGI for various income ranges: 132.6% for AGIs $25k-50k, 365.4% for AGIs $50k-75k, 340.0% for AGIs $75k-100k, 896.5% for AGIs $100k-200k, 6466.7% for AGIs over 200k)
Charity contributions: $9,911 (reported on 5.5% of returns)
Here:
$9,911
State:
$13,360
(% of AGI for various income ranges: 18.9% for AGIs $25k-50k, 65.0% for AGIs $50k-75k, 107.8% for AGIs $75k-100k, 300.8% for AGIs $100k-200k, 2026.7% for AGIs over 200k)
Taxes paid: $6,733 (reported on 6.1% of returns)
27817:
$6,733
State:
$7,586
(% of AGI for various income ranges: 20.2% for AGIs $25k-50k, 41.1% for AGIs $50k-75k, 77.8% for AGIs $75k-100k, 237.7% for AGIs $100k-200k, 1386.7% for AGIs over 200k)
Earned income credit: $2,543 (reported on 19.7% of returns)
Here:
$2,543
State:
$2,337
(% of AGI for various income ranges: 136.9% for AGIs below $25k, 84.5% for AGIs $25k-50k)
Percentage of individuals using paid preparers for their 2020 taxes: 91.9%
Here:
92%
State:
93%
(% for various income ranges: 91.6% for AGIs below $25k, 90.7% for AGIs $25k-50k, 90.9% for AGIs $50k-75k, 93.1% for AGIs $75k-100k, 92.7% for AGIs $100k-200k, 100.0% for AGIs over 200k)
Averages for the 2012 tax year for zip code 27817, filed in 2013:
Average Adjusted Gross Income (AGI) in 2012: $50,920 (Individual Income Tax Returns)
Here:
$50,920
State:
$54,937
Salary/wage: $36,401 (reported on 77.4% of returns)
Here:
$36,401
State:
$46,336
(% of AGI for various income ranges: 76.4% for AGIs below $25k, 77.0% for AGIs $25k-50k, 66.3% for AGIs $50k-75k, 51.6% for AGIs $75k-100k, 39.6% for AGIs $100k-200k, 38.6% for AGIs over 200k)
Taxable interest for individuals: $1,470 (reported on 34.8% of returns)
This zip code:
$1,470
North Carolina:
$1,298
(% of AGI for various income ranges: 1.2% for AGIs below $25k, 0.7% for AGIs $25k-50k, 0.7% for AGIs $50k-75k, 1.0% for AGIs $75k-100k, 1.2% for AGIs $100k-200k, 1.2% for AGIs over 200k)
Ordinary dividends: $5,241 (reported on 20.1% of returns)
Here:
$5,241
State:
$6,213
(% of AGI for various income ranges: 1.0% for AGIs below $25k, 1.0% for AGIs $25k-50k, 1.5% for AGIs $50k-75k, 1.9% for AGIs $75k-100k, 3.0% for AGIs $100k-200k, 3.0% for AGIs over 200k)
Net capital gain/loss in AGI: +$5,286 (reported on 18.5% of returns)
Here:
+$5,286
State:
+$12,740
(% of AGI for various income ranges: 0.4% for AGIs below $25k, 1.0% for AGIs $50k-75k, 0.8% for AGIs $75k-100k, 1.9% for AGIs $100k-200k, 7.4% for AGIs over 200k)
Profit/loss from business: +$6,629 (reported on 15.0% of returns)
Here:
+$6,629
State:
+$10,311
(% of AGI for various income ranges: 7.8% for AGIs below $25k, 1.5% for AGIs $25k-50k, 1.4% for AGIs $50k-75k, 0.2% for AGIs $75k-100k, 2.2% for AGIs $100k-200k)
Taxable individual retirement arrangement distribution: $22,350 (reported on 16.3% of returns)
27817:
$22,350
North Carolina:
$15,575
(% of AGI for various income ranges: 3.6% for AGIs below $25k, 2.8% for AGIs $25k-50k, 5.3% for AGIs $50k-75k, 8.4% for AGIs $75k-100k, 11.4% for AGIs $100k-200k, 7.0% for AGIs over 200k)
Total itemized deductions: $21,679 (22% of AGI, reported on 29.5% of returns)
Here:
$21,679
State:
$23,438
Here:
22.2% of AGI
State:
21.5% of AGI
(% of AGI for various income ranges: 8.5% for AGIs below $25k, 11.0% for AGIs $25k-50k, 12.2% for AGIs $50k-75k, 12.9% for AGIs $75k-100k, 14.9% for AGIs $100k-200k, 12.6% for AGIs over 200k)
Charity contributions: $4,601 (reported on 25.1% of returns)
Here:
$4,601
State:
$4,687
(% of AGI for various income ranges: 1.0% for AGIs below $25k, 1.5% for AGIs $25k-50k, 2.0% for AGIs $50k-75k, 2.6% for AGIs $75k-100k, 3.0% for AGIs $100k-200k, 2.7% for AGIs over 200k)
Taxes paid: $7,180 (reported on 29.2% of returns)
27817:
$7,180
State:
$8,823
(% of AGI for various income ranges: 1.0% for AGIs below $25k, 1.9% for AGIs $25k-50k, 3.2% for AGIs $50k-75k, 4.1% for AGIs $75k-100k, 5.6% for AGIs $100k-200k, 7.0% for AGIs over 200k)
Earned income credit: $2,467 (reported on 26.6% of returns)
Here:
$2,467
State:
$2,376
(% of AGI for various income ranges: 9.7% for AGIs below $25k, 1.5% for AGIs $25k-50k)
Percentage of individuals using paid preparers for their 2012 taxes: 57.4%
Here:
57%
State:
53%
(% for various income ranges: 54.8% for AGIs below $25k, 56.8% for AGIs $25k-50k, 61.0% for AGIs $50k-75k, 64.3% for AGIs $75k-100k, 57.1% for AGIs $100k-200k, 66.7% for AGIs over 200k)
Averages for the 2004 tax year for zip code 27817, filed in 2005:
Average Adjusted Gross Income (AGI) in 2004: $43,927 (Individual Income Tax Returns)
Here:
$43,927
State:
$45,376
Salary/wage: $36,735 (reported on 83.1% of returns)
Here:
$36,735
State:
$39,442
(% of AGI for various income ranges: 102.2% for AGIs below $10k, 81.6% for AGIs $10k-25k, 78.0% for AGIs $25k-50k, 68.4% for AGIs $50k-75k, 56.3% for AGIs $75k-100k, 64.6% for AGIs over 100k)
Taxable interest for individuals: $1,631 (reported on 39.1% of returns)
This zip code:
$1,631
North Carolina:
$1,515
(% of AGI for various income ranges: 6.3% for AGIs below $10k, 1.7% for AGIs $10k-25k, 1.1% for AGIs $25k-50k, 1.2% for AGIs $50k-75k, 2.1% for AGIs $75k-100k, 1.2% for AGIs over 100k)
Taxable dividends: $3,651 (reported on 20.3% of returns)
Here:
$3,651
State:
$4,016
(% of AGI for various income ranges: 2.3% for AGIs below $10k, 0.6% for AGIs $10k-25k, 0.7% for AGIs $25k-50k, 1.6% for AGIs $50k-75k, 1.8% for AGIs $75k-100k, 2.5% for AGIs over 100k)
Net capital gain/loss: +$5,565 (reported on 18.0% of returns)
Here:
+$5,565
State:
+$11,152
(% of AGI for various income ranges: 0.8% for AGIs below $10k, -0.1% for AGIs $10k-25k, 0.4% for AGIs $25k-50k, 0.6% for AGIs $50k-75k, 2.6% for AGIs $75k-100k, 4.7% for AGIs over 100k)
Profit/loss from business: +$7,032 (reported on 14.9% of returns)
Here:
+$7,032
State:
+$9,490
(% of AGI for various income ranges: 4.3% for AGIs below $10k, 4.0% for AGIs $10k-25k, 2.7% for AGIs $25k-50k, 2.0% for AGIs $50k-75k, 1.6% for AGIs $75k-100k, 2.0% for AGIs over 100k)
IRA payment deduction: $3,557 (reported on 2.7% of returns)
27817:
$3,557
North Carolina:
$2,967
(% of AGI for various income ranges: 0.2% for AGIs $10k-25k, 0.3% for AGIs $25k-50k, 0.4% for AGIs $50k-75k, 0.2% for AGIs $75k-100k, 0.1% for AGIs over 100k)
Self-employed pension: $10,400 (reported on 0.7% of returns)
Here:
$10,400
North Carolina:
$14,754
Total itemized deductions: $19,777 (20% of AGI, reported on 27.0% of returns)
Here:
$19,777
State:
$19,464
Here:
20.2% of AGI
State:
22.7% of AGI
(% of AGI for various income ranges: 7.1% for AGIs below $10k, 6.1% for AGIs $10k-25k, 9.6% for AGIs $25k-50k, 14.5% for AGIs $50k-75k, 16.3% for AGIs $75k-100k, 13.2% for AGIs over 100k)
Charity contributions deductions: $3,770 (4% of AGI, reported on 24.6% of returns)
Here:
$3,770
State:
$4,035
Here:
3.6% of AGI
State:
4.5% of AGI
(% of AGI for various income ranges: 0.8% for AGIs $10k-25k, 1.8% for AGIs $25k-50k, 2.8% for AGIs $50k-75k, 3.3% for AGIs $75k-100k, 2.1% for AGIs over 100k)
Total tax: $7,716 (reported on 67.8% of returns)
27817:
$7,716
State:
$7,257
(% of AGI for various income ranges: 3.8% for AGIs below $10k, 3.1% for AGIs $10k-25k, 6.0% for AGIs $25k-50k, 8.2% for AGIs $50k-75k, 10.5% for AGIs $75k-100k, 20.1% for AGIs over 100k)
Earned income credit: $2,055 (reported on 26.6% of returns)
Here:
$2,055
State:
$1,851
Percentage of individuals using paid preparers for their 2004 taxes: 67.0%
Here:
67%
State:
62%
(% for various income ranges: 63.4% for AGIs below $10k, 71.3% for AGIs $10k-25k, 70.3% for AGIs $25k-50k, 62.5% for AGIs $50k-75k, 64.4% for AGIs $75k-100k, 59.4% for AGIs over 100k)
Household received Food Stamps/SNAP in the past 12 months: 529 Household did not receive Food Stamps/SNAP in the past 12 months: 2,571
Women who had a birth in the past 12 months: 39 (40 now married, 0 unmarried) Women who did not have a birth in the past 12 months: 1,441 (598 now married, 842 unmarried)
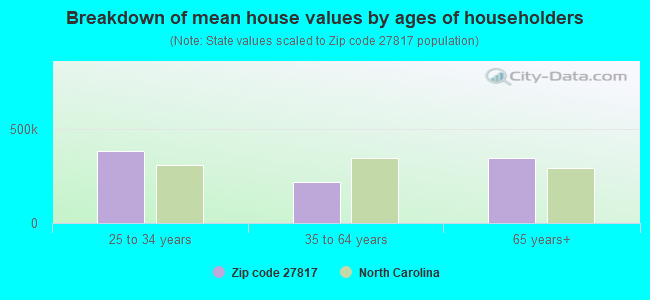
Housing units in zip code 27817 with a mortgage: 1,176 (78 second mortgage, 56 both second mortgage and home equity loan) Houses without a mortgage: 3
Median monthly owner costs for units with a mortgage: $1,363 Median monthly owner costs for units without a mortgage: $497
Residents with income below the poverty level in 2022:
This zip code:
14.1%
Whole state:
12.8%
Residents with income below 50% of the poverty level in 2022:
This zip code:
11.2%
Whole state:
6.8%
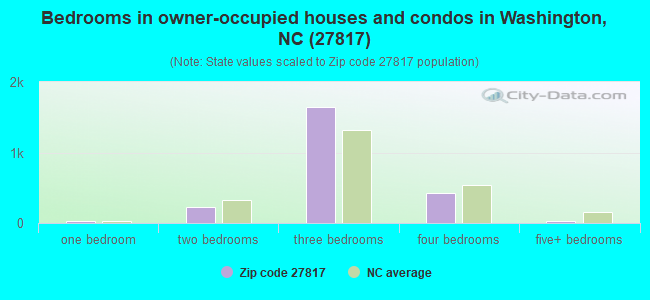
Median number of rooms in houses and condos:
Here:
5.7
State:
6.4
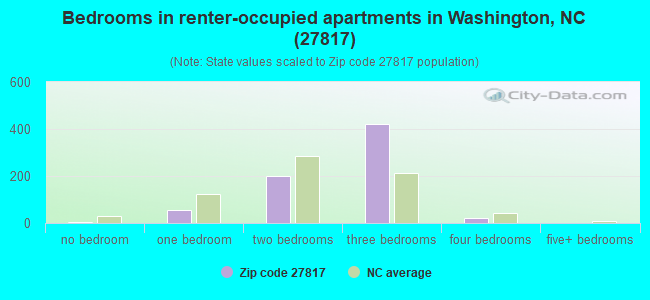
Median number of rooms in apartments:
Here:
4.5
State:
4.4
Notable locations in this zip code not listed on our city pages
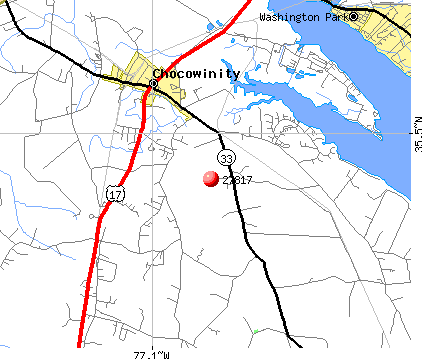
Churches in zip code 27817 include: Haw Branch Church (A), Hodges Chapel (B), Trinity Church (C), Union Chapel (D), Beech Grove Church (E), Wayside Church (F), Cedar Grove Church (G), One Way Church (H), Piney Grove Church (I). Display/hide their locations on the map
Streams, rivers, and creeks: Dupree Creek (A), Chocowinity Creek (B), Crawford Creek (C), Cindy Edwards Branch (D), Chapel Branch (E), Cedar Creek (F), Cals Creek (G), Brown Branch (H), Bay Branch (I). Display/hide their locations on the map
In group quarters: 24 (-1 institutionalized population)
Size of family households: 1,271 2-persons, 474 3-persons, 356 4-persons, 87 5-persons, 23 6-persons, 48 7-or-more-persons
Size of nonfamily households: 753 1-person, 75 2-persons, 5 3-persons
595 married couples with children.
412 single-parent households (39 men, 373 women).
95.8% of residents of 27817 zip code speak English at home.
3.7% of residents speak Spanish at home (62% very well, 20% well, 11% not well, 6% not at all).
0.5% of residents speak other Indo-European language at home (66% very well, 34% well).
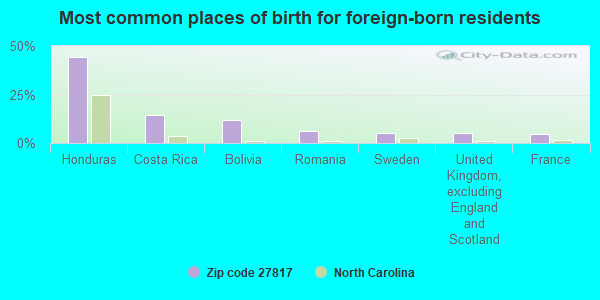
Foreign born population: 230 (3.1%) (31.1% of them are naturalized citizens)
This zip code:
3.1%
Whole state:
8.6%
44%Honduras
14%Costa Rica
12%Bolivia
6%Romania
5%Sweden
5%United Kingdom, excluding England and Scotland
5%France
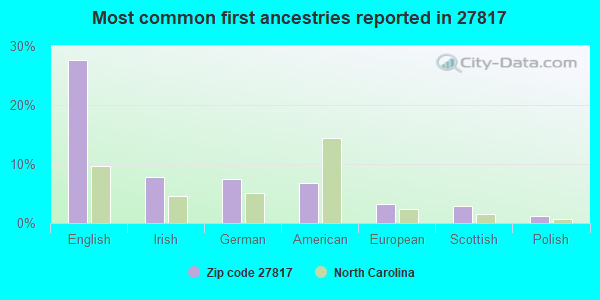
28%English
8%Irish
7%German
7%American
3%European
3%Scottish
1%Polish
Year of entry for the foreign-born population
672010 or later
712000 to 2009
481990 to 1999
145Before 1990
Facilities with environmental interests located in this zip code:
DPD CONCRETE CHOCOWINITY (PATRICK LANE in CHOCOWINITY, NC)
AIR MINOR (AIRS/AFS) STATE MASTER (North Carolina facility info) - -115DA4YG00UT2W84DX0KG7PKRC, WASTEWATER FACILITY, -3250, AIR PROGRAM Business SIC classification: READY-MIXED CONCRETE Alternative names: GREENVILLE READY MIX CONCRETE COMPANY
CHOCOWINITY MIDDLE (3831 US HWY 17 S in CHOCOWINITY, NC)
(National Center for Education Statistics) - STATE ID-325 Organizations: BEAUFORT COUNTY SCHOOLS (SCHOOL DISTRICT)
CHOCOWINITY PRIMARY (606 GRAY ROAD in CHOCOWINITY, NC)
(National Center for Education Statistics) - STATE ID-326 Organizations: BEAUFORT COUNTY SCHOOLS (SCHOOL DISTRICT)
CHOCOWINITY/RICHLAND TOWNSHIP (WINDMILL RD in CHOCOWINITY, NC)
National Pollutant Discharge Elimination System NON-MAJOR (Tracking pollutant discharge elimination systems) - permit Business SIC classification: WATER SUPPLY Alternative names: BEAUFORT CO WTR DIS VI CHOCOWI
DPD TEAM CONCRETE - CHOCOWINIT (394 PATRICK LN in CHOCOWINITY, NC)
National Pollutant Discharge Elimination System NON-MAJOR (Tracking pollutant discharge elimination systems) - permit Business SIC classification: READY-MIXED CONCRETE Alternative names: GREENVILLE READY MIXED CNCRTE
Housing units lacking complete plumbing facilities: 4.8% Housing units lacking complete kitchen facilities: 3.1%
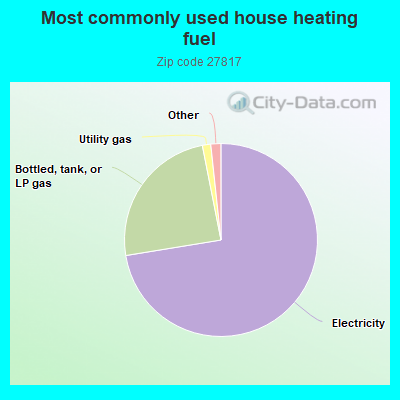
72.5%Electricity
24.5%Bottled, tank, or LP gas
1.4%Utility gas
0.5%Fuel oil, kerosene, etc.
0.5%Wood
Population in 1990: 5,553. Population change in the 1990s: +574 (+10.3%).
Place of birth for U.S.-born residents:
This state: 4,840
Northeast: 750
Midwest: 380
South: 909
West: 175
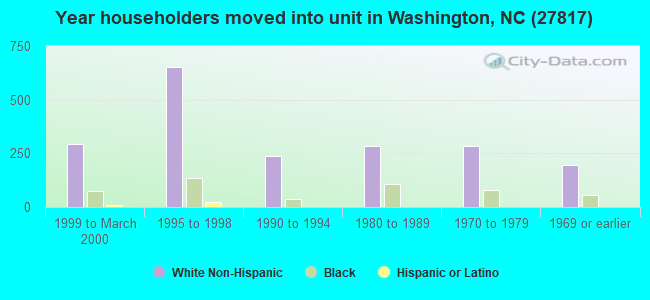
58% of the 27817 zip code residents lived in the same house 5 years ago. Out of people who lived in different houses, 49% lived in this county. Out of people who lived in different counties, 50% lived in North Carolina.
94% of the 27817 zip code residents lived in the same house 1 year ago. Out of people who lived in different houses, 50% moved from this county. Out of people who lived in different houses, 21% moved from different county within same state. Out of people who lived in different houses, 35% moved from different state.
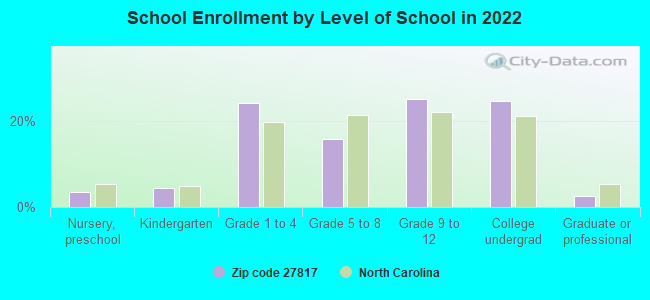
Private vs. public school enrollment:
Students in private schools in grades 1 to 8 (elementary and middle school): 27
Here:
5.1%
North Carolina:
13.8%
Students in private schools in grades 9 to 12 (high school): 12
Here:
3.7%
North Carolina:
11.9%
Students in private undergraduate colleges: 27
Here:
8.0%
North Carolina:
19.3%
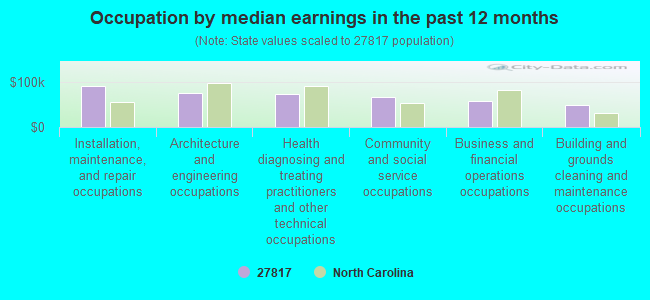
Occupation by median earnings in the past 12 months ($)
90,853Installation, maintenance, and repair occupations
74,430Architecture and engineering occupations
73,371Health diagnosing and treating practitioners and other technical occupations
66,179Community and social service occupations
57,599Business and financial operations occupations
48,345Building and grounds cleaning and maintenance occupations
Top industries in this zip code by the number of employees in 2005:
Health Care and Social Assistance: Residential Mental Retardation Facilities (20-49: 1, 10-19: 1)
Other Services (except Public Administration): Commercial and Industrial Machinery and Equipment (except Automotive and Electronic) Repair and Maintenance (20-49: 1, 1-4: 2)
Health Care and Social Assistance: Homes for the Elderly (20-49: 1)
Construction: All Other Specialty Trade Contractors (20-49: 1)
Arts, Entertainment, and Recreation: Golf Courses and Country Clubs (20-49: 1)
Real Estate and Rental and Leasing: Lessors of Other Real Estate Property (10-19: 1, 1-4: 1)
People in group quarters in 2010:
11 people in group homes intended for adults
People in group quarters in 2000:
6 people in other nonhousehold living situations
Fatal accident statistics in 2014:
Fatal accident count: 2
Vehicles involved in fatal accidents: 2
Fatal accidents caused by drunken drivers: 1
Fatalities: 2
Persons involved in fatal accidents: 3
Pedestrians involved in fatal accidents: 0
Fatal accident statistics in 2013:
Fatal accident count: 2
Vehicles involved in fatal accidents: 3
Fatal accidents caused by drunken drivers: 1
Fatalities: 2
Persons involved in fatal accidents: 6
Pedestrians involved in fatal accidents: 0
2003 - 2018 National Fire Incident Reporting System (NFIRS) incidents
According to the data from the years 2003 - 2018 the average number of fires per year is 40. The highest number of reported fire incidents - 60 took place in 2018, and the least - 19 in 2009. The data has a rising trend.
When looking into fire subcategories, the most incidents belonged to: Structure Fires (38.8%), and Outside Fires (31.0%).
Fire incident types reported to NFIRS in Zip Code 27817
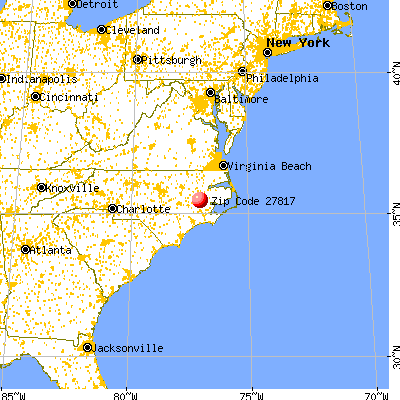


 Nearest zip codes: 27889, 27837, 27814, 28586, 28527, 27858.
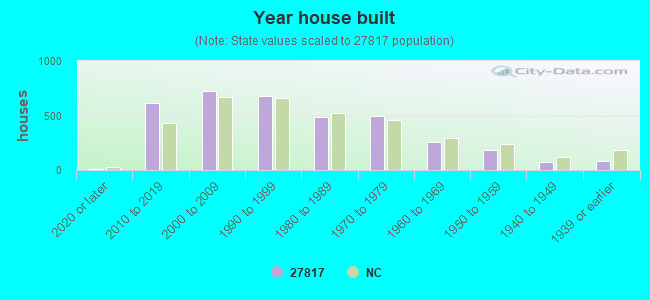


 According to the data from the years 2003 - 2018 the average number of fires per year is 40. The highest number of reported fire incidents - 60 took place in 2018, and the least - 19 in 2009. The data has a rising trend.
 When looking into fire subcategories, the most incidents belonged to: Structure Fires (38.8%), and Outside Fires (31.0%).