Estimated zip code population in 2022: 39,509 Zip code population in 2010: 33,307 Zip code population in 2000: 25,617
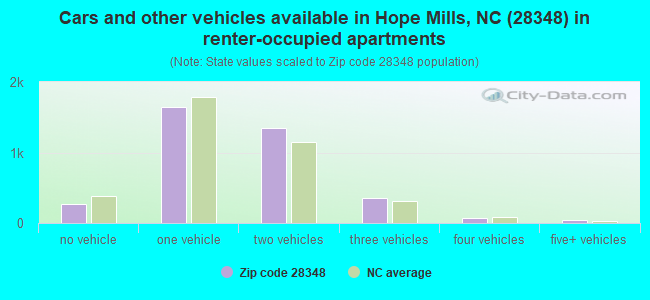
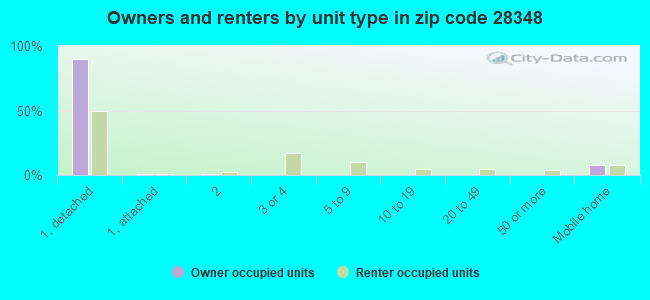
Houses and condos: 14,592 Renter-occupied apartments: 3,725
% of renters here:
27%
State:
33%
March 2022 cost of living index in zip code 28348: 89.1 (less than average, U.S. average is 100)
Land area: 44.3 sq. mi. Water area: 0.5 sq. mi.
Population density: 892 people per square mile
(low).
OSM Map
General Map
Google Map
MSN Map
OSM Map
General Map
Google Map
MSN Map
OSM Map
General Map
Google Map
MSN Map
OSM Map
General Map
Google Map
MSN Map
Please wait while loading the map...
Real estate property taxes paid for housing units in 2022:
This zip code:
0.8% ($1,784)
North Carolina:
0.6% ($1,769)
Median real estate property taxes paid for housing units with mortgages in 2022: $1,891 (0.8%) Median real estate property taxes paid for housing units with no mortgage in 2022: $1,331 (0.8%)
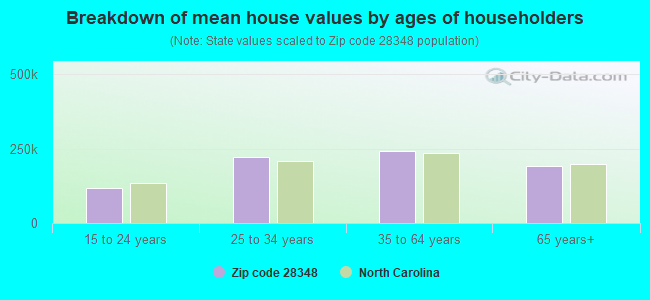
Estimated median house/condo value in 2022: $215,616
28348:
$215,616
North Carolina:
$280,600
According to our research of North Carolina and other state lists, there were 66 registered sex offenders living in 28348 zip code as of April 27, 2024. The ratio of all residents to sex offenders in zip code 28348 is 529 to 1. The ratio of registered sex offenders to all residents in this zip code is near the state average.
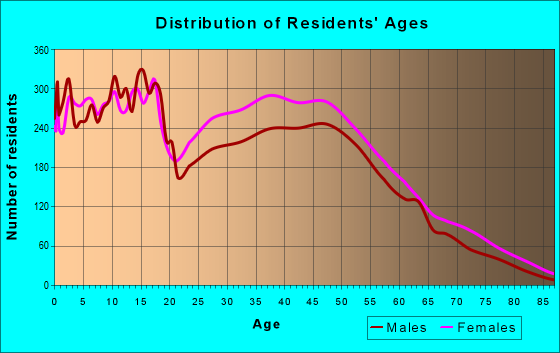
Median resident age:
This zip code:
34.1 years
North Carolina median age:
39.2 years
Average household size:
This zip code:
2.9 people
North Carolina:
2.4 people
Averages for the 2020 tax year for zip code 28348, filed in 2021:
Average Adjusted Gross Income (AGI) in 2020: $50,348 (Individual Income Tax Returns)
Here:
$50,348
State:
$70,020
Salary/wage: $46,226 (reported on 86.6% of returns)
Here:
$46,226
State:
$58,387
(% of AGI for various income ranges: 1179.2% for AGIs below $25k, 3657.2% for AGIs $25k-50k, 6617.5% for AGIs $50k-75k, 9673.7% for AGIs $75k-100k, 18533.4% for AGIs $100k-200k, 60930.0% for AGIs over 200k)
Taxable interest for individuals: $621 (reported on 18.9% of returns)
This zip code:
$621
North Carolina:
$1,479
(% of AGI for various income ranges: 3.9% for AGIs below $25k, 7.2% for AGIs $25k-50k, 16.5% for AGIs $50k-75k, 23.6% for AGIs $75k-100k, 61.6% for AGIs $100k-200k, 401.4% for AGIs over 200k)
Ordinary dividends: $1,653 (reported on 7.9% of returns)
Here:
$1,653
State:
$7,888
(% of AGI for various income ranges: 3.3% for AGIs below $25k, 6.0% for AGIs $25k-50k, 14.2% for AGIs $50k-75k, 25.2% for AGIs $75k-100k, 83.3% for AGIs $100k-200k, 542.9% for AGIs over 200k)
Net capital gain/loss in AGI: +$5,845 (reported on 8.1% of returns)
Here:
+$5,845
State:
+$23,652
(% of AGI for various income ranges: 0.9% for AGIs below $25k, 8.8% for AGIs $25k-50k, 34.8% for AGIs $50k-75k, 89.4% for AGIs $75k-100k, 236.5% for AGIs $100k-200k, 4981.4% for AGIs over 200k)
Profit/loss from business: +$5,894 (reported on 15.3% of returns)
Here:
+$5,894
State:
+$11,710
(% of AGI for various income ranges: 75.2% for AGIs below $25k, 54.4% for AGIs $25k-50k, 88.0% for AGIs $50k-75k, 228.0% for AGIs $75k-100k, 330.0% for AGIs $100k-200k, 2465.7% for AGIs over 200k)
Taxable individual retirement arrangement distribution: $12,963 (reported on 3.9% of returns)
28348:
$12,963
North Carolina:
$20,247
(% of AGI for various income ranges: 18.2% for AGIs below $25k, 35.8% for AGIs $25k-50k, 76.2% for AGIs $50k-75k, 123.1% for AGIs $75k-100k, 251.5% for AGIs $100k-200k, 925.7% for AGIs over 200k)
Total itemized deductions: $28,797 (reported on 5.6% of returns)
Here:
$28,797
State:
$34,549
(% of AGI for various income ranges: 20.0% for AGIs below $25k, 88.0% for AGIs $25k-50k, 229.8% for AGIs $50k-75k, 449.6% for AGIs $75k-100k, 921.8% for AGIs $100k-200k, 5070.0% for AGIs over 200k)
Charity contributions: $10,928 (reported on 4.8% of returns)
Here:
$10,928
State:
$13,360
(% of AGI for various income ranges: 2.5% for AGIs below $25k, 24.3% for AGIs $25k-50k, 64.0% for AGIs $50k-75k, 138.0% for AGIs $75k-100k, 345.9% for AGIs $100k-200k, 1997.1% for AGIs over 200k)
Taxes paid: $6,271 (reported on 5.5% of returns)
28348:
$6,271
State:
$7,586
(% of AGI for various income ranges: 2.5% for AGIs below $25k, 13.0% for AGIs $25k-50k, 45.8% for AGIs $50k-75k, 96.9% for AGIs $75k-100k, 239.4% for AGIs $100k-200k, 1045.7% for AGIs over 200k)
Earned income credit: $2,506 (reported on 24.9% of returns)
Here:
$2,506
State:
$2,337
(% of AGI for various income ranges: 134.4% for AGIs below $25k, 100.5% for AGIs $25k-50k, 2.7% for AGIs $50k-75k)
Percentage of individuals using paid preparers for their 2020 taxes: 94.1%
Here:
94%
State:
93%
(% for various income ranges: 94.1% for AGIs below $25k, 93.8% for AGIs $25k-50k, 94.4% for AGIs $50k-75k, 94.7% for AGIs $75k-100k, 94.1% for AGIs $100k-200k, 95.5% for AGIs over 200k)
Averages for the 2012 tax year for zip code 28348, filed in 2013:
Average Adjusted Gross Income (AGI) in 2012: $43,766 (Individual Income Tax Returns)
Here:
$43,766
State:
$54,937
Salary/wage: $40,818 (reported on 89.2% of returns)
Here:
$40,818
State:
$46,336
(% of AGI for various income ranges: 83.0% for AGIs below $25k, 87.5% for AGIs $25k-50k, 84.8% for AGIs $50k-75k, 83.6% for AGIs $75k-100k, 81.3% for AGIs $100k-200k, 60.0% for AGIs over 200k)
Taxable interest for individuals: $537 (reported on 22.8% of returns)
This zip code:
$537
North Carolina:
$1,298
(% of AGI for various income ranges: 0.4% for AGIs below $25k, 0.2% for AGIs $25k-50k, 0.2% for AGIs $50k-75k, 0.3% for AGIs $75k-100k, 0.3% for AGIs $100k-200k, 0.6% for AGIs over 200k)
Ordinary dividends: $1,360 (reported on 9.0% of returns)
Here:
$1,360
State:
$6,213
(% of AGI for various income ranges: 0.4% for AGIs below $25k, 0.3% for AGIs $25k-50k, 0.2% for AGIs $50k-75k, 0.3% for AGIs $75k-100k, 0.3% for AGIs $100k-200k, 0.5% for AGIs over 200k)
Net capital gain/loss in AGI: +$1,826 (reported on 6.2% of returns)
Here:
+$1,826
State:
+$12,740
(% of AGI for various income ranges: 0.2% for AGIs $50k-75k, 0.5% for AGIs $100k-200k, 1.7% for AGIs over 200k)
Profit/loss from business: +$6,955 (reported on 13.0% of returns)
Here:
+$6,955
State:
+$10,311
(% of AGI for various income ranges: 6.4% for AGIs below $25k, 1.5% for AGIs $25k-50k, 0.9% for AGIs $50k-75k, 1.0% for AGIs $75k-100k, 2.6% for AGIs $100k-200k)
Taxable individual retirement arrangement distribution: $10,278 (reported on 4.9% of returns)
28348:
$10,278
North Carolina:
$15,575
(% of AGI for various income ranges: 1.4% for AGIs below $25k, 0.9% for AGIs $25k-50k, 0.9% for AGIs $50k-75k, 1.2% for AGIs $75k-100k, 1.6% for AGIs $100k-200k)
Total itemized deductions: $18,548 (25% of AGI, reported on 32.8% of returns)
Here:
$18,548
State:
$23,438
Here:
24.7% of AGI
State:
21.5% of AGI
(% of AGI for various income ranges: 7.8% for AGIs below $25k, 11.9% for AGIs $25k-50k, 14.8% for AGIs $50k-75k, 16.1% for AGIs $75k-100k, 16.4% for AGIs $100k-200k, 14.4% for AGIs over 200k)
Charity contributions: $4,070 (reported on 25.8% of returns)
Here:
$4,070
State:
$4,687
(% of AGI for various income ranges: 1.1% for AGIs below $25k, 1.9% for AGIs $25k-50k, 2.4% for AGIs $50k-75k, 2.8% for AGIs $75k-100k, 2.9% for AGIs $100k-200k, 3.8% for AGIs over 200k)
Taxes paid: $6,040 (reported on 32.7% of returns)
28348:
$6,040
State:
$8,823
(% of AGI for various income ranges: 1.5% for AGIs below $25k, 3.0% for AGIs $25k-50k, 4.2% for AGIs $50k-75k, 5.4% for AGIs $75k-100k, 6.6% for AGIs $100k-200k, 7.3% for AGIs over 200k)
Earned income credit: $2,487 (reported on 28.2% of returns)
Here:
$2,487
State:
$2,376
(% of AGI for various income ranges: 10.0% for AGIs below $25k, 1.8% for AGIs $25k-50k)
Percentage of individuals using paid preparers for their 2012 taxes: 48.2%
Here:
48%
State:
53%
(% for various income ranges: 47.1% for AGIs below $25k, 45.8% for AGIs $25k-50k, 48.2% for AGIs $50k-75k, 52.3% for AGIs $75k-100k, 54.9% for AGIs $100k-200k, 75.0% for AGIs over 200k)
Averages for the 2004 tax year for zip code 28348, filed in 2005:
Average Adjusted Gross Income (AGI) in 2004: $37,117 (Individual Income Tax Returns)
Here:
$37,117
State:
$45,376
Salary/wage: $34,917 (reported on 90.7% of returns)
Here:
$34,917
State:
$39,442
(% of AGI for various income ranges: 105.8% for AGIs below $10k, 85.9% for AGIs $10k-25k, 90.1% for AGIs $25k-50k, 89.3% for AGIs $50k-75k, 87.1% for AGIs $75k-100k, 66.1% for AGIs over 100k)
Taxable interest for individuals: $658 (reported on 28.2% of returns)
This zip code:
$658
North Carolina:
$1,515
(% of AGI for various income ranges: 1.2% for AGIs below $10k, 0.6% for AGIs $10k-25k, 0.4% for AGIs $25k-50k, 0.4% for AGIs $50k-75k, 0.4% for AGIs $75k-100k, 0.7% for AGIs over 100k)
Taxable dividends: $965 (reported on 11.3% of returns)
Here:
$965
State:
$4,016
(% of AGI for various income ranges: 0.7% for AGIs below $10k, 0.3% for AGIs $10k-25k, 0.2% for AGIs $25k-50k, 0.2% for AGIs $50k-75k, 0.4% for AGIs $75k-100k, 0.6% for AGIs over 100k)
Net capital gain/loss: +$8,904 (reported on 8.2% of returns)
Here:
+$8,904
State:
+$11,152
(% of AGI for various income ranges: -0.8% for AGIs below $10k, 0.1% for AGIs $10k-25k, 0.0% for AGIs $25k-50k, 0.3% for AGIs $50k-75k, 0.3% for AGIs $75k-100k, 11.1% for AGIs over 100k)
Profit/loss from business: +$8,145 (reported on 12.2% of returns)
Here:
+$8,145
State:
+$9,490
(% of AGI for various income ranges: 4.2% for AGIs below $10k, 4.2% for AGIs $10k-25k, 1.5% for AGIs $25k-50k, 1.5% for AGIs $50k-75k, 1.1% for AGIs $75k-100k, 6.6% for AGIs over 100k)
IRA payment deduction: $2,250 (reported on 2.1% of returns)
28348:
$2,250
North Carolina:
$2,967
(% of AGI for various income ranges: 0.2% for AGIs $10k-25k, 0.1% for AGIs $25k-50k, 0.1% for AGIs $50k-75k, 0.1% for AGIs $75k-100k, 0.1% for AGIs over 100k)
Self-employed pension: $9,895 (reported on 0.2% of returns)
Here:
$9,895
North Carolina:
$14,754
Total itemized deductions: $15,619 (25% of AGI, reported on 35.2% of returns)
Here:
$15,619
State:
$19,464
Here:
24.9% of AGI
State:
22.7% of AGI
(% of AGI for various income ranges: 8.2% for AGIs below $10k, 9.0% for AGIs $10k-25k, 13.8% for AGIs $25k-50k, 16.7% for AGIs $50k-75k, 17.8% for AGIs $75k-100k, 16.0% for AGIs over 100k)
Charity contributions deductions: $3,171 (5% of AGI, reported on 30.5% of returns)
Here:
$3,171
State:
$4,035
Here:
4.9% of AGI
State:
4.5% of AGI
(% of AGI for various income ranges: 0.8% for AGIs below $10k, 1.4% for AGIs $10k-25k, 2.2% for AGIs $25k-50k, 2.8% for AGIs $50k-75k, 3.1% for AGIs $75k-100k, 3.8% for AGIs over 100k)
Total tax: $4,259 (reported on 67.8% of returns)
28348:
$4,259
State:
$7,257
(% of AGI for various income ranges: 2.7% for AGIs below $10k, 3.0% for AGIs $10k-25k, 5.0% for AGIs $25k-50k, 7.5% for AGIs $50k-75k, 9.4% for AGIs $75k-100k, 15.6% for AGIs over 100k)
Earned income credit: $1,951 (reported on 25.9% of returns)
Here:
$1,951
State:
$1,851
Percentage of individuals using paid preparers for their 2004 taxes: 61.2%
Here:
61%
State:
62%
(% for various income ranges: 53.8% for AGIs below $10k, 65.5% for AGIs $10k-25k, 61.7% for AGIs $25k-50k, 61.2% for AGIs $50k-75k, 59.3% for AGIs $75k-100k, 66.1% for AGIs over 100k)
Likely homosexual households (counted as self-reported same-sex unmarried-partner households)
Lesbian couples: 0.3% of all households
Gay men: 0.2% of all households
Household received Food Stamps/SNAP in the past 12 months: 2,730 Household did not receive Food Stamps/SNAP in the past 12 months: 11,078
Women who had a birth in the past 12 months: 589 (391 now married, 197 unmarried) Women who did not have a birth in the past 12 months: 9,525 (4,615 now married, 4,921 unmarried)
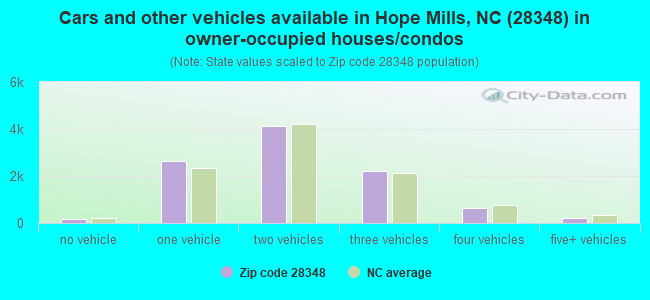
Housing units in zip code 28348 with a mortgage: 7,497 (281 second mortgage, 246 both second mortgage and home equity loan) Houses without a mortgage: 142
Median monthly owner costs for units with a mortgage: $1,375 Median monthly owner costs for units without a mortgage: $437
Residents with income below the poverty level in 2022:
This zip code:
13.6%
Whole state:
12.8%
Residents with income below 50% of the poverty level in 2022:
This zip code:
7.7%
Whole state:
6.8%
Median number of rooms in houses and condos:
Here:
6.4
State:
6.4
Median number of rooms in apartments:
Here:
4.9
State:
4.4
Notable locations in this zip code not listed on our city pages
Churches in zip code 28348 include: First United Church (A), Mars Hill Church (B), Victory Church (C), Deliverence Temple (D), Union Church (E), Marvin Church (F), Big Rockfish Church (G), Spring Hill Church (H), Grays Creek Church (I). Display/hide their locations on the map
Reservoirs and swamps: Rainbow Pond (A), Rainey Pond (B), Perma Stone Lake (C), Verdery Pond (D), Lake Charles (E), Number Two Lake (F), Hope Mills Lake (G), Odom Bay (H). Display/hide their locations on the map
6,231 married couples with children.
3,056 single-parent households (851 men, 2,205 women).
89.6% of residents of 28348 zip code speak English at home.
7.7% of residents speak Spanish at home (72% very well, 22% well, 6% not well).
0.9% of residents speak other Indo-European language at home (96% very well, 3% well, 1% not well).
1.0% of residents speak Asian or Pacific Island language at home (45% very well, 26% well, 29% not well).
0.3% of residents speak other language at home (64% very well, 21% well, 15% not well).
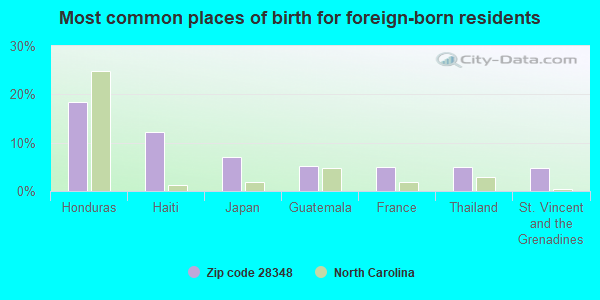
Foreign born population: 1,688 (4.3%) (49.5% of them are naturalized citizens)
This zip code:
4.3%
Whole state:
8.6%
18%Honduras
12%Haiti
7%Japan
5%Guatemala
5%France
5%Thailand
5%St. Vincent and the Grenadines
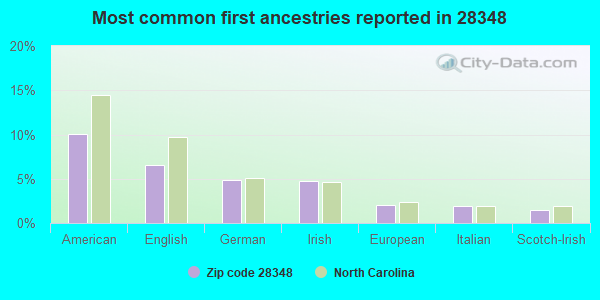
10%American
7%English
5%German
5%Irish
2%European
2%Italian
1%Scotch-Irish
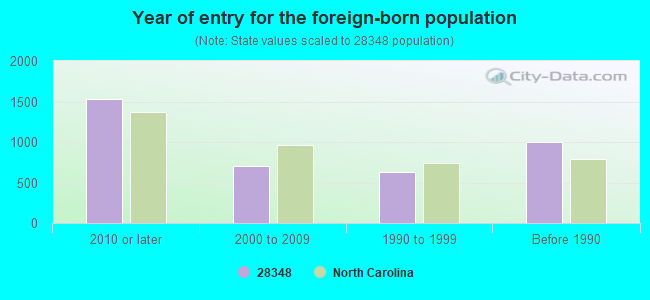
Year of entry for the foreign-born population
1,5342010 or later
7032000 to 2009
6351990 to 1999
1,003Before 1990
Facilities with environmental interests located in this zip code:
AMERICAN FREIGHTWAYS (5452 SHIPMAN ROAD in HOPE MILLS, NC)
STATE MASTER (North Carolina facility info) - -115DA4YG00M29W84AX3YG7KPF1, WASTEWATER FACILITY National Pollutant Discharge Elimination System NON-MAJOR (Tracking pollutant discharge elimination systems) - permit Business SIC classification: TRUCKING, EXCEPT LOCAL Alternative names: AMERICAN FREIGHTWAYS-FAYETTEVI, AMER FREIGHTWAYS FAYETTEVILLE
CNF INCORPORATED (ROUTE 3 BOX 1134 in HOPE MILLS, NC)
STATE MASTER (North Carolina facility info) - -115DA4YG00SAAD84AY3WR9E3C2, WASTEWATER FACILITY National Pollutant Discharge Elimination System NON-MAJOR (Tracking pollutant discharge elimination systems) - permit Business SIC classification: TRUCKING, EXCEPT LOCAL Alternative names: CNF INC CON WAY S EXPRESS NFY, CNF TRANSPORTATION, INC., CON WAY FREIGHT NFY
C WAYNE COLLIER ELEMENTARY (3522 STURBRIDGE DR in HOPE MILLS, NC)
(National Center for Education Statistics) - STATE ID-342 Organizations: CUMBERLAND COUNTY SCHOOLS (SCHOOL DISTRICT)
BOWMAN TRANSPORATION CO INC (HWY 59 CHICKENFOOT & SANDHILL in HOPE MILLS, NC)
(Resource Conservation and Recovery Act (tracking hazardous waste)) Organizations: BOWMAN TRANSPORATION, INC. (CONTACT/OWNER)
AAA COOPER TRANSPORTATION-CUMB (RT 1 BOX 169A in HOPE MILLS, NC)
National Pollutant Discharge Elimination System NON-MAJOR (Tracking pollutant discharge elimination systems) - permit Business SIC classification: TERMINAL AND JOINT TERMINAL MAINTENANCE FACILITIES FOR MOTOR FREIGHT TRANSPORTATION Alternative names: AAA COOPER TRANSPORT-CUMBERLAN
AVANTI KNITTING MILL (3469 BLACK & DECKER in HOPE MILLS, NC)
AIR MAJOR (AIRS/AFS) Business SIC classification: KNIT OUTERWEAR MILLS
Housing units lacking complete plumbing facilities: 1.5% Housing units lacking complete kitchen facilities: 1.5%
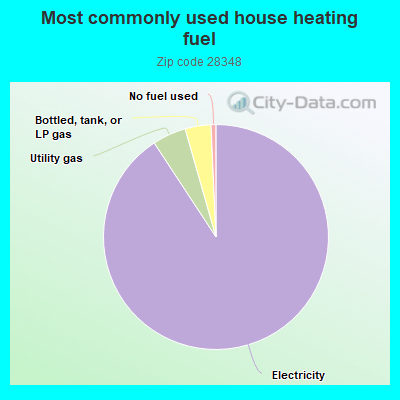
90.4%Electricity
4.8%Utility gas
3.7%Bottled, tank, or LP gas
0.7%No fuel used
Population in 1990: 18,396. Population change in the 1990s: +7,221 (+39.3%).
Place of birth for U.S.-born residents:
This state: 19,848
Northeast: 4,547
Midwest: 2,340
South: 6,803
West: 2,208
51% of the 28348 zip code residents lived in the same house 5 years ago. Out of people who lived in different houses, 58% lived in this county. Out of people who lived in different counties, 50% lived in North Carolina.
91% of the 28348 zip code residents lived in the same house 1 year ago. Out of people who lived in different houses, 48% moved from this county. Out of people who lived in different houses, 25% moved from different county within same state. Out of people who lived in different houses, 25% moved from different state. Out of people who lived in different houses, 2% moved from abroad.
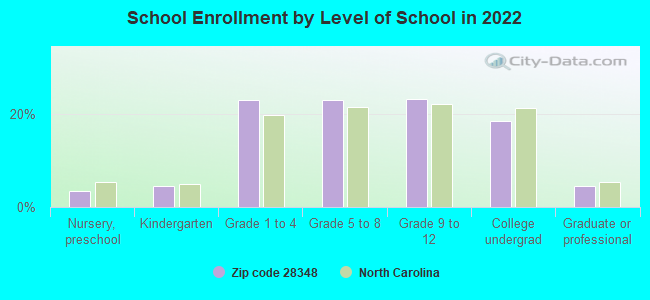
Private vs. public school enrollment:
Students in private schools in grades 1 to 8 (elementary and middle school): 625
Here:
11.7%
North Carolina:
13.8%
Students in private schools in grades 9 to 12 (high school): 309
Here:
11.4%
North Carolina:
11.9%
Students in private undergraduate colleges: 528
Here:
24.6%
North Carolina:
19.3%
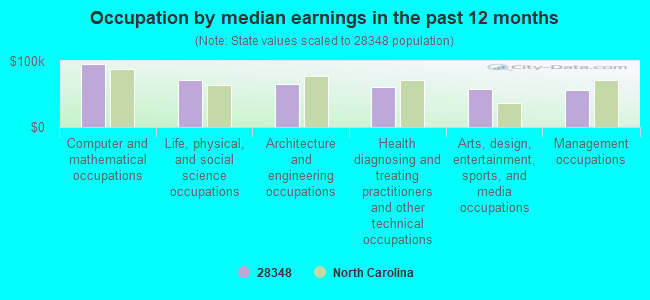
Occupation by median earnings in the past 12 months ($)
95,107Computer and mathematical occupations
71,886Life, physical, and social science occupations
65,507Architecture and engineering occupations
60,066Health diagnosing and treating practitioners and other technical occupations
56,991Arts, design, entertainment, sports, and media occupations
56,641Management occupations
Companies with biggest federal contracts located in this zip code (HOPE MILLS, NC):
RYDER SYSTEM, INC (3455 BLACK & DECKER ROAD) : $553,717 in 17 contractsfrom 2003 to 2006
Contracts for Lease or Rental of Equipment -- Ground Effect Vehicles, Motor Vehicles, Trailers, and Cycles, Lease or Rental of Equipment -- Refrigeration, Air Conditioning, and Air Circulating Equipment by Army Signed by year:2000: $0; 2001: $0; 2002: $0; 2003: $89,688; 2004: $233,628; 2005: $168,570; 2006: $61,831.
Biggest contracts:
$233,628 with Army for Lease or Rental of Equipment -- Ground Effect Vehicles, Motor Vehicles, Trailers, and Cycles. Signed on 2004-08-24. Completion date: 2005-02-28.
$41,494, same as above.Signed on 2005-11-22. Completion date: 2005-12-31.
$41,200, same as above.Signed on 2003-06-03. Completion date: 2003-09-30.
$37,290, same as above.Signed on 2005-05-25. Completion date: 2005-10-31.
MACHINE PRODUCTS OF FAYETTEVIL (3428 BLACK AND DECKER RD; small business) : $380,736 in 4 contractsfrom 2003 to 2005
$368,876 with Army for Miscellaneous Construction Equipment. Signed on 2003-02-07. Completion date: 2005-12-31.
$10,404 with Army for Industrial Assembly Machines. Signed on 2005-04-19. Completion date: 2005-06-21.
$2,340 with Army for Hardware, Commercial. Signed on 2003-03-26. Completion date: 2003-06-10.
-$884 with Army for Miscellaneous Construction Equipment. Signed on 2003-05-19. Completion date: 2005-12-31.
COMMERCIAL FLOOR COVERING OF T (5674 SHIPMAN RD; small business) : $167,807 in 11 contractsfrom 2002 to 2005
Contracts for Floor Coverings, Maintenance, Repair or Alteration of Real Property -- Miscellaneous Buildings, Maintenance, Repair or Alteration of Real Property -- Other Administrative Facilities and Service Buildings, Installation of Equipment -- Household and Commercial Furnishings and Appliances by Department of Defense, Army, Air Force Signed by year:2000: $0; 2001: $0; 2002: $10,849; 2003: $132,469; 2004: $7,066; 2005: $17,423; 2006: $0.
Biggest contracts:
$64,945 with Department of Defense for Floor Coverings. Signed on 2003-09-05. Completion date: 2003-10-24.
$35,079, same as above.Signed on 2003-09-13. Completion date: 2003-10-17.
$16,176 with Army for Maintenance, Repair or Alteration of Real Property -- Miscellaneous Buildings. Signed on 2003-09-09. Completion date: 2003-09-22.
$14,999 with Army for Maintenance, Repair or Alteration of Real Property -- Other Administrative Facilities and Service Buildings. Signed on 2005-03-28. Completion date: 2005-03-25.
JEB DESIGNS, INC (3452 BLACK & DECKER ROAD; small business) : $132,874 in 11 contractsfrom 2002 to 2006
Contracts for Textile Fabrics, Non-Food Items For Resale, Clothing, Special Purpose, Outerwear, Men's, and moreby Army, U.S. Special Operations Command Signed by year:2000: $0; 2001: $0; 2002: $14,520; 2003: $24,615; 2004: $35,719; 2005: $21,344; 2006: $36,676.
Biggest contracts:
$35,719 with Army for Textile Fabrics. Signed on 2004-08-31. Completion date: 2004-10-29.
$34,034 with U.S. Special Operations Command for Non-Food Items For Resale. Signed on 2006-04-04. Completion date: 2006-04-07.
$13,769 with Army for Clothing, Special Purpose. Signed on 2005-09-23. Completion date: 2005-10-31.
$12,500, same as above.Signed on 2002-09-14. Completion date: 2002-10-15.
H G R'S TRUCK & TRAILER SALES (4519 MARRACCO DR; small business) : $101,274 in 14 contractsfrom 2003 to 2006
Contracts for Trailers, Miscellaneous Materials Handling Equipment by U.S. Special Operations Command, Air Force, Army, Department of Defense, and others Signed by year:2000: $0; 2001: $0; 2002: $0; 2003: $23,557; 2004: $17,948; 2005: $15,920; 2006: $43,849.
Biggest contracts:
$20,635 with U.S. Special Operations Command for Trailers. Signed on 2006-05-04. Completion date: 2006-08-02.
$12,724 with Air Force for Trailers. Signed on 2006-03-10. Completion date: 2006-05-15.
$10,020 with Army for Trailers. Signed on 2004-11-22. Completion date: 2005-01-18.
$9,991, same as above.Signed on 2003-07-16. Completion date: 2003-08-29.
CASHWELL & CASHWELL, INC (5674 SHIPMAN ROAD; small business) : $90,453 in 9 contractsfrom 2000 to 2004
Contracts for Floor Coverings, Maintenance, Repair or Alteration of Real Property -- Office Buildings, Maintenance, Repair or Alteration of Real Property -- Other Administrative Facilities and Service Buildings, Maintenance, Repair or Alteration of Real Property -- Miscellaneous Buildings by Air Force, Army Signed by year:2000: $38,912; 2001: $3,500; 2002: $0; 2003: $21,428; 2004: $26,613; 2005: $0; 2006: $0.
Biggest contracts:
$38,912 with Air Force for Floor Coverings. Signed on 2000-05-05. Completion date: 2000-05-26.
$13,421 with Army for Maintenance, Repair or Alteration of Real Property -- Office Buildings. Signed on 2003-09-12. Completion date: 2003-10-14.
$9,374, same as above.Signed on 2004-09-22. Completion date: 2004-10-27.
$7,500 with Army for Maintenance, Repair or Alteration of Real Property -- Other Administrative Facilities and Service Buildings. Signed on 2004-09-08. Completion date: 2004-09-17.
CANADYS SERVICES, INCORPRATED (2731 HOPE MILLS ROAD; small business) : $89,088 in 2 contractsfrom 2000 to 2001
$46,080 with Army for Insect and Rodent Control Services. Signed on 2001-02-14. Completion date: 2002-02-28.
$43,008, same as above.Signed on 2000-02-16. Completion date: 2001-02-28.
C&J LAWN MAINTENANCE (3733 YORKTOWN RD; small business)
$42,000 with Department of Defense for Landscaping/Groundskeeping Services. Signed on 2000-04-05. Completion date: 2001-03-31.
CASHWELL & CASHWELL INC (5674 SHIPMAN RD; small business) : $34,584 in 2 contractsfrom 2004 to 2005
$31,067 with Air Force for Maintenance, Repair or Alteration of Real Property -- Office Buildings. Signed on 2004-09-17. Completion date: 2004-11-02.
$3,517 with Army for Floor Coverings. Signed on 2005-08-31. Completion date: 2005-09-29.
KUSTOM MOBILE INSTALLATIONS IN (338 WOODINGTON ROAD; small business) : $31,640 in 5 contractsin 2005
Contracts for Maintenance, Repair and Rebuilding of Equipment -- Ground Effect Vehicles, Motor Vehicles, Trailers, and Cycles, Maintenance, Repair and Rebuilding of Equipment -- Vehicular Equipment Components by Army Signed by year:2000: $0; 2001: $0; 2002: $0; 2003: $0; 2004: $0; 2005: $31,640; 2006: $0.
Biggest contracts:
$25,455 with Army for Maintenance, Repair and Rebuilding of Equipment -- Ground Effect Vehicles, Motor Vehicles, Trailers, and Cycles. Signed on 2005-09-28. Completion date: 2006-07-31.
$5,850 with Army for Maintenance, Repair and Rebuilding of Equipment -- Vehicular Equipment Components. Signed on 2005-11-30. Completion date: 2005-12-16.
$175 with Army for Maintenance, Repair and Rebuilding of Equipment -- Ground Effect Vehicles, Motor Vehicles, Trailers, and Cycles. Signed on 2005-11-29. Completion date: 2006-07-31.
$160, same as above.Signed on 2005-12-15. Completion date: 2006-07-31.
Top industries in this zip code by the number of employees in 2005:
2002 - 2018 National Fire Incident Reporting System (NFIRS) incidents
Based on the data from the years 2002 - 2018 the average number of fire incidents per year is 325. The highest number of reported fires - 593 took place in 2004, and the least - 57 in 2005. The data has a rising trend.
When looking into fire subcategories, the most reports belonged to: Structure Fires (54.8%), and Outside Fires (34.1%).
Fire incident types reported to NFIRS in Zip Code 28348
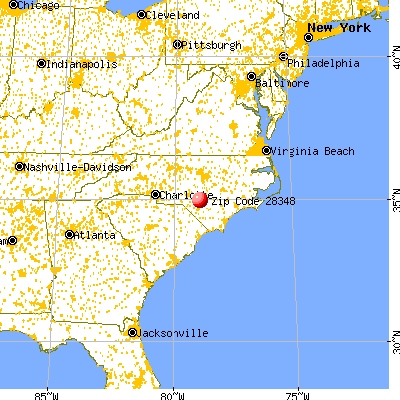


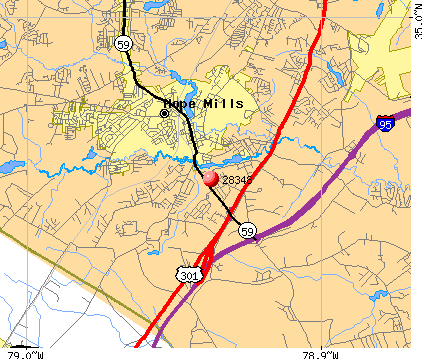 Nearest zip codes: 28306, 28371, 28384, 28304, 28305, 28357.


 Based on the data from the years 2002 - 2018 the average number of fire incidents per year is 325. The highest number of reported fires - 593 took place in 2004, and the least - 57 in 2005. The data has a rising trend.
 When looking into fire subcategories, the most reports belonged to: Structure Fires (54.8%), and Outside Fires (34.1%).