Estimated zip code population in 2022: 11,752 Zip code population in 2010: 7,893 Zip code population in 2000: 8,055
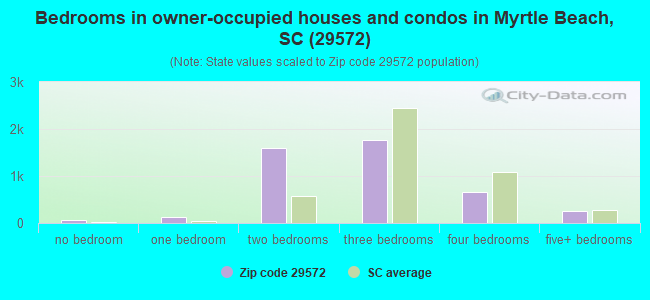
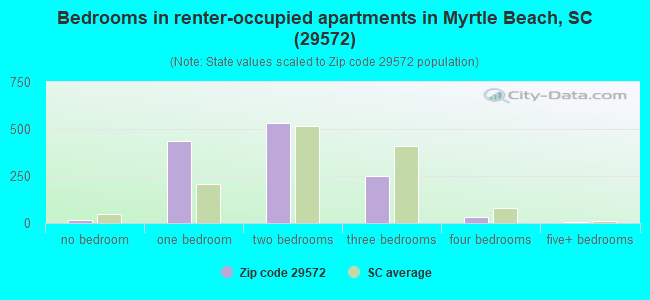
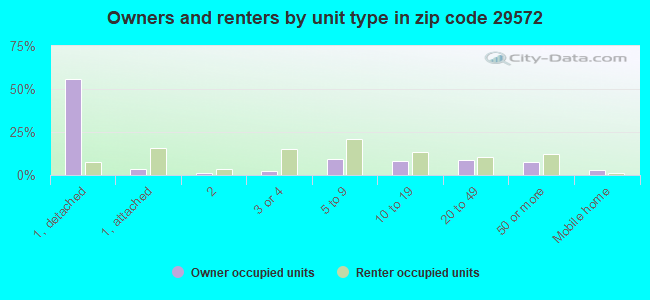
Houses and condos: 15,335 Renter-occupied apartments: 1,249
% of renters here:
22%
State:
28%
March 2022 cost of living index in zip code 29572: 91.1 (less than average, U.S. average is 100)
Land area: 8.2 sq. mi. Water area: 0.3 sq. mi.
Population density: 1,435 people per square mile
(low).
OSM Map
General Map
Google Map
MSN Map
OSM Map
General Map
Google Map
MSN Map
OSM Map
General Map
Google Map
MSN Map
OSM Map
General Map
Google Map
MSN Map
Please wait while loading the map...
Real estate property taxes paid for housing units in 2022:
This zip code:
0.3% ($1,258)
South Carolina:
0.5% ($1,185)
Median real estate property taxes paid for housing units with mortgages in 2022: $1,443 (0.3%) Median real estate property taxes paid for housing units with no mortgage in 2022: $1,114 (0.4%)
Averages for the 2020 tax year for zip code 29572, filed in 2021:
Average Adjusted Gross Income (AGI) in 2020: $114,155 (Individual Income Tax Returns)
Here:
$114,155
State:
$65,754
Salary/wage: $66,726 (reported on 66.0% of returns)
Here:
$66,726
State:
$52,566
(% of AGI for various income ranges: 1064.4% for AGIs below $25k, 3144.4% for AGIs $25k-50k, 5276.0% for AGIs $50k-75k, 6888.8% for AGIs $75k-100k, 13055.8% for AGIs $100k-200k, 95060.6% for AGIs over 200k)
Taxable interest for individuals: $3,674 (reported on 42.7% of returns)
This zip code:
$3,674
South Carolina:
$1,749
(% of AGI for various income ranges: 42.3% for AGIs below $25k, 44.2% for AGIs $25k-50k, 151.2% for AGIs $50k-75k, 322.3% for AGIs $75k-100k, 459.0% for AGIs $100k-200k, 3741.2% for AGIs over 200k)
Ordinary dividends: $12,916 (reported on 35.4% of returns)
Here:
$12,916
State:
$8,783
(% of AGI for various income ranges: 63.5% for AGIs below $25k, 150.5% for AGIs $25k-50k, 453.3% for AGIs $50k-75k, 911.5% for AGIs $75k-100k, 1722.2% for AGIs $100k-200k, 10366.9% for AGIs over 200k)
Net capital gain/loss in AGI: +$82,568 (reported on 32.8% of returns)
Here:
+$82,568
State:
+$24,194
(% of AGI for various income ranges: 19.5% for AGIs below $25k, 102.2% for AGIs $25k-50k, 425.0% for AGIs $50k-75k, 617.3% for AGIs $75k-100k, 2177.2% for AGIs $100k-200k, 103121.9% for AGIs over 200k)
Profit/loss from business: +$21,854 (reported on 17.3% of returns)
Here:
+$21,854
State:
+$11,253
(% of AGI for various income ranges: 135.8% for AGIs below $25k, 211.5% for AGIs $25k-50k, 293.8% for AGIs $50k-75k, 730.0% for AGIs $75k-100k, 980.7% for AGIs $100k-200k, 8683.8% for AGIs over 200k)
Taxable individual retirement arrangement distribution: $30,627 (reported on 19.5% of returns)
29572:
$30,627
South Carolina:
$21,604
(% of AGI for various income ranges: 121.5% for AGIs below $25k, 320.2% for AGIs $25k-50k, 819.5% for AGIs $50k-75k, 1661.9% for AGIs $75k-100k, 2715.5% for AGIs $100k-200k, 9865.6% for AGIs over 200k)
Self-employed (Keogh) retirement plans: $28,350 (reported on 0.9% of returns)
29572:
$28,350
South Carolina:
$25,038
(% of AGI for various income ranges: 22.3% for AGIs below $25k, 862.5% for AGIs over 200k)
Total itemized deductions: $48,349 (reported on 13.7% of returns)
Here:
$48,349
State:
$35,199
(% of AGI for various income ranges: 45.2% for AGIs below $25k, 171.6% for AGIs $25k-50k, 513.6% for AGIs $50k-75k, 919.6% for AGIs $75k-100k, 1967.0% for AGIs $100k-200k, 18010.6% for AGIs over 200k)
Charity contributions: $24,560 (reported on 11.7% of returns)
Here:
$24,560
State:
$14,319
(% of AGI for various income ranges: 5.0% for AGIs below $25k, 21.8% for AGIs $25k-50k, 95.0% for AGIs $50k-75k, 168.5% for AGIs $75k-100k, 520.2% for AGIs $100k-200k, 9821.2% for AGIs over 200k)
Taxes paid: $8,128 (reported on 13.7% of returns)
29572:
$8,128
State:
$7,486
(% of AGI for various income ranges: 6.9% for AGIs below $25k, 33.3% for AGIs $25k-50k, 95.0% for AGIs $50k-75k, 213.8% for AGIs $75k-100k, 502.5% for AGIs $100k-200k, 2458.8% for AGIs over 200k)
Earned income credit: $1,556 (reported on 10.9% of returns)
Here:
$1,556
State:
$2,397
(% of AGI for various income ranges: 55.4% for AGIs below $25k, 33.9% for AGIs $25k-50k)
Percentage of individuals using paid preparers for their 2020 taxes: 92.6%
Here:
93%
State:
93%
(% for various income ranges: 90.9% for AGIs below $25k, 92.2% for AGIs $25k-50k, 93.4% for AGIs $50k-75k, 94.4% for AGIs $75k-100k, 93.6% for AGIs $100k-200k, 94.6% for AGIs over 200k)
Averages for the 2012 tax year for zip code 29572, filed in 2013:
Average Adjusted Gross Income (AGI) in 2012: $79,963 (Individual Income Tax Returns)
Here:
$79,963
State:
$51,133
Salary/wage: $54,217 (reported on 73.1% of returns)
Here:
$54,217
State:
$42,173
(% of AGI for various income ranges: 73.2% for AGIs below $25k, 65.2% for AGIs $25k-50k, 44.5% for AGIs $50k-75k, 39.2% for AGIs $75k-100k, 48.2% for AGIs $100k-200k, 46.0% for AGIs over 200k)
Taxable interest for individuals: $3,353 (reported on 41.8% of returns)
This zip code:
$3,353
South Carolina:
$1,468
(% of AGI for various income ranges: 2.6% for AGIs below $25k, 1.4% for AGIs $25k-50k, 1.9% for AGIs $50k-75k, 1.5% for AGIs $75k-100k, 2.1% for AGIs $100k-200k, 1.6% for AGIs over 200k)
Ordinary dividends: $9,872 (reported on 30.6% of returns)
Here:
$9,872
State:
$6,511
(% of AGI for various income ranges: 2.6% for AGIs below $25k, 3.1% for AGIs $25k-50k, 4.6% for AGIs $50k-75k, 6.0% for AGIs $75k-100k, 5.0% for AGIs $100k-200k, 3.3% for AGIs over 200k)
Net capital gain/loss in AGI: +$22,448 (reported on 28.2% of returns)
Here:
+$22,448
State:
+$13,061
(% of AGI for various income ranges: 0.5% for AGIs $25k-50k, 1.9% for AGIs $50k-75k, 2.0% for AGIs $75k-100k, 3.9% for AGIs $100k-200k, 13.4% for AGIs over 200k)
Profit/loss from business: +$15,678 (reported on 17.6% of returns)
Here:
+$15,678
State:
+$10,167
(% of AGI for various income ranges: 8.7% for AGIs below $25k, 4.1% for AGIs $25k-50k, 4.8% for AGIs $50k-75k, 2.2% for AGIs $75k-100k, 2.2% for AGIs $100k-200k, 3.0% for AGIs over 200k)
Taxable individual retirement arrangement distribution: $26,262 (reported on 16.1% of returns)
29572:
$26,262
South Carolina:
$17,019
(% of AGI for various income ranges: 3.8% for AGIs below $25k, 3.8% for AGIs $25k-50k, 7.9% for AGIs $50k-75k, 8.4% for AGIs $75k-100k, 6.4% for AGIs $100k-200k, 4.6% for AGIs over 200k)
Self-employment retirement plans: $19,850 (reported on 0.8% of returns)
29572:
$19,850
South Carolina:
$21,023
Total itemized deductions: $33,437 (19% of AGI, reported on 34.4% of returns)
Here:
$33,437
State:
$22,890
Here:
18.6% of AGI
State:
21.4% of AGI
(% of AGI for various income ranges: 12.3% for AGIs below $25k, 12.7% for AGIs $25k-50k, 17.5% for AGIs $50k-75k, 15.0% for AGIs $75k-100k, 17.9% for AGIs $100k-200k, 13.3% for AGIs over 200k)
Charity contributions: $5,776 (reported on 29.4% of returns)
Here:
$5,776
State:
$5,169
(% of AGI for various income ranges: 0.9% for AGIs below $25k, 1.6% for AGIs $25k-50k, 2.2% for AGIs $50k-75k, 2.1% for AGIs $75k-100k, 2.9% for AGIs $100k-200k, 2.2% for AGIs over 200k)
Taxes paid: $12,545 (reported on 34.4% of returns)
29572:
$12,545
State:
$7,644
(% of AGI for various income ranges: 2.0% for AGIs below $25k, 2.6% for AGIs $25k-50k, 3.8% for AGIs $50k-75k, 4.0% for AGIs $75k-100k, 6.1% for AGIs $100k-200k, 6.6% for AGIs over 200k)
Earned income credit: $1,764 (reported on 14.5% of returns)
Here:
$1,764
State:
$2,418
(% of AGI for various income ranges: 4.0% for AGIs below $25k, 0.4% for AGIs $25k-50k)
Percentage of individuals using paid preparers for their 2012 taxes: 60.9%
Here:
61%
State:
57%
(% for various income ranges: 52.6% for AGIs below $25k, 56.7% for AGIs $25k-50k, 68.6% for AGIs $50k-75k, 67.7% for AGIs $75k-100k, 74.5% for AGIs $100k-200k, 88.6% for AGIs over 200k)
Averages for the 2004 tax year for zip code 29572, filed in 2005:
Average Adjusted Gross Income (AGI) in 2004: $65,228 (Individual Income Tax Returns)
Here:
$65,228
State:
$41,965
Salary/wage: $41,449 (reported on 74.5% of returns)
Here:
$41,449
State:
$35,695
(% of AGI for various income ranges: 165.8% for AGIs below $10k, 73.1% for AGIs $10k-25k, 66.9% for AGIs $25k-50k, 49.7% for AGIs $50k-75k, 43.6% for AGIs $75k-100k, 39.0% for AGIs over 100k)
Taxable interest for individuals: $3,530 (reported on 50.3% of returns)
This zip code:
$3,530
South Carolina:
$1,623
(% of AGI for various income ranges: 11.6% for AGIs below $10k, 3.1% for AGIs $10k-25k, 2.6% for AGIs $25k-50k, 2.8% for AGIs $50k-75k, 3.6% for AGIs $75k-100k, 2.5% for AGIs over 100k)
Taxable dividends: $6,363 (reported on 36.3% of returns)
Here:
$6,363
State:
$3,999
(% of AGI for various income ranges: 15.0% for AGIs below $10k, 3.0% for AGIs $10k-25k, 3.4% for AGIs $25k-50k, 4.0% for AGIs $50k-75k, 5.2% for AGIs $75k-100k, 3.2% for AGIs over 100k)
Net capital gain/loss: +$20,418 (reported on 32.7% of returns)
Here:
+$20,418
State:
+$13,100
(% of AGI for various income ranges: 26.0% for AGIs below $10k, -0.8% for AGIs $10k-25k, 1.7% for AGIs $25k-50k, 3.5% for AGIs $50k-75k, 7.1% for AGIs $75k-100k, 14.4% for AGIs over 100k)
Profit/loss from business: +$23,095 (reported on 15.5% of returns)
Here:
+$23,095
State:
+$9,144
(% of AGI for various income ranges: 3.2% for AGIs below $10k, 4.2% for AGIs $10k-25k, 3.8% for AGIs $25k-50k, 4.2% for AGIs $50k-75k, 5.0% for AGIs $75k-100k, 6.3% for AGIs over 100k)
IRA payment deduction: $3,714 (reported on 2.8% of returns)
29572:
$3,714
South Carolina:
$2,972
(% of AGI for various income ranges: 0.3% for AGIs $10k-25k, 0.4% for AGIs $25k-50k, 0.3% for AGIs $50k-75k, 0.3% for AGIs $75k-100k, 0.1% for AGIs over 100k)
Self-employed pension: $19,371 (reported on 1.5% of returns)
Here:
$19,371
South Carolina:
$15,117
Total itemized deductions: $26,510 (20% of AGI, reported on 37.8% of returns)
Here:
$26,510
State:
$19,039
Here:
19.8% of AGI
State:
22.8% of AGI
(% of AGI for various income ranges: 37.0% for AGIs below $10k, 13.1% for AGIs $10k-25k, 16.3% for AGIs $25k-50k, 16.1% for AGIs $50k-75k, 17.6% for AGIs $75k-100k, 14.7% for AGIs over 100k)
Charity contributions deductions: $6,000 (4% of AGI, reported on 33.4% of returns)
Here:
$6,000
State:
$4,305
Here:
4.1% of AGI
State:
5.0% of AGI
(% of AGI for various income ranges: 2.0% for AGIs below $10k, 1.4% for AGIs $10k-25k, 1.9% for AGIs $25k-50k, 2.1% for AGIs $50k-75k, 3.3% for AGIs $75k-100k, 3.6% for AGIs over 100k)
Total tax: $14,192 (reported on 76.6% of returns)
29572:
$14,192
State:
$6,497
(% of AGI for various income ranges: 4.8% for AGIs below $10k, 4.5% for AGIs $10k-25k, 7.7% for AGIs $25k-50k, 10.4% for AGIs $50k-75k, 11.3% for AGIs $75k-100k, 21.6% for AGIs over 100k)
Earned income credit: $1,238 (reported on 9.5% of returns)
Here:
$1,238
State:
$1,882
Percentage of individuals using paid preparers for their 2004 taxes: 65.0%
Here:
65%
State:
66%
(% for various income ranges: 54.6% for AGIs below $10k, 59.4% for AGIs $10k-25k, 64.6% for AGIs $25k-50k, 70.1% for AGIs $50k-75k, 72.7% for AGIs $75k-100k, 86.1% for AGIs over 100k)
Likely homosexual households (counted as self-reported same-sex unmarried-partner households)
Lesbian couples: 0.1% of all households
Gay men: 0.2% of all households
Household received Food Stamps/SNAP in the past 12 months: 164 Household did not receive Food Stamps/SNAP in the past 12 months: 5,552
Women who had a birth in the past 12 months: 27 (29 now married, 0 unmarried) Women who did not have a birth in the past 12 months: 1,323 (510 now married, 811 unmarried)
Housing units in zip code 29572 with a mortgage: 2,026 (169 second mortgage, 140 both second mortgage and home equity loan) Houses without a mortgage: 124
Median monthly owner costs for units with a mortgage: $1,664 Median monthly owner costs for units without a mortgage: $578
Residents with income below the poverty level in 2022:
This zip code:
11.7%
Whole state:
14.0%
Residents with income below 50% of the poverty level in 2022:
This zip code:
7.3%
Whole state:
7.3%
Median number of rooms in houses and condos:
Here:
5.7
State:
6.4
Median number of rooms in apartments:
Here:
4.0
State:
4.5
Notable locations in this zip code not listed on our city pages
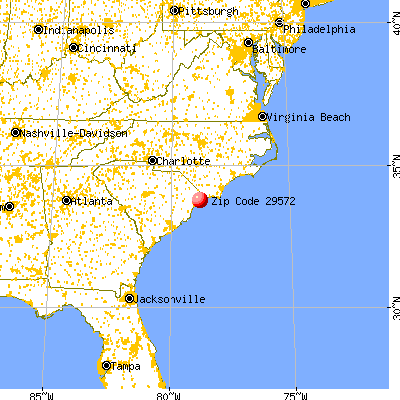
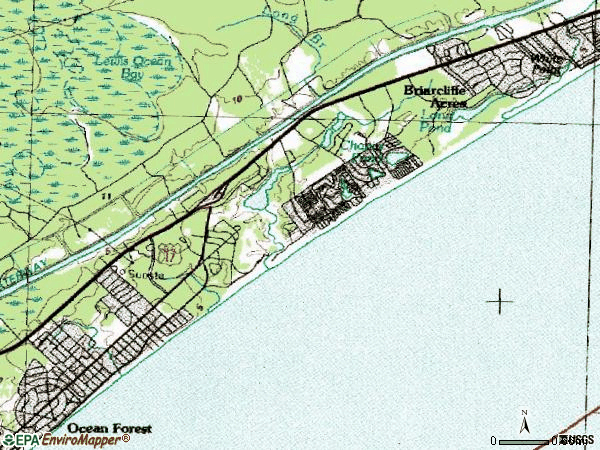
Notable locations in zip code 29572: Apache Campground (A), Arcadian Shores Golf Links (B), Dunes Golf Course (C), Lake Arrowhead Campground (D), Myrtle Beach Campground (E), Myrtle Beach Tennis Club (F), Sherwood Forest Campground (G), Lockwood Golf Links (H), Myrtle Beach Manor (I), City of Myrtle Beach Fire Department Station 5 (J), Horry County Fire Department Lake Arrowhead (K), Lake Arrowhead Fire Department (L), Federal Bureau of Investigation (M). Display/hide their locations on the map
Shopping Centers: Briarcliffe Mall Shopping Center (1), Dunes Shopping Center (2), Magnolia Plaza Shopping Center (3), Seventieth Avenue North Shopping Center (4). Display/hide their locations on the map
Churches in zip code 29572 include: Temple Emanuel (A), Saint Philips Lutheran Church (B), Ocean View Church (C), First Free Will Baptist Church (D), First Church of Christ Scientist (E), Faith Church (F). Display/hide their locations on the map
Lakes and reservoirs: Alligator Pond (A), Lake Arrowhead (B), Long Pond (C), House Pond (D), Chapin Pond (E), Sand Hill Pond (F), Dunes Lake (G). Display/hide their locations on the map
Tourist attractions (not listed on the city page) : Lazer Tag Lazer FX (Amusement & Theme Parks; 964 Lake Arrowhead Road) (1), Show Tickets (8901A Bus 17 North) (2), Great American Riverboat Company (Arcades & Amusements; 8496 Enterprise Road) (3). Display/hide their approximate locations on the map
829 married couples with children.
252 single-parent households (77 men, 175 women).
91.4% of residents of 29572 zip code speak English at home.
6.2% of residents speak Spanish at home (76% very well, 14% well, 7% not well, 3% not at all).
2.0% of residents speak other Indo-European language at home (59% very well, 41% well).
0.2% of residents speak Asian or Pacific Island language at home (65% very well, 35% well).
1.1% of residents speak other language at home (98% very well, 2% well).
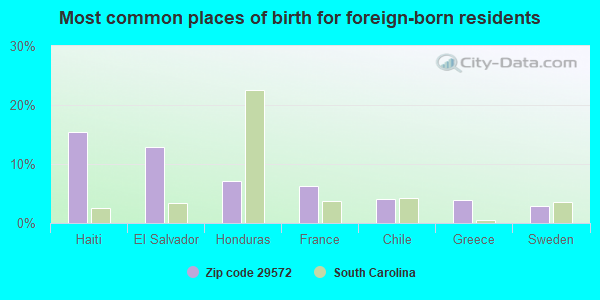
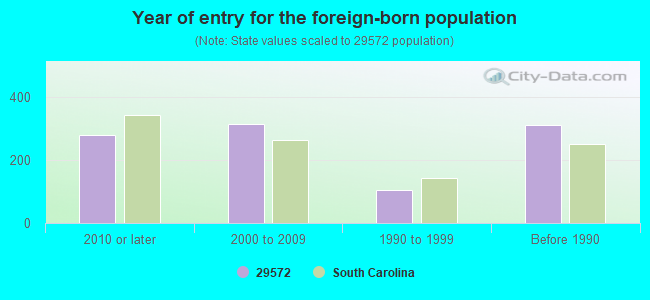
Foreign born population: 862 (7.3%) (57.5% of them are naturalized citizens)
Facilities with environmental interests located in this zip code:
ASHFORD SUBDIVISION (OF US HWY 501 & PERRY RD in MYRTLE BEACH, SC)
(Integrated Compliance Information System) - ICIS-04-2001-0151, FORMAL ENFORCEMENT ACTION
ASHFORD LAKES (OFF OF HIGHWAY 501 in MYRTLE BEACH, SC)
ENFORCEMENT/COMPLIANCE ACTIVITY (Integrated Compliance Information System)
Housing units lacking complete kitchen facilities: 3.1%
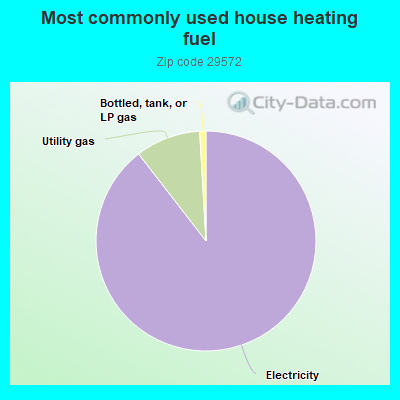
88.9%Electricity
9.5%Utility gas
0.9%Bottled, tank, or LP gas
Population in 1990: 7,039. Population change in the 1990s: +1,016 (+14.4%).
Place of birth for U.S.-born residents:
This state: 2,131
Northeast: 2,950
Midwest: 1,693
South: 3,859
West: 355
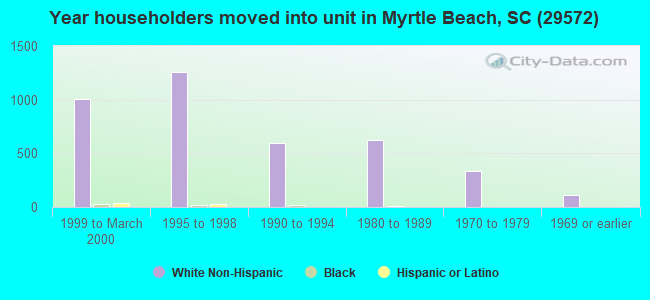
48% of the 29572 zip code residents lived in the same house 5 years ago. Out of people who lived in different houses, 39% lived in this county. Out of people who lived in different counties, 50% lived in South Carolina.
87% of the 29572 zip code residents lived in the same house 1 year ago. Out of people who lived in different houses, 36% moved from this county. Out of people who lived in different houses, 4% moved from different county within same state. Out of people who lived in different houses, 64% moved from different state. Out of people who lived in different houses, 0% moved from abroad.
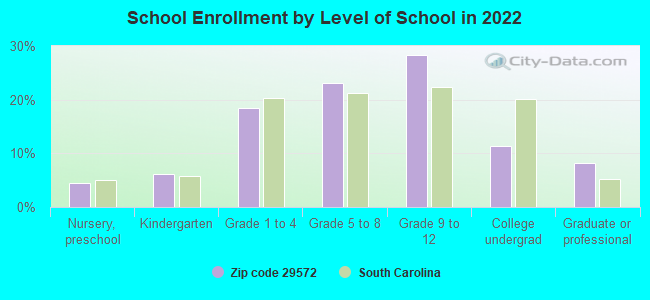
Private vs. public school enrollment:
Students in private schools in grades 1 to 8 (elementary and middle school): 119
Here:
20.4%
South Carolina:
14.4%
Students in private schools in grades 9 to 12 (high school): 39
Here:
10.1%
South Carolina:
11.1%
Students in private undergraduate colleges:
Here:
0.0%
South Carolina:
21.9%
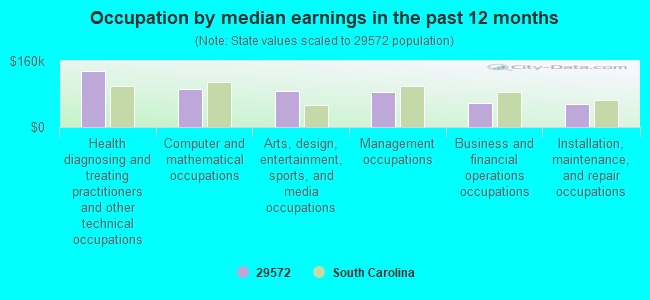
Occupation by median earnings in the past 12 months ($)
136,356Health diagnosing and treating practitioners and other technical occupations
91,294Computer and mathematical occupations
87,812Arts, design, entertainment, sports, and media occupations
84,534Management occupations
58,635Business and financial operations occupations
54,604Installation, maintenance, and repair occupations
Companies with federal contracts located in this zip code:
Chicora Beach Holiday, Inc (603 Briarwood Drive in Myrtle Beach, SC; small business)
$16,968 with Office of Inspector General for Miscellaneous Items. Signed on 2004-05-05. Completion date: 2004-05-10.
FELCOR LODGING TRUST, INC (10000 BEACH CLUB DRIVE in MYRTLE BEACH, SC) : $16,510 in 3 contractsfrom 2004 to 2005
$10,935 with Army for Lodging - Hotel/Motel. Signed on 2004-09-21. Completion date: 2004-09-26.
$5,224, same as above.Signed on 2005-01-26. Completion date: 2005-01-30.
$351, same as above.Signed on 2004-09-29. Completion date: 2004-09-26.
GRANDE SHORES MANAGEMENT COMPA (201 77TH AVE N in MYRTLE BEACH, SC; small business) : $13,601 in 4 contractsfrom 2005 to 2006
$11,365 with Army for Lodging - Hotel/Motel. Signed on 2005-11-03. Completion date: 2005-11-10.
$2,867, same as above.Signed on 2006-05-31. Effective on 2006-06-01. Completion date: 2006-06-03.
-$28, same as above.Signed on 2006-06-05. Completion date: 2006-06-03.
-$603, same as above.Signed on 2005-11-16. Completion date: 2005-11-10.
DOW, LISA (410 77TH AVE N in MYRTLE BEACH, SC; small business)
$10,350 with Air Force for Office Supplies. Signed on 2003-09-30. Completion date: 2003-10-29.
ISLAND RESORT COMPANY LLC (9550 SHORE DR in MYRTLE BEACH, SC)
$8,112 with Army for Lodging - Hotel/Motel. Signed on 2005-06-02. Completion date: 2005-07-10.
SEASIDE PROPERTIES (201 77TH AVE N in MYRTLE BEACH, SC; small business) : $3,227 in 4 contractsfrom 2005 to 2006
$3,617 with U.S. Army Corps of Engineers - civil program financing only for Lease or Rental of Facilities -- Conference Space and Facilities. Signed on 2005-09-05. Completion date: 2005-09-09.
$3,617 with Army for Lease or Rental of Facilities -- Conference Space and Facilities. Signed on 2005-09-05. Completion date: 2005-09-09.
-$300, same as above.Signed on 2005-12-13. Completion date: 2005-11-03.
-$3,707, same as above.Signed on 2006-05-18. Completion date: 2005-09-09.
Top industries in this zip code by the number of employees in 2005:
Other Services (except Public Administration): Other Similar Organizations (except Business, Professional, Labor, and Political Organizations) (100-249: 1, 20-49: 3, 10-19: 2, 5-9: 1, 1-4: 4)
People in group quarters in 2010:
68 people in nursing facilities/skilled-nursing facilities
People in group quarters in 2000:
139 people in nursing homes
37 people in other noninstitutional group quarters
Fatal accident statistics in 2014:
Fatal accident count: 3
Vehicles involved in fatal accidents: 4
Fatal accidents caused by drunken drivers: 0
Fatalities: 3
Persons involved in fatal accidents: 8
Pedestrians involved in fatal accidents: 1
Fatal accident statistics in 2013:
Fatal accident count: 3
Vehicles involved in fatal accidents: 3
Fatal accidents caused by drunken drivers: 1
Fatalities: 3
Persons involved in fatal accidents: 4
Pedestrians involved in fatal accidents: 2
Home Mortgage Disclosure Act Aggregated Statistics For Year 2009 (Based on 2 full and 6 partial tracts)
A) FHA, FSA/RHS & VA Home Purchase Loans
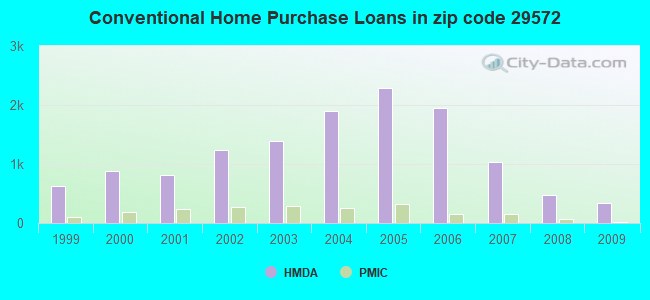
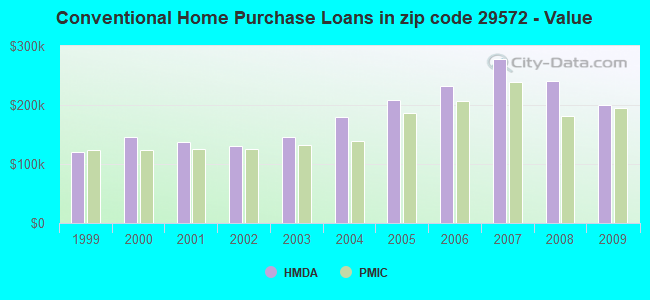
B) Conventional Home Purchase Loans
C) Refinancings
D) Home Improvement Loans
E) Loans on Dwellings For 5+ Families
F) Non-occupant Loans on < 5 Family Dwellings (A B C & D)
G) Loans On Manufactured Home Dwelling (A B C & D)
Number
Average Value
Number
Average Value
Number
Average Value
Number
Average Value
Number
Average Value
Number
Average Value
Number
Average Value
LOANS ORIGINATED
18
$134,022
346
$199,536
588
$255,767
17
$243,674
3
$513,513
578
$220,440
15
$49,177
APPLICATIONS APPROVED, NOT ACCEPTED
1
$82,530
29
$254,194
55
$232,553
2
$14,565
0
$0
56
$236,204
2
$72,910
APPLICATIONS DENIED
11
$147,445
99
$264,997
390
$233,717
18
$154,435
1
$611,360
357
$228,797
14
$71,114
APPLICATIONS WITHDRAWN
2
$76,800
72
$232,582
199
$242,922
5
$80,822
0
$0
158
$212,671
0
$0
FILES CLOSED FOR INCOMPLETENESS
1
$115,950
16
$253,580
39
$265,309
2
$127,500
0
$0
36
$199,325
0
$0
Aggregated Statistics For Year 2008 (Based on 2 full and 6 partial tracts)
A) FHA, FSA/RHS & VA Home Purchase Loans
B) Conventional Home Purchase Loans
C) Refinancings
D) Home Improvement Loans
E) Loans on Dwellings For 5+ Families
F) Non-occupant Loans on < 5 Family Dwellings (A B C & D)
G) Loans On Manufactured Home Dwelling (A B C & D)
Number
Average Value
Number
Average Value
Number
Average Value
Number
Average Value
Number
Average Value
Number
Average Value
Number
Average Value
LOANS ORIGINATED
11
$165,627
477
$239,875
439
$280,441
37
$116,625
7
$396,433
628
$252,513
9
$77,920
APPLICATIONS APPROVED, NOT ACCEPTED
0
$0
61
$233,451
72
$255,756
3
$229,987
0
$0
82
$238,465
2
$63,430
APPLICATIONS DENIED
7
$168,233
193
$284,363
292
$285,333
15
$128,732
1
$162,000
324
$266,208
3
$106,683
APPLICATIONS WITHDRAWN
3
$162,837
85
$355,394
110
$271,254
2
$51,755
0
$0
113
$273,750
2
$124,580
FILES CLOSED FOR INCOMPLETENESS
0
$0
20
$395,958
21
$340,441
2
$246,865
0
$0
24
$364,360
0
$0
Aggregated Statistics For Year 2007 (Based on 2 full and 6 partial tracts)
A) FHA, FSA/RHS & VA Home Purchase Loans
B) Conventional Home Purchase Loans
C) Refinancings
D) Home Improvement Loans
E) Loans on Dwellings For 5+ Families
F) Non-occupant Loans on < 5 Family Dwellings (A B C & D)
G) Loans On Manufactured Home Dwelling (A B C & D)
Number
Average Value
Number
Average Value
Number
Average Value
Number
Average Value
Number
Average Value
Number
Average Value
Number
Average Value
LOANS ORIGINATED
1
$98,580
1,035
$277,553
604
$289,454
47
$181,028
2
$319,775
1,184
$260,311
12
$69,878
APPLICATIONS APPROVED, NOT ACCEPTED
1
$61,920
151
$278,786
94
$329,536
4
$346,448
0
$0
155
$290,063
3
$55,590
APPLICATIONS DENIED
0
$0
306
$379,505
346
$384,591
22
$75,245
2
$7,000
378
$349,761
4
$87,980
APPLICATIONS WITHDRAWN
0
$0
108
$385,517
112
$344,501
3
$241,980
0
$0
126
$386,875
1
$21,400
FILES CLOSED FOR INCOMPLETENESS
0
$0
38
$428,639
41
$314,509
3
$701,990
0
$0
30
$364,995
0
$0
Aggregated Statistics For Year 2006 (Based on 2 full and 6 partial tracts)
A) FHA, FSA/RHS & VA Home Purchase Loans
B) Conventional Home Purchase Loans
C) Refinancings
D) Home Improvement Loans
E) Loans on Dwellings For 5+ Families
F) Non-occupant Loans on < 5 Family Dwellings (A B C & D)
G) Loans On Manufactured Home Dwelling (A B C & D)
Number
Average Value
Number
Average Value
Number
Average Value
Number
Average Value
Number
Average Value
Number
Average Value
Number
Average Value
LOANS ORIGINATED
0
$0
1,957
$232,160
617
$324,335
54
$123,525
7
$725,650
1,953
$236,013
14
$64,264
APPLICATIONS APPROVED, NOT ACCEPTED
0
$0
280
$209,147
85
$301,158
4
$152,502
0
$0
271
$208,020
1
$32,150
APPLICATIONS DENIED
1
$48,000
408
$267,587
206
$272,725
21
$94,285
1
$1,000,000
396
$254,333
12
$86,445
APPLICATIONS WITHDRAWN
0
$0
265
$243,714
124
$357,440
1
$136,610
0
$0
249
$254,472
2
$110,790
FILES CLOSED FOR INCOMPLETENESS
1
$225,000
45
$340,927
59
$268,021
1
$61,140
0
$0
53
$280,338
0
$0
Aggregated Statistics For Year 2005 (Based on 2 full and 6 partial tracts)
A) FHA, FSA/RHS & VA Home Purchase Loans
B) Conventional Home Purchase Loans
C) Refinancings
D) Home Improvement Loans
E) Loans on Dwellings For 5+ Families
F) Non-occupant Loans on < 5 Family Dwellings (A B C & D)
G) Loans On Manufactured Home Dwelling (A B C & D)
Number
Average Value
Number
Average Value
Number
Average Value
Number
Average Value
Number
Average Value
Number
Average Value
Number
Average Value
LOANS ORIGINATED
1
$65,720
2,292
$208,999
680
$214,384
30
$108,563
3
$401,967
2,330
$198,533
12
$53,898
APPLICATIONS APPROVED, NOT ACCEPTED
0
$0
215
$205,845
74
$228,716
6
$144,980
0
$0
189
$193,031
3
$64,717
APPLICATIONS DENIED
3
$103,300
341
$228,848
207
$227,865
18
$95,327
0
$0
307
$212,463
17
$68,637
APPLICATIONS WITHDRAWN
1
$106,780
229
$236,949
136
$225,237
8
$179,906
0
$0
235
$197,054
0
$0
FILES CLOSED FOR INCOMPLETENESS
0
$0
42
$267,620
62
$193,500
3
$122,380
0
$0
28
$224,316
0
$0
Aggregated Statistics For Year 2004 (Based on 2 full and 6 partial tracts)
A) FHA, FSA/RHS & VA Home Purchase Loans
B) Conventional Home Purchase Loans
C) Refinancings
D) Home Improvement Loans
E) Loans on Dwellings For 5+ Families
F) Non-occupant Loans on < 5 Family Dwellings (A B C & D)
G) Loans On Manufactured Home Dwelling (A B C & D)
Number
Average Value
Number
Average Value
Number
Average Value
Number
Average Value
Number
Average Value
Number
Average Value
Number
Average Value
LOANS ORIGINATED
5
$133,270
1,902
$179,892
620
$181,608
40
$116,916
14
$1,670,764
1,914
$171,571
25
$40,630
APPLICATIONS APPROVED, NOT ACCEPTED
0
$0
166
$186,317
49
$139,721
2
$55,020
0
$0
153
$168,783
7
$49,179
APPLICATIONS DENIED
2
$99,445
203
$196,787
158
$176,223
13
$104,752
1
$340,000
178
$157,198
12
$44,664
APPLICATIONS WITHDRAWN
1
$128,600
122
$210,287
110
$196,596
5
$130,772
0
$0
104
$192,808
2
$19,520
FILES CLOSED FOR INCOMPLETENESS
1
$123,000
28
$279,318
25
$199,280
3
$25,667
0
$0
25
$228,326
0
$0
Aggregated Statistics For Year 2003 (Based on 2 full and 6 partial tracts)
A) FHA, FSA/RHS & VA Home Purchase Loans
B) Conventional Home Purchase Loans
C) Refinancings
D) Home Improvement Loans
E) Loans on Dwellings For 5+ Families
F) Non-occupant Loans on < 5 Family Dwellings (A B C & D)
Number
Average Value
Number
Average Value
Number
Average Value
Number
Average Value
Number
Average Value
Number
Average Value
LOANS ORIGINATED
11
$110,340
1,383
$145,913
1,963
$153,701
21
$104,072
6
$413,007
2,264
$134,184
APPLICATIONS APPROVED, NOT ACCEPTED
4
$80,102
80
$115,501
135
$151,404
6
$76,988
0
$0
113
$128,149
APPLICATIONS DENIED
4
$70,660
163
$122,218
287
$146,489
8
$29,115
1
$93,000
162
$146,670
APPLICATIONS WITHDRAWN
3
$85,180
125
$154,280
176
$156,326
1
$40,200
0
$0
145
$142,187
FILES CLOSED FOR INCOMPLETENESS
0
$0
25
$163,292
38
$150,965
3
$45,900
0
$0
30
$133,171
Aggregated Statistics For Year 2002 (Based on 2 full and 6 partial tracts)
A) FHA, FSA/RHS & VA Home Purchase Loans
B) Conventional Home Purchase Loans
C) Refinancings
D) Home Improvement Loans
E) Loans on Dwellings For 5+ Families
F) Non-occupant Loans on < 5 Family Dwellings (A B C & D)
Number
Average Value
Number
Average Value
Number
Average Value
Number
Average Value
Number
Average Value
Number
Average Value
LOANS ORIGINATED
12
$87,531
1,234
$130,420
1,267
$163,096
9
$71,780
1
$134,000
1,643
$130,851
APPLICATIONS APPROVED, NOT ACCEPTED
0
$0
72
$116,681
100
$138,980
1
$71,190
0
$0
73
$121,302
APPLICATIONS DENIED
2
$107,145
141
$100,379
189
$140,998
7
$46,753
0
$0
111
$112,553
APPLICATIONS WITHDRAWN
4
$84,978
72
$155,043
151
$145,873
5
$91,842
1
$149,270
86
$137,590
FILES CLOSED FOR INCOMPLETENESS
0
$0
32
$212,600
38
$186,105
0
$0
0
$0
33
$182,476
Aggregated Statistics For Year 2001 (Based on 2 full and 6 partial tracts)
A) FHA, FSA/RHS & VA Home Purchase Loans
B) Conventional Home Purchase Loans
C) Refinancings
D) Home Improvement Loans
E) Loans on Dwellings For 5+ Families
F) Non-occupant Loans on < 5 Family Dwellings (A B C & D)
Number
Average Value
Number
Average Value
Number
Average Value
Number
Average Value
Number
Average Value
Number
Average Value
LOANS ORIGINATED
5
$72,808
822
$137,534
952
$159,563
26
$54,374
4
$981,052
1,030
$136,124
APPLICATIONS APPROVED, NOT ACCEPTED
2
$93,620
58
$140,723
78
$139,642
2
$36,755
0
$0
50
$123,834
APPLICATIONS DENIED
1
$88,000
96
$95,024
175
$141,199
9
$21,139
0
$0
76
$121,014
APPLICATIONS WITHDRAWN
2
$123,685
58
$135,264
118
$125,451
0
$0
0
$0
56
$144,691
FILES CLOSED FOR INCOMPLETENESS
0
$0
15
$157,531
17
$152,684
3
$41,267
0
$0
17
$133,188
Aggregated Statistics For Year 2000 (Based on 2 full and 6 partial tracts)
A) FHA, FSA/RHS & VA Home Purchase Loans
B) Conventional Home Purchase Loans
C) Refinancings
D) Home Improvement Loans
E) Loans on Dwellings For 5+ Families
F) Non-occupant Loans on < 5 Family Dwellings (A B C & D)
Number
Average Value
Number
Average Value
Number
Average Value
Number
Average Value
Number
Average Value
Number
Average Value
LOANS ORIGINATED
9
$75,577
887
$146,562
203
$142,240
13
$31,450
1
$114,630
599
$149,360
APPLICATIONS APPROVED, NOT ACCEPTED
0
$0
55
$114,510
26
$95,226
2
$19,815
0
$0
21
$148,498
APPLICATIONS DENIED
6
$65,777
134
$75,294
112
$121,845
7
$81,869
0
$0
58
$82,664
APPLICATIONS WITHDRAWN
2
$81,110
57
$157,653
48
$72,998
7
$20,264
2
$112,525
36
$134,430
FILES CLOSED FOR INCOMPLETENESS
0
$0
8
$315,736
16
$110,363
0
$0
0
$0
5
$161,256
Aggregated Statistics For Year 1999 (Based on 2 full and 3 partial tracts)
A) FHA, FSA/RHS & VA Home Purchase Loans
B) Conventional Home Purchase Loans
C) Refinancings
D) Home Improvement Loans
E) Loans on Dwellings For 5+ Families
F) Non-occupant Loans on < 5 Family Dwellings (A B C & D)
2002 - 2018 National Fire Incident Reporting System (NFIRS) incidents
According to the data from the years 2002 - 2018 the average number of fire incidents per year is 42. The highest number of fire incidents - 71 took place in 2003, and the least - 4 in 2002. The data has a growing trend.
When looking into fire subcategories, the most reports belonged to: Outside Fires (42.2%), and Structure Fires (40.8%).
Fire incident types reported to NFIRS in Zip Code 29572


 Nearest zip codes: 29579, 29577, 29582, 29568, 29566, 29526.


 According to the data from the years 2002 - 2018 the average number of fire incidents per year is 42. The highest number of fire incidents - 71 took place in 2003, and the least - 4 in 2002. The data has a growing trend.
 When looking into fire subcategories, the most reports belonged to: Outside Fires (42.2%), and Structure Fires (40.8%).