North Myrtle Beach, South Carolina Submit your own pictures of this city and show them to the world
OSM Map
General Map
Google Map
MSN Map
OSM Map
General Map
Google Map
MSN Map
OSM Map
General Map
Google Map
MSN Map
OSM Map
General Map
Google Map
MSN Map
Please wait while loading the map...
Population in 2022: 19,836 (98% urban, 2% rural). Population change since 2000: +80.8%Males: 9,783 Females: 10,053
March 2022 cost of living index in North Myrtle Beach: 91.8 (less than average, U.S. average is 100) Percentage of residents living in poverty in 2022: 7.0%for White Non-Hispanic residents , 11.1% for Hispanic or Latino residents , 4.5% for American Indian residents , 1.5% for two or more races residents )
Profiles of local businesses
Business Search - 14 Million verified businesses
Data:
Median household income ($)
Median household income (% change since 2000)
Household income diversity
Ratio of average income to average house value (%)
Ratio of average income to average rent
Median household income ($) - White
Median household income ($) - Black or African American
Median household income ($) - Asian
Median household income ($) - Hispanic or Latino
Median household income ($) - American Indian and Alaska Native
Median household income ($) - Multirace
Median household income ($) - Other Race
Median household income for houses/condos with a mortgage ($)
Median household income for apartments without a mortgage ($)
Races - White alone (%)
Races - White alone (% change since 2000)
Races - Black alone (%)
Races - Black alone (% change since 2000)
Races - American Indian alone (%)
Races - American Indian alone (% change since 2000)
Races - Asian alone (%)
Races - Asian alone (% change since 2000)
Races - Hispanic (%)
Races - Hispanic (% change since 2000)
Races - Native Hawaiian and Other Pacific Islander alone (%)
Races - Native Hawaiian and Other Pacific Islander alone (% change since 2000)
Races - Two or more races (%)
Races - Two or more races (% change since 2000)
Races - Other race alone (%)
Races - Other race alone (% change since 2000)
Racial diversity
Unemployment (%)
Unemployment (% change since 2000)
Unemployment (%) - White
Unemployment (%) - Black or African American
Unemployment (%) - Asian
Unemployment (%) - Hispanic or Latino
Unemployment (%) - American Indian and Alaska Native
Unemployment (%) - Multirace
Unemployment (%) - Other Race
Population density (people per square mile)
Population - Males (%)
Population - Females (%)
Population - Males (%) - White
Population - Males (%) - Black or African American
Population - Males (%) - Asian
Population - Males (%) - Hispanic or Latino
Population - Males (%) - American Indian and Alaska Native
Population - Males (%) - Multirace
Population - Males (%) - Other Race
Population - Females (%) - White
Population - Females (%) - Black or African American
Population - Females (%) - Asian
Population - Females (%) - Hispanic or Latino
Population - Females (%) - American Indian and Alaska Native
Population - Females (%) - Multirace
Population - Females (%) - Other Race
Coronavirus confirmed cases (Apr 27, 2024)
Deaths caused by coronavirus (Apr 27, 2024)
Coronavirus confirmed cases (per 100k population) (Apr 27, 2024)
Deaths caused by coronavirus (per 100k population) (Apr 27, 2024)
Daily increase in number of cases (Apr 27, 2024)
Weekly increase in number of cases (Apr 27, 2024)
Cases doubled (in days) (Apr 27, 2024)
Hospitalized patients (Apr 18, 2022)
Negative test results (Apr 18, 2022)
Total test results (Apr 18, 2022)
COVID Vaccine doses distributed (per 100k population) (Sep 19, 2023)
COVID Vaccine doses administered (per 100k population) (Sep 19, 2023)
COVID Vaccine doses distributed (Sep 19, 2023)
COVID Vaccine doses administered (Sep 19, 2023)
Likely homosexual households (%)
Likely homosexual households (% change since 2000)
Likely homosexual households - Lesbian couples (%)
Likely homosexual households - Lesbian couples (% change since 2000)
Likely homosexual households - Gay men (%)
Likely homosexual households - Gay men (% change since 2000)
Cost of living index
Median gross rent ($)
Median contract rent ($)
Median monthly housing costs ($)
Median house or condo value ($)
Median house or condo value ($ change since 2000)
Mean house or condo value by units in structure - 1, detached ($)
Mean house or condo value by units in structure - 1, attached ($)
Mean house or condo value by units in structure - 2 ($)
Mean house or condo value by units in structure by units in structure - 3 or 4 ($)
Mean house or condo value by units in structure - 5 or more ($)
Mean house or condo value by units in structure - Boat, RV, van, etc. ($)
Mean house or condo value by units in structure - Mobile home ($)
Median house or condo value ($) - White
Median house or condo value ($) - Black or African American
Median house or condo value ($) - Asian
Median house or condo value ($) - Hispanic or Latino
Median house or condo value ($) - American Indian and Alaska Native
Median house or condo value ($) - Multirace
Median house or condo value ($) - Other Race
Median resident age
Resident age diversity
Median resident age - Males
Median resident age - Females
Median resident age - White
Median resident age - Black or African American
Median resident age - Asian
Median resident age - Hispanic or Latino
Median resident age - American Indian and Alaska Native
Median resident age - Multirace
Median resident age - Other Race
Median resident age - Males - White
Median resident age - Males - Black or African American
Median resident age - Males - Asian
Median resident age - Males - Hispanic or Latino
Median resident age - Males - American Indian and Alaska Native
Median resident age - Males - Multirace
Median resident age - Males - Other Race
Median resident age - Females - White
Median resident age - Females - Black or African American
Median resident age - Females - Asian
Median resident age - Females - Hispanic or Latino
Median resident age - Females - American Indian and Alaska Native
Median resident age - Females - Multirace
Median resident age - Females - Other Race
Commute - mean travel time to work (minutes)
Travel time to work - Less than 5 minutes (%)
Travel time to work - Less than 5 minutes (% change since 2000)
Travel time to work - 5 to 9 minutes (%)
Travel time to work - 5 to 9 minutes (% change since 2000)
Travel time to work - 10 to 19 minutes (%)
Travel time to work - 10 to 19 minutes (% change since 2000)
Travel time to work - 20 to 29 minutes (%)
Travel time to work - 20 to 29 minutes (% change since 2000)
Travel time to work - 30 to 39 minutes (%)
Travel time to work - 30 to 39 minutes (% change since 2000)
Travel time to work - 40 to 59 minutes (%)
Travel time to work - 40 to 59 minutes (% change since 2000)
Travel time to work - 60 to 89 minutes (%)
Travel time to work - 60 to 89 minutes (% change since 2000)
Travel time to work - 90 or more minutes (%)
Travel time to work - 90 or more minutes (% change since 2000)
Marital status - Never married (%)
Marital status - Now married (%)
Marital status - Separated (%)
Marital status - Widowed (%)
Marital status - Divorced (%)
Median family income ($)
Median family income (% change since 2000)
Median non-family income ($)
Median non-family income (% change since 2000)
Median per capita income ($)
Median per capita income (% change since 2000)
Median family income ($) - White
Median family income ($) - Black or African American
Median family income ($) - Asian
Median family income ($) - Hispanic or Latino
Median family income ($) - American Indian and Alaska Native
Median family income ($) - Multirace
Median family income ($) - Other Race
Median year house/condo built
Median year apartment built
Year house built - Built 2005 or later (%)
Year house built - Built 2000 to 2004 (%)
Year house built - Built 1990 to 1999 (%)
Year house built - Built 1980 to 1989 (%)
Year house built - Built 1970 to 1979 (%)
Year house built - Built 1960 to 1969 (%)
Year house built - Built 1950 to 1959 (%)
Year house built - Built 1940 to 1949 (%)
Year house built - Built 1939 or earlier (%)
Average household size
Household density (households per square mile)
Average household size - White
Average household size - Black or African American
Average household size - Asian
Average household size - Hispanic or Latino
Average household size - American Indian and Alaska Native
Average household size - Multirace
Average household size - Other Race
Occupied housing units (%)
Vacant housing units (%)
Owner occupied housing units (%)
Renter occupied housing units (%)
Vacancy status - For rent (%)
Vacancy status - For sale only (%)
Vacancy status - Rented or sold, not occupied (%)
Vacancy status - For seasonal, recreational, or occasional use (%)
Vacancy status - For migrant workers (%)
Vacancy status - Other vacant (%)
Residents with income below the poverty level (%)
Residents with income below 50% of the poverty level (%)
Children below poverty level (%)
Poor families by family type - Married-couple family (%)
Poor families by family type - Male, no wife present (%)
Poor families by family type - Female, no husband present (%)
Poverty status for native-born residents (%)
Poverty status for foreign-born residents (%)
Poverty among high school graduates not in families (%)
Poverty among people who did not graduate high school not in families (%)
Residents with income below the poverty level (%) - White
Residents with income below the poverty level (%) - Black or African American
Residents with income below the poverty level (%) - Asian
Residents with income below the poverty level (%) - Hispanic or Latino
Residents with income below the poverty level (%) - American Indian and Alaska Native
Residents with income below the poverty level (%) - Multirace
Residents with income below the poverty level (%) - Other Race
Air pollution - Air Quality Index (AQI)
Air pollution - CO
Air pollution - NO2
Air pollution - SO2
Air pollution - Ozone
Air pollution - PM10
Air pollution - PM25
Air pollution - Pb
Crime - Murders per 100,000 population
Crime - Rapes per 100,000 population
Crime - Robberies per 100,000 population
Crime - Assaults per 100,000 population
Crime - Burglaries per 100,000 population
Crime - Thefts per 100,000 population
Crime - Auto thefts per 100,000 population
Crime - Arson per 100,000 population
Crime - City-data.com crime index
Crime - Violent crime index
Crime - Property crime index
Crime - Murders per 100,000 population (5 year average)
Crime - Rapes per 100,000 population (5 year average)
Crime - Robberies per 100,000 population (5 year average)
Crime - Assaults per 100,000 population (5 year average)
Crime - Burglaries per 100,000 population (5 year average)
Crime - Thefts per 100,000 population (5 year average)
Crime - Auto thefts per 100,000 population (5 year average)
Crime - Arson per 100,000 population (5 year average)
Crime - City-data.com crime index (5 year average)
Crime - Violent crime index (5 year average)
Crime - Property crime index (5 year average)
1996 Presidential Elections Results (%) - Democratic Party (Clinton)
1996 Presidential Elections Results (%) - Republican Party (Dole)
1996 Presidential Elections Results (%) - Other
2000 Presidential Elections Results (%) - Democratic Party (Gore)
2000 Presidential Elections Results (%) - Republican Party (Bush)
2000 Presidential Elections Results (%) - Other
2004 Presidential Elections Results (%) - Democratic Party (Kerry)
2004 Presidential Elections Results (%) - Republican Party (Bush)
2004 Presidential Elections Results (%) - Other
2008 Presidential Elections Results (%) - Democratic Party (Obama)
2008 Presidential Elections Results (%) - Republican Party (McCain)
2008 Presidential Elections Results (%) - Other
2012 Presidential Elections Results (%) - Democratic Party (Obama)
2012 Presidential Elections Results (%) - Republican Party (Romney)
2012 Presidential Elections Results (%) - Other
2016 Presidential Elections Results (%) - Democratic Party (Clinton)
2016 Presidential Elections Results (%) - Republican Party (Trump)
2016 Presidential Elections Results (%) - Other
2020 Presidential Elections Results (%) - Democratic Party (Biden)
2020 Presidential Elections Results (%) - Republican Party (Trump)
2020 Presidential Elections Results (%) - Other
Ancestries Reported - Arab (%)
Ancestries Reported - Czech (%)
Ancestries Reported - Danish (%)
Ancestries Reported - Dutch (%)
Ancestries Reported - English (%)
Ancestries Reported - French (%)
Ancestries Reported - French Canadian (%)
Ancestries Reported - German (%)
Ancestries Reported - Greek (%)
Ancestries Reported - Hungarian (%)
Ancestries Reported - Irish (%)
Ancestries Reported - Italian (%)
Ancestries Reported - Lithuanian (%)
Ancestries Reported - Norwegian (%)
Ancestries Reported - Polish (%)
Ancestries Reported - Portuguese (%)
Ancestries Reported - Russian (%)
Ancestries Reported - Scotch-Irish (%)
Ancestries Reported - Scottish (%)
Ancestries Reported - Slovak (%)
Ancestries Reported - Subsaharan African (%)
Ancestries Reported - Swedish (%)
Ancestries Reported - Swiss (%)
Ancestries Reported - Ukrainian (%)
Ancestries Reported - United States (%)
Ancestries Reported - Welsh (%)
Ancestries Reported - West Indian (%)
Ancestries Reported - Other (%)
Educational Attainment - No schooling completed (%)
Educational Attainment - Less than high school (%)
Educational Attainment - High school or equivalent (%)
Educational Attainment - Less than 1 year of college (%)
Educational Attainment - 1 or more years of college (%)
Educational Attainment - Associate degree (%)
Educational Attainment - Bachelor's degree (%)
Educational Attainment - Master's degree (%)
Educational Attainment - Professional school degree (%)
Educational Attainment - Doctorate degree (%)
School Enrollment - Nursery, preschool (%)
School Enrollment - Kindergarten (%)
School Enrollment - Grade 1 to 4 (%)
School Enrollment - Grade 5 to 8 (%)
School Enrollment - Grade 9 to 12 (%)
School Enrollment - College undergrad (%)
School Enrollment - Graduate or professional (%)
School Enrollment - Not enrolled in school (%)
School enrollment - Public schools (%)
School enrollment - Private schools (%)
School enrollment - Not enrolled (%)
Median number of rooms in houses and condos
Median number of rooms in apartments
Housing units lacking complete plumbing facilities (%)
Housing units lacking complete kitchen facilities (%)
Density of houses
Urban houses (%)
Rural houses (%)
Households with people 60 years and over (%)
Households with people 65 years and over (%)
Households with people 75 years and over (%)
Households with one or more nonrelatives (%)
Households with no nonrelatives (%)
Population in households (%)
Family households (%)
Nonfamily households (%)
Population in families (%)
Family households with own children (%)
Median number of bedrooms in owner occupied houses
Mean number of bedrooms in owner occupied houses
Median number of bedrooms in renter occupied houses
Mean number of bedrooms in renter occupied houses
Median number of vehichles in owner occupied houses
Mean number of vehichles in owner occupied houses
Median number of vehichles in renter occupied houses
Mean number of vehichles in renter occupied houses
Mortgage status - with mortgage (%)
Mortgage status - with second mortgage (%)
Mortgage status - with home equity loan (%)
Mortgage status - with both second mortgage and home equity loan (%)
Mortgage status - without a mortgage (%)
Average family size
Average family size - White
Average family size - Black or African American
Average family size - Asian
Average family size - Hispanic or Latino
Average family size - American Indian and Alaska Native
Average family size - Multirace
Average family size - Other Race
Geographical mobility - Same house 1 year ago (%)
Geographical mobility - Moved within same county (%)
Geographical mobility - Moved from different county within same state (%)
Geographical mobility - Moved from different state (%)
Geographical mobility - Moved from abroad (%)
Place of birth - Born in state of residence (%)
Place of birth - Born in other state (%)
Place of birth - Native, outside of US (%)
Place of birth - Foreign born (%)
Housing units in structures - 1, detached (%)
Housing units in structures - 1, attached (%)
Housing units in structures - 2 (%)
Housing units in structures - 3 or 4 (%)
Housing units in structures - 5 to 9 (%)
Housing units in structures - 10 to 19 (%)
Housing units in structures - 20 to 49 (%)
Housing units in structures - 50 or more (%)
Housing units in structures - Mobile home (%)
Housing units in structures - Boat, RV, van, etc. (%)
House/condo owner moved in on average (years ago)
Renter moved in on average (years ago)
Year householder moved into unit - Moved in 1999 to March 2000 (%)
Year householder moved into unit - Moved in 1995 to 1998 (%)
Year householder moved into unit - Moved in 1990 to 1994 (%)
Year householder moved into unit - Moved in 1980 to 1989 (%)
Year householder moved into unit - Moved in 1970 to 1979 (%)
Year householder moved into unit - Moved in 1969 or earlier (%)
Means of transportation to work - Drove car alone (%)
Means of transportation to work - Carpooled (%)
Means of transportation to work - Public transportation (%)
Means of transportation to work - Bus or trolley bus (%)
Means of transportation to work - Streetcar or trolley car (%)
Means of transportation to work - Subway or elevated (%)
Means of transportation to work - Railroad (%)
Means of transportation to work - Ferryboat (%)
Means of transportation to work - Taxicab (%)
Means of transportation to work - Motorcycle (%)
Means of transportation to work - Bicycle (%)
Means of transportation to work - Walked (%)
Means of transportation to work - Other means (%)
Working at home (%)
Industry diversity
Most Common Industries - Agriculture, forestry, fishing and hunting, and mining (%)
Most Common Industries - Agriculture, forestry, fishing and hunting (%)
Most Common Industries - Mining, quarrying, and oil and gas extraction (%)
Most Common Industries - Construction (%)
Most Common Industries - Manufacturing (%)
Most Common Industries - Wholesale trade (%)
Most Common Industries - Retail trade (%)
Most Common Industries - Transportation and warehousing, and utilities (%)
Most Common Industries - Transportation and warehousing (%)
Most Common Industries - Utilities (%)
Most Common Industries - Information (%)
Most Common Industries - Finance and insurance, and real estate and rental and leasing (%)
Most Common Industries - Finance and insurance (%)
Most Common Industries - Real estate and rental and leasing (%)
Most Common Industries - Professional, scientific, and management, and administrative and waste management services (%)
Most Common Industries - Professional, scientific, and technical services (%)
Most Common Industries - Management of companies and enterprises (%)
Most Common Industries - Administrative and support and waste management services (%)
Most Common Industries - Educational services, and health care and social assistance (%)
Most Common Industries - Educational services (%)
Most Common Industries - Health care and social assistance (%)
Most Common Industries - Arts, entertainment, and recreation, and accommodation and food services (%)
Most Common Industries - Arts, entertainment, and recreation (%)
Most Common Industries - Accommodation and food services (%)
Most Common Industries - Other services, except public administration (%)
Most Common Industries - Public administration (%)
Occupation diversity
Most Common Occupations - Management, business, science, and arts occupations (%)
Most Common Occupations - Management, business, and financial occupations (%)
Most Common Occupations - Management occupations (%)
Most Common Occupations - Business and financial operations occupations (%)
Most Common Occupations - Computer, engineering, and science occupations (%)
Most Common Occupations - Computer and mathematical occupations (%)
Most Common Occupations - Architecture and engineering occupations (%)
Most Common Occupations - Life, physical, and social science occupations (%)
Most Common Occupations - Education, legal, community service, arts, and media occupations (%)
Most Common Occupations - Community and social service occupations (%)
Most Common Occupations - Legal occupations (%)
Most Common Occupations - Education, training, and library occupations (%)
Most Common Occupations - Arts, design, entertainment, sports, and media occupations (%)
Most Common Occupations - Healthcare practitioners and technical occupations (%)
Most Common Occupations - Health diagnosing and treating practitioners and other technical occupations (%)
Most Common Occupations - Health technologists and technicians (%)
Most Common Occupations - Service occupations (%)
Most Common Occupations - Healthcare support occupations (%)
Most Common Occupations - Protective service occupations (%)
Most Common Occupations - Fire fighting and prevention, and other protective service workers including supervisors (%)
Most Common Occupations - Law enforcement workers including supervisors (%)
Most Common Occupations - Food preparation and serving related occupations (%)
Most Common Occupations - Building and grounds cleaning and maintenance occupations (%)
Most Common Occupations - Personal care and service occupations (%)
Most Common Occupations - Sales and office occupations (%)
Most Common Occupations - Sales and related occupations (%)
Most Common Occupations - Office and administrative support occupations (%)
Most Common Occupations - Natural resources, construction, and maintenance occupations (%)
Most Common Occupations - Farming, fishing, and forestry occupations (%)
Most Common Occupations - Construction and extraction occupations (%)
Most Common Occupations - Installation, maintenance, and repair occupations (%)
Most Common Occupations - Production, transportation, and material moving occupations (%)
Most Common Occupations - Production occupations (%)
Most Common Occupations - Transportation occupations (%)
Most Common Occupations - Material moving occupations (%)
People in Group quarters - Institutionalized population (%)
People in Group quarters - Correctional institutions (%)
People in Group quarters - Federal prisons and detention centers (%)
People in Group quarters - Halfway houses (%)
People in Group quarters - Local jails and other confinement facilities (including police lockups) (%)
People in Group quarters - Military disciplinary barracks (%)
People in Group quarters - State prisons (%)
People in Group quarters - Other types of correctional institutions (%)
People in Group quarters - Nursing homes (%)
People in Group quarters - Hospitals/wards, hospices, and schools for the handicapped (%)
People in Group quarters - Hospitals/wards and hospices for chronically ill (%)
People in Group quarters - Hospices or homes for chronically ill (%)
People in Group quarters - Military hospitals or wards for chronically ill (%)
People in Group quarters - Other hospitals or wards for chronically ill (%)
People in Group quarters - Hospitals or wards for drug/alcohol abuse (%)
People in Group quarters - Mental (Psychiatric) hospitals or wards (%)
People in Group quarters - Schools, hospitals, or wards for the mentally retarded (%)
People in Group quarters - Schools, hospitals, or wards for the physically handicapped (%)
People in Group quarters - Institutions for the deaf (%)
People in Group quarters - Institutions for the blind (%)
People in Group quarters - Orthopedic wards and institutions for the physically handicapped (%)
People in Group quarters - Wards in general hospitals for patients who have no usual home elsewhere (%)
People in Group quarters - Wards in military hospitals for patients who have no usual home elsewhere (%)
People in Group quarters - Juvenile institutions (%)
People in Group quarters - Long-term care (%)
People in Group quarters - Homes for abused, dependent, and neglected children (%)
People in Group quarters - Residential treatment centers for emotionally disturbed children (%)
People in Group quarters - Training schools for juvenile delinquents (%)
People in Group quarters - Short-term care, detention or diagnostic centers for delinquent children (%)
People in Group quarters - Type of juvenile institution unknown (%)
People in Group quarters - Noninstitutionalized population (%)
People in Group quarters - College dormitories (includes college quarters off campus) (%)
People in Group quarters - Military quarters (%)
People in Group quarters - On base (%)
People in Group quarters - Barracks, unaccompanied personnel housing (UPH), (Enlisted/Officer), ;and similar group living quarters for military personnel (%)
People in Group quarters - Transient quarters for temporary residents (%)
People in Group quarters - Military ships (%)
People in Group quarters - Group homes (%)
People in Group quarters - Homes or halfway houses for drug/alcohol abuse (%)
People in Group quarters - Homes for the mentally ill (%)
People in Group quarters - Homes for the mentally retarded (%)
People in Group quarters - Homes for the physically handicapped (%)
People in Group quarters - Other group homes (%)
People in Group quarters - Religious group quarters (%)
People in Group quarters - Dormitories (%)
People in Group quarters - Agriculture workers' dormitories on farms (%)
People in Group quarters - Job Corps and vocational training facilities (%)
People in Group quarters - Other workers' dormitories (%)
People in Group quarters - Crews of maritime vessels (%)
People in Group quarters - Other nonhousehold living situations (%)
People in Group quarters - Other noninstitutional group quarters (%)
Residents speaking English at home (%)
Residents speaking English at home - Born in the United States (%)
Residents speaking English at home - Native, born elsewhere (%)
Residents speaking English at home - Foreign born (%)
Residents speaking Spanish at home (%)
Residents speaking Spanish at home - Born in the United States (%)
Residents speaking Spanish at home - Native, born elsewhere (%)
Residents speaking Spanish at home - Foreign born (%)
Residents speaking other language at home (%)
Residents speaking other language at home - Born in the United States (%)
Residents speaking other language at home - Native, born elsewhere (%)
Residents speaking other language at home - Foreign born (%)
Class of Workers - Employee of private company (%)
Class of Workers - Self-employed in own incorporated business (%)
Class of Workers - Private not-for-profit wage and salary workers (%)
Class of Workers - Local government workers (%)
Class of Workers - State government workers (%)
Class of Workers - Federal government workers (%)
Class of Workers - Self-employed workers in own not incorporated business and Unpaid family workers (%)
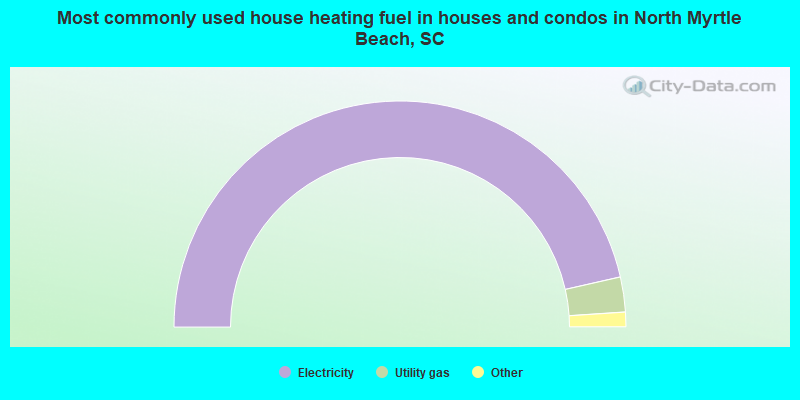
House heating fuel used in houses and condos - Utility gas (%)
House heating fuel used in houses and condos - Bottled, tank, or LP gas (%)
House heating fuel used in houses and condos - Electricity (%)
House heating fuel used in houses and condos - Fuel oil, kerosene, etc. (%)
House heating fuel used in houses and condos - Coal or coke (%)
House heating fuel used in houses and condos - Wood (%)
House heating fuel used in houses and condos - Solar energy (%)
House heating fuel used in houses and condos - Other fuel (%)
House heating fuel used in houses and condos - No fuel used (%)
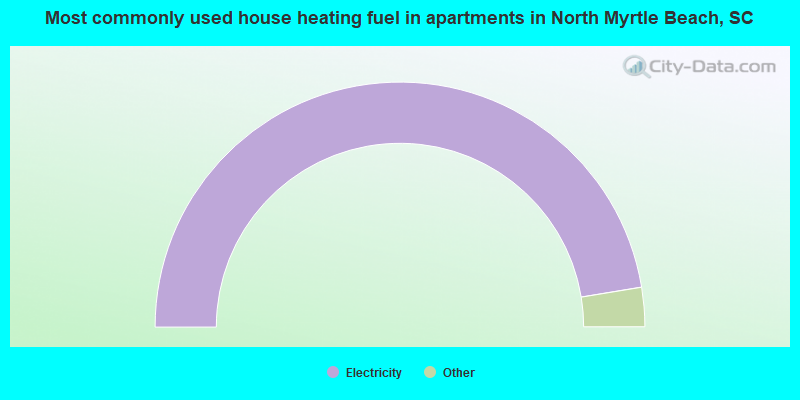
House heating fuel used in apartments - Utility gas (%)
House heating fuel used in apartments - Bottled, tank, or LP gas (%)
House heating fuel used in apartments - Electricity (%)
House heating fuel used in apartments - Fuel oil, kerosene, etc. (%)
House heating fuel used in apartments - Coal or coke (%)
House heating fuel used in apartments - Wood (%)
House heating fuel used in apartments - Solar energy (%)
House heating fuel used in apartments - Other fuel (%)
House heating fuel used in apartments - No fuel used (%)
Armed forces status - In Armed Forces (%)
Armed forces status - Civilian (%)
Armed forces status - Civilian - Veteran (%)
Armed forces status - Civilian - Nonveteran (%)
Fatal accidents locations in years 2005-2021
Fatal accidents locations in 2005
Fatal accidents locations in 2006
Fatal accidents locations in 2007
Fatal accidents locations in 2008
Fatal accidents locations in 2009
Fatal accidents locations in 2010
Fatal accidents locations in 2011
Fatal accidents locations in 2012
Fatal accidents locations in 2013
Fatal accidents locations in 2014
Fatal accidents locations in 2015
Fatal accidents locations in 2016
Fatal accidents locations in 2017
Fatal accidents locations in 2018
Fatal accidents locations in 2019
Fatal accidents locations in 2020
Fatal accidents locations in 2021
Alcohol use - People drinking some alcohol every month (%)
Alcohol use - People not drinking at all (%)
Alcohol use - Average days/month drinking alcohol
Alcohol use - Average drinks/week
Alcohol use - Average days/year people drink much
Audiometry - Average condition of hearing (%)
Audiometry - People that can hear a whisper from across a quiet room (%)
Audiometry - People that can hear normal voice from across a quiet room (%)
Audiometry - Ears ringing, roaring, buzzing (%)
Audiometry - Had a job exposure to loud noise (%)
Audiometry - Had off-work exposure to loud noise (%)
Blood Pressure & Cholesterol - Has high blood pressure (%)
Blood Pressure & Cholesterol - Checking blood pressure at home (%)
Blood Pressure & Cholesterol - Frequently checking blood cholesterol (%)
Blood Pressure & Cholesterol - Has high cholesterol level (%)
Consumer Behavior - Money monthly spent on food at supermarket/grocery store
Consumer Behavior - Money monthly spent on food at other stores
Consumer Behavior - Money monthly spent on eating out
Consumer Behavior - Money monthly spent on carryout/delivered foods
Consumer Behavior - Income spent on food at supermarket/grocery store (%)
Consumer Behavior - Income spent on food at other stores (%)
Consumer Behavior - Income spent on eating out (%)
Consumer Behavior - Income spent on carryout/delivered foods (%)
Current Health Status - General health condition (%)
Current Health Status - Blood donors (%)
Current Health Status - Has blood ever tested for HIV virus (%)
Current Health Status - Left-handed people (%)
Dermatology - People using sunscreen (%)
Diabetes - Diabetics (%)
Diabetes - Had a blood test for high blood sugar (%)
Diabetes - People taking insulin (%)
Diet Behavior & Nutrition - Diet health (%)
Diet Behavior & Nutrition - Milk product consumption (# of products/month)
Diet Behavior & Nutrition - Meals not home prepared (#/week)
Diet Behavior & Nutrition - Meals from fast food or pizza place (#/week)
Diet Behavior & Nutrition - Ready-to-eat foods (#/month)
Diet Behavior & Nutrition - Frozen meals/pizza (#/month)
Drug Use - People that ever used marijuana or hashish (%)
Drug Use - Ever used hard drugs (%)
Drug Use - Ever used any form of cocaine (%)
Drug Use - Ever used heroin (%)
Drug Use - Ever used methamphetamine (%)
Health Insurance - People covered by health insurance (%)
Kidney Conditions-Urology - Avg. # of times urinating at night
Medical Conditions - People with asthma (%)
Medical Conditions - People with anemia (%)
Medical Conditions - People with psoriasis (%)
Medical Conditions - People with overweight (%)
Medical Conditions - Elderly people having difficulties in thinking or remembering (%)
Medical Conditions - People who ever received blood transfusion (%)
Medical Conditions - People having trouble seeing even with glass/contacts (%)
Medical Conditions - People with arthritis (%)
Medical Conditions - People with gout (%)
Medical Conditions - People with congestive heart failure (%)
Medical Conditions - People with coronary heart disease (%)
Medical Conditions - People with angina pectoris (%)
Medical Conditions - People who ever had heart attack (%)
Medical Conditions - People who ever had stroke (%)
Medical Conditions - People with emphysema (%)
Medical Conditions - People with thyroid problem (%)
Medical Conditions - People with chronic bronchitis (%)
Medical Conditions - People with any liver condition (%)
Medical Conditions - People who ever had cancer or malignancy (%)
Mental Health - People who have little interest in doing things (%)
Mental Health - People feeling down, depressed, or hopeless (%)
Mental Health - People who have trouble sleeping or sleeping too much (%)
Mental Health - People feeling tired or having little energy (%)
Mental Health - People with poor appetite or overeating (%)
Mental Health - People feeling bad about themself (%)
Mental Health - People who have trouble concentrating on things (%)
Mental Health - People moving or speaking slowly or too fast (%)
Mental Health - People having thoughts they would be better off dead (%)
Oral Health - Average years since last visit a dentist
Oral Health - People embarrassed because of mouth (%)
Oral Health - People with gum disease (%)
Oral Health - General health of teeth and gums (%)
Oral Health - Average days a week using dental floss/device
Oral Health - Average days a week using mouthwash for dental problem
Oral Health - Average number of teeth
Pesticide Use - Households using pesticides to control insects (%)
Pesticide Use - Households using pesticides to kill weeds (%)
Physical Activity - People doing vigorous-intensity work activities (%)
Physical Activity - People doing moderate-intensity work activities (%)
Physical Activity - People walking or bicycling (%)
Physical Activity - People doing vigorous-intensity recreational activities (%)
Physical Activity - People doing moderate-intensity recreational activities (%)
Physical Activity - Average hours a day doing sedentary activities
Physical Activity - Average hours a day watching TV or videos
Physical Activity - Average hours a day using computer
Physical Functioning - People having limitations keeping them from working (%)
Physical Functioning - People limited in amount of work they can do (%)
Physical Functioning - People that need special equipment to walk (%)
Physical Functioning - People experiencing confusion/memory problems (%)
Physical Functioning - People requiring special healthcare equipment (%)
Prescription Medications - Average number of prescription medicines taking
Preventive Aspirin Use - Adults 40+ taking low-dose aspirin (%)
Reproductive Health - Vaginal deliveries (%)
Reproductive Health - Cesarean deliveries (%)
Reproductive Health - Deliveries resulted in a live birth (%)
Reproductive Health - Pregnancies resulted in a delivery (%)
Reproductive Health - Women breastfeeding newborns (%)
Reproductive Health - Women that had a hysterectomy (%)
Reproductive Health - Women that had both ovaries removed (%)
Reproductive Health - Women that have ever taken birth control pills (%)
Reproductive Health - Women taking birth control pills (%)
Reproductive Health - Women that have ever used Depo-Provera or injectables (%)
Reproductive Health - Women that have ever used female hormones (%)
Sexual Behavior - People 18+ that ever had sex (vaginal, anal, or oral) (%)
Sexual Behavior - Males 18+ that ever had vaginal sex with a woman (%)
Sexual Behavior - Males 18+ that ever performed oral sex on a woman (%)
Sexual Behavior - Males 18+ that ever had anal sex with a woman (%)
Sexual Behavior - Males 18+ that ever had any sex with a man (%)
Sexual Behavior - Females 18+ that ever had vaginal sex with a man (%)
Sexual Behavior - Females 18+ that ever performed oral sex on a man (%)
Sexual Behavior - Females 18+ that ever had anal sex with a man (%)
Sexual Behavior - Females 18+ that ever had any kind of sex with a woman (%)
Sexual Behavior - Average age people first had sex
Sexual Behavior - Average number of female sex partners in lifetime (males 18+)
Sexual Behavior - Average number of female vaginal sex partners in lifetime (males 18+)
Sexual Behavior - Average age people first performed oral sex on a woman (18+)
Sexual Behavior - Average number of woman performed oral sex on in lifetime (18+)
Sexual Behavior - Average number of male sex partners in lifetime (males 18+)
Sexual Behavior - Average number of male anal sex partners in lifetime (males 18+)
Sexual Behavior - Average age people first performed oral sex on a man (18+)
Sexual Behavior - Average number of male oral sex partners in lifetime (18+)
Sexual Behavior - People using protection when performing oral sex (%)
Sexual Behavior - Average number of times people have vaginal or anal sex a year
Sexual Behavior - People having sex without condom (%)
Sexual Behavior - Average number of male sex partners in lifetime (females 18+)
Sexual Behavior - Average number of male vaginal sex partners in lifetime (females 18+)
Sexual Behavior - Average number of female sex partners in lifetime (females 18+)
Sexual Behavior - Circumcised males 18+ (%)
Sleep Disorders - Average hours sleeping at night
Sleep Disorders - People that has trouble sleeping (%)
Smoking-Cigarette Use - People smoking cigarettes (%)
Taste & Smell - People 40+ having problems with smell (%)
Taste & Smell - People 40+ having problems with taste (%)
Taste & Smell - People 40+ that ever had wisdom teeth removed (%)
Taste & Smell - People 40+ that ever had tonsils teeth removed (%)
Taste & Smell - People 40+ that ever had a loss of consciousness because of a head injury (%)
Taste & Smell - People 40+ that ever had a broken nose or other serious injury to face or skull (%)
Taste & Smell - People 40+ that ever had two or more sinus infections (%)
Weight - Average height (inches)
Weight - Average weight (pounds)
Weight - Average BMI
Weight - People that are obese (%)
Weight - People that ever were obese (%)
Weight - People trying to lose weight (%)
Officers per 1,000 residents here:
4.65South Carolina average:
2.21
Latest news from North Myrtle Beach, SC collected exclusively by city-data.com from local newspapers, TV, and radio stations
North Myrtle Beach, SC City Guides: Ancestries: European (15.1%), English (14.6%), Irish (11.7%), American (10.6%), German (9.1%), Scotch-Irish (4.5%).
Current Local Time:
Land area: 13.0 square miles.
Population density: 1,521 people per square mile (low).
1,476 residents are foreign born (4.0% Latin America , 1.7% Asia , 1.1% Europe ).
This city:
7.3%South Carolina:
5.3%
Median real estate property taxes paid for housing units with mortgages in 2022: $1,360 (0.3%)Median real estate property taxes paid for housing units with no mortgage in 2022: $1,409 (0.3%)
Nearest city with pop. 50,000+: Wilmington, NC
Nearest city with pop. 200,000+: Raleigh, NC
Nearest city with pop. 1,000,000+: Philadelphia, PA
Nearest cities:
Latitude: 33.82 N, Longitude: 78.68 W
Daytime population change due to commuting: +3,928 (+19.4%)Workers who live and work in this city: 3,924 (45.1%)
Property values in North Myrtle Beach, SC
North Myrtle Beach tourist attractions:
Alabama Theatre- North Myrtle Beach, South Carolina - Theater Featuring Musical Shows Alligator Adventure - North Myrtle Beach, South Carolina - Reptile Zoo Avista Resort - North Myrtle Beach, SC - Condo Rentals and Timeshares Barefoot Landing - North Myrtle Beach, South Carolina - Shopping Complex With Restaurants and Entertainment Venues Barefoot Resort & Golf Club, Love Course, North Myrtle Beach, South Carolina - Ranked #1 Among the Top 50 Courses in Myrtle Beach by Golf Digest Bay Watch Resort - North Myrtle Beach, SC - Smoke Free Condo Rentals Beach Cove Resort - North Myrtle Beach, SC - Suite and Condo Rentals Ghosts and Legends Theatre - North Myrtle Beach, South Carolina - Ghost Themed Theater Hawaiian Rumble - North Myrtle Beach, South Carolina - MiniGolf Course Inlet Point Plantation Stables - North Myrtle Beach, South Carolina Horse Riding Center Towers on the Grove North Myrtle Beach - Myrtle Beach, South Carolina - City and Popular Tourist Destination Ocean Drive Beach and Golf Resort - North Myrtle Beach, SC - Rental Suites, Condos, and Apartments Prince Resort Condos - North Myrtle Beach, South Carolina - Resort by Cherry Grove Pier Sands Beach Club Resort - North Myrtle Beach, SC - Beachfront Suites with Ocean Views SeaSide Hotel - North Myrtle Beach, SC - Luxury Beachfront Condominium Rentals Tidewater Golf Club, North Myrtle Beach, South Carolina ? Known as the ``Pebble Beach of the East'' T.I.G.E.R.S. Preservation Station - North Myrtle Beach, South Carolina Wildlife Exhibit & Zoo Wyndham Ocean Boulevard - North Myrtle Beach, SC - Seaside Condo Resort Single-family new house construction building permits:
2022: 505 buildings , average cost: $330,7002021: 465 buildings , average cost: $272,5002020: 380 buildings , average cost: $250,2002019: 290 buildings , average cost: $260,8002018: 314 buildings , average cost: $252,9002017: 297 buildings , average cost: $252,5002016: 262 buildings , average cost: $253,9002015: 232 buildings , average cost: $259,1002014: 273 buildings , average cost: $241,2002013: 265 buildings , average cost: $230,7002012: 221 buildings , average cost: $231,1002011: 162 buildings , average cost: $223,3002010: 138 buildings , average cost: $238,9002009: 104 buildings , average cost: $254,7002008: 136 buildings , average cost: $253,1002007: 221 buildings , average cost: $261,0002006: 383 buildings , average cost: $236,4002005: 462 buildings , average cost: $200,9002004: 425 buildings , average cost: $133,2002003: 391 buildings , average cost: $132,5002002: 265 buildings , average cost: $145,6002001: 179 buildings , average cost: $154,5002000: 244 buildings , average cost: $130,1001999: 192 buildings , average cost: $130,2001998: 215 buildings , average cost: $106,7001997: 186 buildings , average cost: $105,900Unemployment in December 2023: Here:
3.9%South Carolina:
3.1%
Population change in the 1990s: +1,857 (+20.4%).
Most common industries in North Myrtle Beach, SC (%)
Both Males Females
Accommodation & food services (16.5%)
Construction (10.0%)
Arts, entertainment, recreation (9.2%)
Real estate & rental & leasing (8.0%)
Educational services (6.5%)
Health care (6.3%)
Professional, scientific, technical services (4.1%)
Construction (17.4%)
Accommodation & food services (13.8%)
Arts, entertainment, recreation (10.8%)
Real estate & rental & leasing (8.6%)
Administrative & support & waste management services (4.5%)
Food & beverage stores (4.4%)
Educational services (4.0%)
Accommodation & food services (19.7%)
Health care (11.1%)
Educational services (9.6%)
Real estate & rental & leasing (7.3%)
Arts, entertainment, recreation (7.2%)
Professional, scientific, technical services (4.6%)
Motor vehicle & parts dealers (3.2%)
Most common occupations in North Myrtle Beach, SC (%)
Both Males Females
Other sales and related occupations, including supervisors (7.5%)
Building and grounds cleaning and maintenance occupations (6.3%)
Other management occupations, except farmers and farm managers (5.7%)
Retail sales workers, except cashiers (4.3%)
Cashiers (4.1%)
Waiters and waitresses (3.6%)
Sales representatives, services, wholesale and manufacturing (2.9%)
Other sales and related occupations, including supervisors (8.9%)
Building and grounds cleaning and maintenance occupations (8.9%)
Other management occupations, except farmers and farm managers (5.8%)
Carpenters (4.0%)
Supervisors, construction and extraction workers (3.7%)
Electrical equipment mechanics and other installation, maintenance, and repair workers, including supervisors (3.7%)
Retail sales workers, except cashiers (3.2%)
Cashiers (6.9%)
Waiters and waitresses (6.9%)
Other sales and related occupations, including supervisors (5.8%)
Retail sales workers, except cashiers (5.6%)
Other management occupations, except farmers and farm managers (5.6%)
Secretaries and administrative assistants (5.5%)
Registered nurses (5.3%)
Tornado activity:
North Myrtle Beach-area historical tornado activity is below South Carolina state average. It is 34% smaller than the overall U.S. average.
On 8/17/1965, a category F3 (max. wind speeds 158-206 mph) tornado 0.8 miles away from the North Myrtle Beach city center injured 46 people and caused between $50,000 and $500,000 in damages.
On 11/7/1995, a category F4 (max. wind speeds 207-260 mph) tornado 38.7 miles away from the city center injured one person and caused between $500,000 and $5,000,000 in damages.
Earthquake activity:
North Myrtle Beach-area historical earthquake activity is significantly above South Carolina state average. It is 58% smaller than the overall U.S. average. On 8/23/2011 at 17:51:04, a magnitude 5.8 (5.8 MW, Depth: 3.7 mi, Class: Moderate, Intensity: VI - VII) earthquake occurred 285.8 miles away from the city center On 11/22/1974 at 05:25:55, a magnitude 4.7 (4.7 MB, Class: Light, Intensity: IV - V) earthquake occurred 105.9 miles away from the city center On 8/9/2020 at 12:07:37, a magnitude 5.1 (5.1 MW, Depth: 4.7 mi) earthquake occurred 228.7 miles away from the city center On 8/21/1992 at 16:31:55, a magnitude 4.4 (4.1 MB, 4.1 LG, 4.4 LG, Depth: 6.2 mi) earthquake occurred 98.6 miles away from the city center On 8/2/1974 at 08:52:09, a magnitude 4.9 (4.3 MB, 4.9 LG) earthquake occurred 218.7 miles away from the city center On 4/17/1995 at 13:45:57, a magnitude 3.9 (3.9 LG, Depth: 6.2 mi, Class: Light, Intensity: II - III) earthquake occurred 100.4 miles away from the city center Magnitude types: regional Lg-wave magnitude (LG), body-wave magnitude (MB), moment magnitude (MW) Natural disasters: The number of natural disasters in Horry County (22) is greater than the US average (15).Major Disasters (Presidential) Declared: 10Emergencies Declared: 5Hurricanes: 12, Fires: 3, Floods: 2, Storms: 2, Winter Storms: 2, Ice Storm: 1, Tropical Storm: 1, Other: 1 (Note: some incidents may be assigned to more than one category). Hospitals and medical centers in North Myrtle Beach: FMC DIALYSIS SERVICES NORTH MYRTLE BEACH (710 A HIGHWAY 17 SOUTH)
Other hospitals and medical centers near North Myrtle Beach: GRAND STRAND REGIONAL MEDICAL CENTER (about 10 miles away; MYRTLE BEACH, SC)
COVENANT TOWERS HEALTHCARE CENTER (Nursing Home, about 12 miles away; MYRTLE BEACH, SC)
FRESENIUS MEDICAL CARE MYRTLE BEACH (Dialysis Facility, about 13 miles away; MYRTLE BEACH, SC)
AMEDISYS HOME HEALTH OF MYRTLE BEACH (Home Health Center, about 15 miles away; MYRTLE BEACH, SC)
Airports located in North Myrtle Beach: Amtrak station near North Myrtle Beach: 17 miles: MYRTLE BEACH (1100 JETPORT RD.) - Bus Station Colleges/universities with over 2000 students nearest to North Myrtle Beach:
Horry-Georgetown Technical College (about 19 miles; Conway, SC ; Full-time enrollment: 5,772)
Coastal Carolina University (about 20 miles; Conway, SC ; FT enrollment: 8,881)
Cape Fear Community College (about 51 miles; Wilmington, NC ; FT enrollment: 8,372)
Miller-Motte College-Wilmington (about 54 miles; Wilmington, NC ; FT enrollment: 2,395)
University of North Carolina Wilmington (about 54 miles; Wilmington, NC ; FT enrollment: 13,112)
Robeson Community College (about 59 miles; Lumberton, NC ; FT enrollment: 2,322)
Francis Marion University (about 62 miles; Florence, SC ; FT enrollment: 3,624)
Public elementary/middle school in North Myrtle Beach: OCEAN DRIVE ELEMENTARY Location: 901 11TH AVENUE NORTH, Grades: PK-5)
Private elementary/middle school in North Myrtle Beach: THE LORDS CHILDREN Students: 96, Location: 818 JORDAN RD, Grades: PK-1)
See full list of schools located in North Myrtle Beach User-submitted facts and corrections:
WNMB Radio in North Myrtle Beach is owned by Norman Communications Inc. (not Fidelity Broadcasting) Licensed was transferred by FCC in 2004
Notable locations in North Myrtle Beach: (A) , Robbers Roost Golf Club (B) , Sherwood Forest Campground (C) , Surf Golf and Beach Club (D) , Camp Nixon (E) , Harbourgate Resort and Marina (F) , North Myrtle Beach Ocean Drive Wastewater Treatment Facility (G) , Windy Hill Antiaircraft Camp (H) , J Bryan Floyd Community Center (I) , North Myrtle Beach City Hall (J) , Horry County Fire Department North Myrtle Beach (K) , North Myrtle Beach Fire Department Station 5 (L) , North Myrtle Beach Fire Department Station 2 (M) , North Myrtle Beach Fire Department Station 3 (N) , North Myrtle Beach Fire Department Station 1 (O) , North Myrtle Beach Police Department - Customer Service (P) , Briarcliffe Acres Police Department (Q) . Display/hide their locations on the map
Shopping Centers: (1) , Surfwood Shopping Center (2) . Display/hide their locations on the map
Churches in North Myrtle Beach include: (A) , King of Glory Lutheran Church (B) , First Baptist Church (C) , Church of God (D) , Trinity Church (E) , Lake Side Church (F) , Coastal Christian Center (G) , Our Lady Star of the Sea Church (H) , Saint Stephens Church (I) . Display/hide their locations on the map
Cemetery: (1) . Display/hide its location on the map
Lakes, reservoirs, and swamps: (A) , Lewis Pond (B) , Prices Swamp (C) . Display/hide their locations on the map
Streams, rivers, and creeks: (A) , Nixon Creek (B) , Camp Branch Run (C) , Eden Saltworks Creek (D) . Display/hide their locations on the map
Parks in North Myrtle Beach include: (1) , Central Park (2) . Display/hide their locations on the map
Beaches: (A) , Cherry Grove Beach (B) , Futch Beach (C) . Display/hide their locations on the map
Tourist attractions: (1) , Exotic Aquarium Designs (Cultural Attractions- Events- & Facilities; 1415 Old Highway 17 North) (2) , Libraries-Horry County - Branches- North Myrtle Beach (Cultural Attractions- Events- & Facilities; 799 2nd Avenue North) (3) , Sheraton Broadway Plantation (Tourism Consultants; 1104 Kings Highway) (4) , Libraries-Horry County - North Myrtle Beach (Cultural Attractions- Events- & Facilities; 799 2nd Avenue North) (5) , Palmetto Vacations of the Carolinas (Recreation Areas; 905 Sea Mountain Hwy) (6) , Park Place Properties (Amusement & Theme Parks; 614 Sea Mountain Highway) (7) , Fun World (Amusement & Theme Parks; 700 7th Avenue South) (8) , Grand PRIX Family Thrill Parks (Amusement & Theme Parks; 3201 South King Highway) (9) . Display/hide their approximate locations on the map
Hotels: (1) , Ocean Garden Villas (1809 South Ocean Boulevard) (2) , Best Western Inn & Suites (1601 Highway 17 South) (3) , Ocean Inn (1305 North Ocean Boulevard) (4) , Back to the Beach (1416 South Ocean Boulevard) (5) , Crescent Beach Villas (1709 South Ocean Boulevard) (6) , By the Sea Motel (1801 South Ocean Boulevard) (7) , Hampton Inn Harbourgate (2112 Little River Neck Road) (8) , Holiday Inn (2713 South Ocean Blvd) (9) . Display/hide their approximate locations on the map
Birthplace of: Matt Kyle - College basketball player (Yale Bulldogs).
Horry County has a predicted average indoor radon screening level less than 2 pCi/L (pico curies per liter) - Low Potential Average household size: This city:
2.0 peopleSouth Carolina:
2.5 people
Percentage of family households: This city:
58.5%Whole state:
67.5%
Percentage of households with unmarried partners: This city:
6.7%Whole state:
6.0%
Likely homosexual households (counted as self-reported same-sex unmarried-partner households)
Lesbian couples: 0.5% of all households Gay men: 0.4% of all households
Banks with most branches in North Myrtle Beach (2011 data):
TD Bank, National Association: Crescent Beach Branch at 1801 Highway 17 South, branch established on 1994/05/05; Cherry Grove Branch at 1201 Sea Mountain Highway, branch established on 1988/07/18. Info updated 2010/10/04: Bank assets: $188,912.6 mil, Deposits: $153,149.8 mil, headquarters in Wilmington, DE, positive income , 1314 total offices , Holding Company: Toronto-Dominion Bank, The
Branch Banking and Trust Company: North Myrtle Beach Main Branch at 521 Main St, branch established on 1954/01/11; North Myrtle Beach Highway 17 Branch at 720 Highway 17 South, branch established on 1986/07/16. Info updated 2010/03/29: Bank assets: $168,867.6 mil, Deposits: $127,549.5 mil, headquarters in Winston Salem, NC, positive income , Commercial Lending Specialization, 1793 total offices , Holding Company: Bb&T Corporation
The Conway National Bank: North Myrtle Beach Office Branch at 110 Highway 17 North, branch established on 2002/09/30; Northside Branch at Highway 17 And Chestnut Road, branch established on 1977/05/02. Info updated 2010/06/01: Bank assets: $914.3 mil, Deposits: $733.3 mil, headquarters in Conway, SC, positive income , Commercial Lending Specialization, 15 total offices , Holding Company: Cnb Corporation
First Federal Savings and Loan Association of Charleston: North Myrtle Beach Branch at 550 Highway 17 North, branch established on 2004/01/21; North Myrtle Branch at 606 Main Street, branch established on 2005/06/06. Info updated 2012/02/24: Bank assets: $3,140.4 mil, Deposits: $2,278.8 mil, headquarters in Charleston, SC, negative income in the last year , Mortgage Lending Specialization, 69 total offices
Wells Fargo Bank, National Association: North Myrtle Beach Branch at 1025 Highway 17 South, branch established on 1967/07/20; Barefoot Commons Financial Center at 3910 Highwy 17 S, branch established on 2010/07/01. Info updated 2011/04/05: Bank assets: $1,161,490.0 mil, Deposits: $905,653.0 mil, headquarters in Sioux Falls, SD, positive income , 6395 total offices , Holding Company: Wells Fargo & Company
Horry County State Bank: Ocean Drive Branch at 617 Hwy. 17 South, branch established on 2007/06/11; Windy Hill Branch at 4400 Hwy 17 South, branch established on 2002/05/24. Info updated 2006/11/03: Bank assets: $537.9 mil, Deposits: $491.4 mil, headquarters in Loris, SC, negative income in the last year , Commercial Lending Specialization, 13 total offices , Holding Company: Hcsb Financial Corporation
First Citizens Bank and Trust Company, Inc.: North Myrtle Beach Branch at 601 Highway 17 South, branch established on 1999/03/22. Info updated 2011/08/24: Bank assets: $8,104.0 mil, Deposits: $6,880.8 mil, headquarters in Columbia, SC, positive income , 197 total offices , Holding Company: First Citizens Bancorporation, Inc.
Bank of America, National Association: North Myrtle Beach Branch at 1339 U.S. Highway 17, South, branch established on 1974/02/11. Info updated 2009/11/18: Bank assets: $1,451,969.3 mil, Deposits: $1,077,176.8 mil, headquarters in Charlotte, NC, positive income , 5782 total offices , Holding Company: Bank Of America Corporation
Carolina Bank & Trust Co.: N Myrtle Beach Branch at 1043 Sea Mountain Hwy, branch established on 2001/05/07. Info updated 2006/11/03: Bank assets: $358.5 mil, Deposits: $314.2 mil, headquarters in Lamar, SC, positive income , Commercial Lending Specialization, 16 total offices , Holding Company: First Carolina Bancshares Corporation
6 other banks with 6 local branches
For population 15 years and over in North Myrtle Beach:
Never married: 15.9%Now married: 60.9%Separated: 2.2%Widowed: 8.1%Divorced: 12.8% For population 25 years and over in North Myrtle Beach:
High school or higher: 94.6%Bachelor's degree or higher: 39.1%Graduate or professional degree: 13.5%Unemployed: 3.9%Mean travel time to work (commute): 19.6 minutes
Education Gini index (Inequality in education) Here:
9.4South Carolina average:
11.1
Religion statistics for North Myrtle Beach, SC (based on Horry County data)
Religion Adherents Congregations Evangelical Protestant 61,718 270 Mainline Protestant 18,278 39 Catholic 18,159 5 Black Protestant 7,891 41 Other 3,148 14 Orthodox 730 3 None 159,367 -
Source: Clifford Grammich, Kirk Hadaway, Richard Houseal, Dale E.Jones, Alexei Krindatch, Richie Stanley and Richard H.Taylor. 2012. 2010 U.S.Religion Census: Religious Congregations & Membership Study. Association of Statisticians of American Religious Bodies. Jones, Dale E., et al. 2002. Congregations and Membership in the United States 2000. Nashville, TN: Glenmary Research Center. Graphs represent county-level data
Food Environment Statistics: Number of grocery stores : 56This county :
2.24 / 10,000 pop.South Carolina :
1.99 / 10,000 pop.
Number of supercenters and club stores : 7Here :
0.28 / 10,000 pop.State :
0.15 / 10,000 pop.
Number of convenience stores (no gas) : 17Here :
0.68 / 10,000 pop.South Carolina :
0.85 / 10,000 pop.
Number of convenience stores (with gas) : 164Horry County :
6.57 / 10,000 pop.South Carolina :
5.38 / 10,000 pop.
Number of full-service restaurants : 459Horry County :
18.38 / 10,000 pop.State :
7.75 / 10,000 pop.
Adult diabetes rate : This county :
9.9%South Carolina :
10.6%
Adult obesity rate : Horry County :
27.1%South Carolina :
29.4%
Low-income preschool obesity rate : Horry County :
15.8%South Carolina :
13.4%
Health and Nutrition: Healthy diet rate : Here:
49.2%South Carolina:
49.2%
Average overall health of teeth and gums : North Myrtle Beach:
43.8%South Carolina:
46.2%
People feeling badly about themselves : North Myrtle Beach:
22.5%State:
20.4%
People not drinking alcohol at all : North Myrtle Beach:
9.8%South Carolina:
11.0%
Average hours sleeping at night : North Myrtle Beach:
6.9South Carolina:
6.8
Overweight people : North Myrtle Beach:
35.1%South Carolina:
34.4%
General health condition : North Myrtle Beach:
52.8%South Carolina:
55.6%
Average condition of hearing : This city:
74.9%State:
79.9%
More about Health and Nutrition of North Myrtle Beach, SC Residents
Local government employment and payroll (March 2022)
Function
Full-time employees
Monthly full-time payroll
Average yearly full-time wage
Part-time employees
Monthly part-time payroll
Police Protection - Officers
81 $423,199 $62,696 0 $0 Parks and Recreation
62 $250,270 $48,439 96 $86,027 Firefighters
56 $284,565 $60,978 0 $0 Water Supply
33 $153,415 $55,787 0 $0 Financial Administration
30 $172,958 $69,183 1 $1,452 Solid Waste Management
29 $129,591 $53,624 0 $0 Streets and Highways
27 $115,834 $51,482 0 $0 Correction
26 $91,262 $42,121 0 $0 Other and Unallocable
21 $94,647 $54,084 0 $0 Other Government Administration
19 $155,968 $98,506 2 $2,515 Police - Other
13 $72,099 $66,553 0 $0 Sewerage
11 $73,018 $79,656 0 $0 Judicial and Legal
8 $94,333 $141,500 1 $1,550
Totals for Government
416 $2,111,158 $60,899 100 $91,544
North Myrtle Beach government finances - Expenditure in 2021 (per resident):
Construction - Regular Highways: $4,316,000 ($217.58)
General Public Buildings: $2,057,000 ($103.70)Police Protection: $539,000 ($27.17)Natural Resources - Other: $440,000 ($22.18)Sewerage: $93,000 ($4.69)Parks and Recreation: $90,000 ($4.54)Current Operations - General - Other: $16,937,000 ($853.85)
Police Protection: $11,190,000 ($564.13)Water Utilities: $6,431,000 ($324.21)Local Fire Protection: $5,643,000 ($284.48)Parks and Recreation: $4,293,000 ($216.42)Miscellaneous Commercial Activities - Other: $4,215,000 ($212.49)Sewerage: $3,765,000 ($189.81)Central Staff Services: $3,624,000 ($182.70)Solid Waste Management: $3,545,000 ($178.72)Regular Highways: $2,877,000 ($145.04)Financial Administration: $2,114,000 ($106.57)Judicial and Legal Services: $1,383,000 ($69.72)General Public Buildings: $1,185,000 ($59.74)Natural Resources - Other: $257,000 ($12.96)General - Interest on Debt: $222,000 ($11.19)
Other Capital Outlay - Parks and Recreation: $2,237,000 ($112.77)
Local Fire Protection: $845,000 ($42.60)General - Other: $689,000 ($34.73)Police Protection: $658,000 ($33.17)Sewerage: $558,000 ($28.13)Water Utilities: $499,000 ($25.16)Regular Highways: $274,000 ($13.81)General Public Building: $97,000 ($4.89)Miscellaneous Commercial Activities - Other: $79,000 ($3.98)Financial Administration: $48,000 ($2.42)Central Staff Services: $29,000 ($1.46)Total Salaries and Wages: $36,841,000 ($1857.28)
North Myrtle Beach government finances - Revenue in 2021 (per resident):
Charges - Sewerage: $6,180,000 ($311.55)
Solid Waste Management: $5,473,000 ($275.91)Miscellaneous Commercial Activities: $5,466,000 ($275.56)Natural Resources - Other: $2,987,000 ($150.58)Parking Facilities: $993,000 ($50.06)Parks and Recreation: $254,000 ($12.81)Federal Intergovernmental - Other: $1,261,000 ($63.57)
Local Intergovernmental - Highways: $837,000 ($42.20)
Other: $42,000 ($2.12)Miscellaneous - General Revenue - Other: $7,700,000 ($388.18)
Special Assessments: $1,312,000 ($66.14)Rents: $451,000 ($22.74)Fines and Forfeits: $197,000 ($9.93)Interest Earnings: $139,000 ($7.01)Sale of Property: $62,000 ($3.13)Donations From Private Sources: $40,000 ($2.02)Revenue - Water Utilities: $8,472,000 ($427.10)
State Intergovernmental - Other: $5,447,000 ($274.60)
General Local Government Support: $1,294,000 ($65.23)Highways: $992,000 ($50.01)Tax - Property: $20,246,000 ($1020.67)
Other Selective Sales: $13,731,000 ($692.23)Other License: $8,798,000 ($443.54)Public Utility License: $2,374,000 ($119.68)
North Myrtle Beach government finances - Debt in 2021 (per resident):
Long Term Debt - Outstanding Unspecified Public Purpose: $5,858,000 ($295.32)
Issue, Unspecified Public Purpose: $5,000,000 ($252.07)Beginning Outstanding - Unspecified Public Purpose: $3,224,000 ($162.53)Retired Unspecified Public Purpose: $2,366,000 ($119.28)Beginning Outstanding - Public Debt for Private Purpose: $2,253,000 ($113.58)Retired Nonguaranteed - Public Debt for Private Purpose: $1,336,000 ($67.35)Outstanding Nonguaranteed - Industrial Revenue: $916,000 ($46.18)
North Myrtle Beach government finances - Cash and Securities in 2021 (per resident):
Other Funds - Cash and Securities: $40,253,000 ($2029.29)
Sinking Funds - Cash and Securities: $916,000 ($46.18)
Businesses in North Myrtle Beach, SC
Name Count Name Count
Applebee's 1 McDonald's 2 Arby's 2 Nike 1 Best Western 1 Office Depot 1 Buffalo Wild Wings 1 Olive Garden 1 CVS 2 Papa John's Pizza 1 Chick-Fil-A 1 Pizza Hut 2 Circle K 1 Quality 1 Clarks 1 Rite Aid 1 Cold Stone Creamery 1 Sprint Nextel 1 Comfort Inn 1 Starbucks 1 Cracker Barrel 1 Subway 3 Curves 1 Super 8 2 FedEx 6 T-Mobile 2 Firestone Complete Auto Care 1 T.G.I. Driday's 1 GNC 1 Taco Bell 1 H&R Block 1 U-Haul 1 Hardee's 1 UPS 9 Hilton 1 Vans 1 IHOP 1 Verizon Wireless 1 KFC 1 Waffle House 1 Kroger 1 Walgreens 2 La Quinta 1 Walmart 1 Lowe's 1
Strongest AM radio stations in North Myrtle Beach:
WMIR (1200 AM; 6 kW; ATLANTIC BEACH, SC; Owner: ATLANTIC BEACH RADIO, INC.)
WQJM (1450 AM; 10 kW; MYRTLE BEACH, SC; Owner: NM LICENSING, LLC)
WNMB (900 AM; 0 kW; NORTH MYRTLE BEACH, SC; Owner: FIDELITY BROADCASTING CORPORATION)
WPJS (1330 AM; 5 kW; CONWAY, SC; Owner: WPJS BROADCASTING, INC.)
WTAB (1370 AM; 5 kW; TABOR CITY, NC; Owner: WTAB, INC)
WMYT (1180 AM; daytime; 10 kW; CAROLINA BEACH, NC; Owner: FAMILY RADIO NETWORK, INC.)
WPTF (680 AM; 50 kW; RALEIGH, NC; Owner: FIRST STATE COMMUNICATIONS)
WENC (1220 AM; 5 kW; WHITEVILLE, NC; Owner: DHA COMMUNICATIONS, INC.)
WCEO (840 AM; daytime; 50 kW; COLUMBIA, SC; Owner: EASTERN BROADCASTING GROUP, INC.)
WBAJ (890 AM; daytime; 50 kW; BLYTHEWOOD, SC; Owner: FAMILY FIRST)
WJMX (970 AM; 10 kW; FLORENCE, SC; Owner: QANTUM OF FLORENCE LICENSE COMPANY, LLC)
WAAV (980 AM; 5 kW; LELAND, NC; Owner: CUMULUS LICENSING CORP.)
WLSC (1240 AM; 1 kW; LORIS, SC; Owner: J.A.R.C. BROADCASTING, INC.)
Strongest FM radio stations in North Myrtle Beach:
WEZV (105.9 FM; NORTH MYRTLE BEACH, SC; Owner: FIDELITY BROADCASTING CORPORATION)
WHQR (91.3 FM; WILMINGTON, NC; Owner: FRIENDS OF PUBLIC RADIO, INC.)
WVCO (94.9 FM; LORIS, SC; Owner: CAROLINA BEACH MUSIC BROADCASTING CORP.)
WYNA (104.9 FM; CALABASH, NC; Owner: COASTLINE COMMUNICATIONS OF CAROLINA INC)
WYAV (104.1 FM; MYRTLE BEACH, SC; Owner: NM LICENSING, LLC)
WKZQ-FM (101.7 FM; MYRTLE BEACH, SC; Owner: NM LICENSING, LLC)
WMYB (92.1 FM; MYRTLE BEACH, SC; Owner: NM LICENSING, LLC)
WGTR (107.9 FM; BUCKSPORT, SC; Owner: QANTUM OF MYRTLE BEACH LICENSE COMPANY, LLC)
WKVC (88.9 FM; NORTH MYRTLE BEACH, SC; Owner: EDUCATIONAL MEDIA FOUNDATION)
WYEZ (94.5 FM; MURRELLS INLET, SC; Owner: FIDELITY BROADCASTING CORPORATION)
WHMC-FM (90.1 FM; CONWAY, SC; Owner: SOUTH CAROLINA EDUCATIONAL TV COMMISSION)
WWXM (97.7 FM; GARDEN CITY, SC; Owner: QANTUM OF MYRTLE BEACH LICENSE COMPANY, LLC)
WEGX (92.9 FM; DILLON, SC; Owner: QANTUM OF FLORENCE LICENSE COMPANY, LLC)
WJXY-FM (93.9 FM; CONWAY, SC; Owner: CUMULUS LICENSING CORP.)
WGNI (102.7 FM; WILMINGTON, NC; Owner: CUMULUS LICENSING CORP.)
WRNN (99.5 FM; SOCASTEE, SC; Owner: NM LICENSING, LLC)
WDAI (98.5 FM; PAWLEYS ISLAND, SC; Owner: CUMULUS LICENSING CORP.)
WDZD (93.5 FM; OCEAN ISLE BEACH, NC; Owner: QANTUM OF MYRTLE BEACH LICENSE COMPANY, LLC)
WYAK-FM (103.1 FM; SURFSIDE BEACH, SC; Owner: CUMULUS LICENSING CORP.)
WMNX (97.3 FM; WILMINGTON, NC; Owner: CUMULUS LICENSING CORP.)
TV broadcast stations around North Myrtle Beach:
WFXB (Channel 43; MYRTLE BEACH, SC; Owner: GE MEDIA, INC.)
W49AN (Channel 49; MYRTLE BEACH, SC; Owner: DOVE BROADCASTING, INC.)
WGSI-CA (Channel 11; MYRTLE BEACH, SC; Owner: BEACH TV OF SOUTH CAROLINA, INC.)
WGSC-CA (Channel 8; MYRTLE BEACH, SC; Owner: BEACH TV OF SOUTH CAROLINA, INC.)
WSFX-TV (Channel 26; WILMINGTON, NC; Owner: SOUTHEASTERN MEDIA HOLDINGS, INC.)
WUNJ-TV (Channel 39; WILMINGTON, NC; Owner: UNIVERSITY OF NORTH CAROLINA)
W34CQ (Channel 34; MYRTLE BEACH, SC; Owner: TRINITY BROADCASTING NETWORK)
WHMC (Channel 23; CONWAY, SC; Owner: SOUTH CAROLINA EDUCATIONAL TV COMMISSION)
WPDE-TV (Channel 15; FLORENCE, SC; Owner: GRAND STRAND COMMUNICATIONS)
WWMB (Channel 21; FLORENCE, SC; Owner: ATLANTIC MEDIA GROUP, INC.)
WBTW (Channel 13; FLORENCE, SC; Owner: MEDIA GENERAL BROADCASTING OF SO. CAROLINA HOLDINGS, INC.)
WECT (Channel 6; WILMINGTON, NC; Owner: RAYCOM AMERICA, INC.)
W47CK (Channel 47; SHALLOTTE, NC; Owner: CAROLINA CHRISTIAN BROADCASTING INC.)
WWSC-LP (Channel 28; MYRTLE BEACH, SC; Owner: WWSC TELEVISION, INC.)
Home Mortgage Disclosure Act Aggregated Statistics For Year 2009(Based on 1 full and 3 partial tracts) A) FHA, FSA/RHS & VA B) Conventional C) Refinancings D) Home Improvement Loans E) Loans on Dwellings For 5+ Families F) Non-occupant Loans on G) Loans On Manufactured Number Average Value Number Average Value Number Average Value Number Average Value Number Average Value Number Average Value Number Average Value
LOANS ORIGINATED 8 $154,748 318 $223,848 510 $225,534 13 $125,658 5 $612,920 552 $221,947 5 $55,872 APPLICATIONS APPROVED, NOT ACCEPTED 0 $0 29 $283,772 40 $219,219 2 $34,760 0 $0 54 $251,257 1 $52,480 APPLICATIONS DENIED 8 $134,030 106 $268,249 297 $241,322 8 $110,490 0 $0 290 $236,431 6 $80,763 APPLICATIONS WITHDRAWN 3 $241,803 64 $279,047 147 $228,863 3 $213,717 0 $0 138 $245,649 0 $0 FILES CLOSED FOR INCOMPLETENESS 1 $128,930 13 $305,025 30 $248,691 0 $0 0 $0 34 $237,339 0 $0
Aggregated Statistics For Year 2008(Based on 1 full and 3 partial tracts) A) FHA, FSA/RHS & VA B) Conventional C) Refinancings D) Home Improvement Loans E) Loans on Dwellings For 5+ Families F) Non-occupant Loans on G) Loans On Manufactured Number Average Value Number Average Value Number Average Value Number Average Value Number Average Value Number Average Value Number Average Value
LOANS ORIGINATED 4 $177,308 376 $229,147 309 $249,914 18 $105,314 7 $686,594 496 $239,307 3 $76,820 APPLICATIONS APPROVED, NOT ACCEPTED 0 $0 34 $261,343 50 $280,990 3 $21,653 0 $0 53 $274,930 0 $0 APPLICATIONS DENIED 2 $177,925 141 $298,429 154 $267,912 9 $68,731 0 $0 196 $286,848 3 $76,387 APPLICATIONS WITHDRAWN 12 $132,524 64 $261,300 92 $262,786 1 $169,320 1 $183,540 97 $255,793 1 $89,660 FILES CLOSED FOR INCOMPLETENESS 2 $186,295 28 $271,188 18 $271,137 1 $269,450 0 $0 24 $283,260 0 $0
Aggregated Statistics For Year 2007(Based on 1 full and 3 partial tracts) B) Conventional C) Refinancings D) Home Improvement Loans E) Loans on Dwellings For 5+ Families F) Non-occupant Loans on G) Loans On Manufactured Number Average Value Number Average Value Number Average Value Number Average Value Number Average Value Number Average Value
LOANS ORIGINATED 777 $285,968 458 $271,265 36 $136,806 2 $727,225 936 $281,969 7 $55,370 APPLICATIONS APPROVED, NOT ACCEPTED 84 $284,599 63 $303,643 3 $149,640 0 $0 97 $288,109 0 $0 APPLICATIONS DENIED 215 $329,816 170 $320,526 14 $176,639 0 $0 257 $310,748 4 $60,060 APPLICATIONS WITHDRAWN 100 $343,431 78 $251,509 5 $163,602 0 $0 114 $308,162 1 $64,830 FILES CLOSED FOR INCOMPLETENESS 27 $375,133 31 $273,785 3 $292,840 0 $0 35 $275,234 1 $95,990
Aggregated Statistics For Year 2006(Based on 1 full and 3 partial tracts) A) FHA, FSA/RHS & VA B) Conventional C) Refinancings D) Home Improvement Loans E) Loans on Dwellings For 5+ Families F) Non-occupant Loans on G) Loans On Manufactured Number Average Value Number Average Value Number Average Value Number Average Value Number Average Value Number Average Value Number Average Value
LOANS ORIGINATED 1 $92,870 1,385 $236,307 452 $257,445 35 $141,244 2 $431,505 1,461 $238,282 10 $58,584 APPLICATIONS APPROVED, NOT ACCEPTED 0 $0 146 $229,864 62 $198,181 4 $154,542 0 $0 150 $227,251 2 $60,680 APPLICATIONS DENIED 0 $0 214 $270,950 154 $248,652 18 $118,324 0 $0 236 $267,612 10 $80,909 APPLICATIONS WITHDRAWN 1 $83,080 184 $241,709 94 $246,479 6 $89,182 0 $0 177 $259,926 1 $83,080 FILES CLOSED FOR INCOMPLETENESS 0 $0 21 $351,906 26 $217,143 1 $40,380 0 $0 23 $350,882 0 $0
Aggregated Statistics For Year 2005(Based on 1 full and 3 partial tracts) A) FHA, FSA/RHS & VA B) Conventional C) Refinancings D) Home Improvement Loans E) Loans on Dwellings For 5+ Families F) Non-occupant Loans on G) Loans On Manufactured Number Average Value Number Average Value Number Average Value Number Average Value Number Average Value Number Average Value Number Average Value
LOANS ORIGINATED 2 $85,425 1,751 $200,590 427 $225,278 27 $164,896 4 $750,660 1,770 $205,496 11 $47,543 APPLICATIONS APPROVED, NOT ACCEPTED 0 $0 170 $212,997 55 $224,708 3 $41,547 0 $0 166 $231,644 1 $24,270 APPLICATIONS DENIED 1 $86,770 264 $215,830 128 $225,728 13 $85,757 0 $0 260 $234,216 7 $63,547 APPLICATIONS WITHDRAWN 0 $0 186 $209,108 74 $194,149 8 $175,505 1 $244,720 178 $218,501 1 $85,270 FILES CLOSED FOR INCOMPLETENESS 0 $0 32 $207,268 43 $181,434 1 $46,760 0 $0 32 $241,295 0 $0
Aggregated Statistics For Year 2004(Based on 1 full and 3 partial tracts) A) FHA, FSA/RHS & VA B) Conventional C) Refinancings D) Home Improvement Loans E) Loans on Dwellings For 5+ Families F) Non-occupant Loans on G) Loans On Manufactured Number Average Value Number Average Value Number Average Value Number Average Value Number Average Value Number Average Value Number Average Value
LOANS ORIGINATED 0 $0 1,056 $172,464 428 $171,689 23 $89,264 3 $272,177 1,118 $170,387 11 $51,991 APPLICATIONS APPROVED, NOT ACCEPTED 0 $0 79 $175,025 37 $127,829 2 $74,985 0 $0 76 $164,144 3 $51,490 APPLICATIONS DENIED 0 $0 135 $207,918 137 $158,382 18 $66,534 0 $0 143 $189,815 8 $59,166 APPLICATIONS WITHDRAWN 1 $54,220 95 $162,337 75 $158,816 5 $30,198 1 $12,240 87 $164,317 2 $26,475 FILES CLOSED FOR INCOMPLETENESS 0 $0 22 $196,360 28 $152,482 0 $0 0 $0 17 $168,837 0 $0
Aggregated Statistics For Year 2003(Based on 1 full and 3 partial tracts) A) FHA, FSA/RHS & VA B) Conventional C) Refinancings D) Home Improvement Loans E) Loans on Dwellings For 5+ Families F) Non-occupant Loans on Number Average Value Number Average Value Number Average Value Number Average Value Number Average Value Number Average Value
LOANS ORIGINATED 3 $96,550 1,110 $143,042 1,250 $137,312 16 $51,448 3 $389,347 1,619 $138,185 APPLICATIONS APPROVED, NOT ACCEPTED 1 $36,090 50 $140,020 97 $136,067 2 $76,650 0 $0 86 $142,058 APPLICATIONS DENIED 0 $0 118 $152,878 181 $135,769 8 $46,431 0 $0 124 $151,263 APPLICATIONS WITHDRAWN 2 $126,060 80 $157,878 122 $146,930 1 $18,510 0 $0 100 $139,201 FILES CLOSED FOR INCOMPLETENESS 0 $0 14 $162,353 27 $144,516 2 $35,040 0 $0 23 $152,633
Aggregated Statistics For Year 2002(Based on 1 full and 3 partial tracts) A) FHA, FSA/RHS & VA B) Conventional C) Refinancings D) Home Improvement Loans E) Loans on Dwellings For 5+ Families F) Non-occupant Loans on Number Average Value Number Average Value Number Average Value Number Average Value Number Average Value Number Average Value
LOANS ORIGINATED 8 $104,970 788 $137,180 750 $139,495 8 $71,835 4 $220,362 1,004 $133,653 APPLICATIONS APPROVED, NOT ACCEPTED 0 $0 53 $137,208 56 $134,375 2 $28,800 0 $0 62 $141,794 APPLICATIONS DENIED 1 $52,150 87 $130,608 141 $132,683 5 $24,810 0 $0 81 $142,039 APPLICATIONS WITHDRAWN 1 $132,470 58 $142,323 107 $146,707 2 $47,995 0 $0 78 $134,307 FILES CLOSED FOR INCOMPLETENESS 1 $191,980 23 $161,426 19 $156,625 0 $0 0 $0 25 $164,528
Aggregated Statistics For Year 2001(Based on 1 full and 3 partial tracts) A) FHA, FSA/RHS & VA B) Conventional C) Refinancings D) Home Improvement Loans E) Loans on Dwellings For 5+ Families F) Non-occupant Loans on Number Average Value Number Average Value Number Average Value Number Average Value Number Average Value Number Average Value
LOANS ORIGINATED 3 $71,930 812 $117,495 585 $132,511 9 $54,929 2 $172,010 905 $121,684 APPLICATIONS APPROVED, NOT ACCEPTED 0 $0 50 $118,323 47 $119,572 1 $25,980 0 $0 46 $131,195 APPLICATIONS DENIED 0 $0 73 $97,115 108 $109,013 5 $47,914 0 $0 50 $119,680 APPLICATIONS WITHDRAWN 1 $75,470 62 $114,399 89 $113,700 3 $19,817 0 $0 73 $120,757 FILES CLOSED FOR INCOMPLETENESS 0 $0 10 $134,414 15 $100,102 0 $0 0 $0 8 $125,198
Aggregated Statistics For Year 2000(Based on 1 full and 3 partial tracts) A) FHA, FSA/RHS & VA B) Conventional C) Refinancings D) Home Improvement Loans E) Loans on Dwellings For 5+ Families F) Non-occupant Loans on Number Average Value Number Average Value Number Average Value Number Average Value Number Average Value Number Average Value
LOANS ORIGINATED 6 $85,957 590 $126,373 139 $115,968 13 $18,557 7 $594,190 460 $122,892 APPLICATIONS APPROVED, NOT ACCEPTED 3 $47,410 42 $109,526 25 $93,067 3 $21,723 0 $0 26 $128,160 APPLICATIONS DENIED 5 $63,916 119 $76,120 74 $88,068 7 $65,519 0 $0 45 $98,085 APPLICATIONS WITHDRAWN 3 $81,113 48 $117,226 38 $88,985 3 $15,160 1 $80,990 33 $105,134 FILES CLOSED FOR INCOMPLETENESS 1 $74,870 12 $128,629 12 $117,556 0 $0 0 $0 7 $155,784
Aggregated Statistics For Year 1999(Based on 1 full and 3 partial tracts) A) FHA, FSA/RHS & VA B) Conventional C) Refinancings D) Home Improvement Loans E) Loans on Dwellings For 5+ Families F) Non-occupant Loans on Number Average Value Number Average Value Number Average Value Number Average Value Number Average Value Number Average Value
LOANS ORIGINATED 9 $113,044 701 $121,053 305 $108,554 10 $37,706 1 $151,960 632 $123,939 APPLICATIONS APPROVED, NOT ACCEPTED 0 $0 68 $87,603 33 $92,102 2 $13,280 0 $0 37 $100,180 APPLICATIONS DENIED 1 $33,630 160 $70,127 73 $90,420 5 $17,072 0 $0 50 $106,138 APPLICATIONS WITHDRAWN 3 $87,900 64 $124,194 46 $89,323 2 $54,765 0 $0 53 $123,088 FILES CLOSED FOR INCOMPLETENESS 0 $0 13 $135,755 8 $164,839 0 $0 0 $0 11 $118,866
Detailed HMDA statistics for the following Tracts:
0402.00
, 0403.00 , 0404.00 , 0405.00
Private Mortgage Insurance Companies Aggregated Statistics For Year 2009(Based on 1 full and 3 partial tracts) A) Conventional B) Refinancings C) Non-occupant Loans on Number Average Value Number Average Value Number Average Value
LOANS ORIGINATED 7 $207,206 3 $317,293 6 $216,687 APPLICATIONS APPROVED, NOT ACCEPTED 5 $225,662 2 $232,435 4 $210,120 APPLICATIONS DENIED 4 $230,425 6 $267,857 6 $252,988 APPLICATIONS WITHDRAWN 3 $199,663 3 $189,143 3 $201,703 FILES CLOSED FOR INCOMPLETENESS 3 $138,677 0 $0 3 $138,677
Aggregated Statistics For Year 2008(Based on 1 full and 3 partial tracts) A) Conventional B) Refinancings C) Non-occupant Loans on D) Loans On Manufactured Number Average Value Number Average Value Number Average Value Number Average Value
LOANS ORIGINATED 69 $222,949 11 $311,140 66 $220,483 1 $174,570 APPLICATIONS APPROVED, NOT ACCEPTED 23 $253,886 5 $174,662 21 $234,513 0 $0 APPLICATIONS DENIED 6 $277,413 2 $291,830 5 $258,284 0 $0 APPLICATIONS WITHDRAWN 3 $241,893 2 $188,485 3 $268,680 0 $0 FILES CLOSED FOR INCOMPLETENESS 0 $0 1 $179,500 1 $179,500 0 $0
Aggregated Statistics For Year 2007(Based on 1 full and 3 partial tracts) A) Conventional B) Refinancings C) Non-occupant Loans on Number Average Value Number Average Value Number Average Value
LOANS ORIGINATED 75 $271,539 20 $263,238 74 $267,098 APPLICATIONS APPROVED, NOT ACCEPTED 14 $282,617 3 $366,007 15 $273,642 APPLICATIONS DENIED 3 $415,287 1 $345,560 4 $397,855 APPLICATIONS WITHDRAWN 7 $248,783 1 $74,640 7 $205,049 FILES CLOSED FOR INCOMPLETENESS 3 $350,210 0 $0 1 $412,300
Aggregated Statistics For Year 2006(Based on 1 full and 3 partial tracts) A) Conventional B) Refinancings C) Non-occupant Loans on Number Average Value Number Average Value Number Average Value
LOANS ORIGINATED 81 $238,224 8 $249,485 68 $243,724 APPLICATIONS APPROVED, NOT ACCEPTED 11 $245,184 3 $153,300 9 $269,083 APPLICATIONS DENIED 3 $409,293 0 $0 3 $409,293 APPLICATIONS WITHDRAWN 10 $211,030 0 $0 7 $237,230 FILES CLOSED FOR INCOMPLETENESS 1 $431,000 0 $0 1 $431,000
Aggregated Statistics For Year 2005(Based on 1 full and 3 partial tracts) A) Conventional B) Refinancings C) Non-occupant Loans on Number Average Value Number Average Value Number Average Value
LOANS ORIGINATED 228 $204,574 14 $234,670 202 $207,194 APPLICATIONS APPROVED, NOT ACCEPTED 28 $193,696 4 $152,798 25 $191,276 APPLICATIONS DENIED 3 $136,093 0 $0 2 $188,540 APPLICATIONS WITHDRAWN 16 $196,024 1 $110,570 11 $185,545 FILES CLOSED FOR INCOMPLETENESS 0 $0 1 $232,580 0 $0
Aggregated Statistics For Year 2004(Based on 1 full and 3 partial tracts) A) Conventional B) Refinancings C) Non-occupant Loans on Number Average Value Number Average Value Number Average Value
LOANS ORIGINATED 142 $161,008 16 $153,735 114 $162,416 APPLICATIONS APPROVED, NOT ACCEPTED 20 $158,158 8 $111,039 20 $143,604 APPLICATIONS DENIED 1 $111,830 1 $41,600 1 $72,940 APPLICATIONS WITHDRAWN 16 $196,263 3 $163,163 9 $170,070 FILES CLOSED FOR INCOMPLETENESS 2 $202,995 0 $0 2 $202,995
Aggregated Statistics For Year 2003(Based on 1 full and 3 partial tracts) A) Conventional B) Refinancings C) Non-occupant Loans on Number Average Value Number Average Value Number Average Value
LOANS ORIGINATED 316 $153,086 125 $146,046 300 $151,231 APPLICATIONS APPROVED, NOT ACCEPTED 35 $151,493 25 $164,411 34 $153,226 APPLICATIONS DENIED 4 $121,470 3 $218,340 5 $153,684 APPLICATIONS WITHDRAWN 13 $154,464 13 $168,028 12 $161,558 FILES CLOSED FOR INCOMPLETENESS 1 $225,580 1 $71,030 1 $71,030
Aggregated Statistics For Year 2002(Based on 1 full and 3 partial tracts) A) Conventional B) Refinancings C) Non-occupant Loans on Number Average Value Number Average Value Number Average Value
LOANS ORIGINATED 257 $141,964 73 $145,734 227 $137,359 APPLICATIONS APPROVED, NOT ACCEPTED 24 $117,672 12 $144,253 22 $115,059 APPLICATIONS DENIED 4 $376,492 1 $180,440 5 $208,344 APPLICATIONS WITHDRAWN 18 $221,119 3 $127,817 11 $142,968 FILES CLOSED FOR INCOMPLETENESS 0 $0 0 $0 0 $0
Aggregated Statistics For Year 2001(Based on 1 full and 3 partial tracts) A) Conventional B) Refinancings C) Non-occupant Loans on Number Average Value Number Average Value Number Average Value
LOANS ORIGINATED 298 $124,124 53 $139,224 243 $121,628 APPLICATIONS APPROVED, NOT ACCEPTED 28 $109,314 8 $141,774 21 $107,676 APPLICATIONS DENIED 4 $133,942 3 $96,747 3 $90,327 APPLICATIONS WITHDRAWN 10 $157,971 2 $171,720 7 $157,216 FILES CLOSED FOR INCOMPLETENESS 2 $99,595 0 $0 2 $99,595
Aggregated Statistics For Year 2000(Based on 1 full and 3 partial tracts) A) Conventional B) Refinancings C) Non-occupant Loans on Number Average Value Number Average Value Number Average Value
LOANS ORIGINATED 152 $134,648 6 $182,150 110 $139,489 APPLICATIONS APPROVED, NOT ACCEPTED 24 $132,249 1 $178,570 16 $127,501 APPLICATIONS DENIED 9 $105,050 2 $217,250 7 $104,959 APPLICATIONS WITHDRAWN 4 $110,080 0 $0 2 $135,620 FILES CLOSED FOR INCOMPLETENESS 2 $204,690 0 $0 2 $204,690
Aggregated Statistics For Year 1999(Based on 1 full and 3 partial tracts) A) Conventional B) Refinancings C) Non-occupant Loans on Number Average Value Number Average Value Number Average Value
LOANS ORIGINATED 140 $124,925 10 $117,317 107 $124,624 APPLICATIONS APPROVED, NOT ACCEPTED 17 $144,436 2 $77,885 9 $130,369 APPLICATIONS DENIED 6 $112,442 2 $130,980 4 $102,522 APPLICATIONS WITHDRAWN 7 $114,849 0 $0 3 $100,100 FILES CLOSED FOR INCOMPLETENESS 1 $165,150 0 $0 1 $109,510
Detailed PMIC statistics for the following Tracts:
0402.00
, 0403.00 , 0404.00 , 0405.00 Fire-safe hotels and motels in North Myrtle Beach, South Carolina:
Cherry Grove Manor, 2104 N Ocean Blvd, North Myrtle Beach, South Carolina 29582 Phone: (843) 249-2731
Hampton Inn-Harborgate, 2112 Little Riv Neck Rd, North Myrtle Beach, South Carolina 29582 Phone: (843) 249-1997, Fax: (843) 249-1998
Rodeway Inn North Myrtle Beach, 1755 Hwy 17 N, North Myrtle Beach, South Carolina 29582 Phone: (843) 249-2490, Fax: (843) 280-5494
Atlantic Breeze Ocean Resort, 1321 S Ocean Blvd, North Myrtle Beach, South Carolina 29582 Phone: (843) 417-1700, Fax: (843) 417-1703
Harbourgate Marina Club, 2100 Sea Mountain Hwy, North Myrtle Beach, South Carolina 29582 Phone: (843) 417-1160, Fax: (843) 417-1161
Bay Watch Resort & Conference Center, 2701 S Ocean Blvd, North Myrtle Beach, South Carolina 29582 Phone: (843) 272-4600, Fax: (843) 272-4440
Avista Resort, 300 N Ocean Blvd, North Myrtle Beach, South Carolina 29582 Phone: (843) 249-2521, Fax: (843) 417-1061
Prince Resort At The Cherry Grove Pier, 3500 N Ocean Blvd, North Myrtle Beach, South Carolina 29582 Phone: (843) 417-1300, Fax: (843) 417-1303
2 other hotels and motels
All 10 fire-safe hotels and motels in North Myrtle Beach, South Carolina
Most common first names in North Myrtle Beach, SC among deceased individuals Name Count Lived (average)
James 103 72.4 years Robert 96 72.1 years William 94 72.4 years John 80 73.5 years Mary 69 77.4 years Charles 46 74.8 years George 43 76.1 years Joseph 31 75.7 years Thomas 30 70.9 years Margaret 27 77.6 years
Most common last names in North Myrtle Beach, SC among deceased individuals Last name Count Lived (average)
Bellamy 49 72.3 years Lewis 37 74.1 years Smith 35 75.0 years Johnson 28 75.0 years Gore 28 72.0 years Williams 24 71.5 years Ward 22 73.0 years Davis 21 76.0 years Brown 20 71.8 years Vereen 19 68.4 years
North Myrtle Beach compared to South Carolina state average:
Median house value above state average. Unemployed percentage significantly below state average. Black race population percentage significantly below state average. Hispanic race population percentage above state average. Median age significantly above state average. Foreign-born population percentage significantly above state average. Length of stay since moving in above state average. House age below state average. Percentage of population with a bachelor's degree or higher above state average. North Myrtle Beach on our top lists :
#16 on the list of "Top 101 cities with the most full-time financial administration workers per 1000 residents (population 5,000+)"
#23 on the list of "Top 101 cities with largest percentage of males in occupations: food preparation and serving related occupations (population 5,000+)"
#27 on the list of "Top 101 cities with the most full-time firefighters per 1000 residents (population 5,000+)"
#29 on the list of "Top 101 cities with the most full-time park and recreation workers per 1000 residents (population 5,000+)"
#36 on the list of "Top 101 cities with the highest number of police officers per 1000 residents (population 5,000+)"
#38 on the list of "Top 101 cities with the highest number of burglaries per 100,000 residents, excludes tourist destinations and others with a lot of outsiders visiting based on city industries data (population 5,000+)"
#39 on the list of "Top 101 cities with the highest number of thefts per 100,000 residents, excludes tourist destinations and others with a lot of outsiders visiting based on city industries data (population 5,000+)"
#53 on the list of "Top 101 cities with largest percentage of males in industries: accommodation and food services (population 5,000+)"
#56 on the list of "Top 101 cities with largest percentage of females in occupations: sales and related occupations (population 5,000+)"
#56 on the list of "Top 100 cities with strongest arts, entertainment, recreation, accommodation and food services industries (pop. 5,000+)"
#73 on the list of "Top 101 cities with the most people born in other U.S. states (population 5,000+)"
#82 on the list of "Top 100 least-safe cities (highest city-data.com crime index) (pop. 5,000+)"
#96 on the list of "Top 101 cities with largest percentage of females in industries: real estate and rental and leasing (population 5,000+)"
#96 on the list of "Top 100 cities with oldest residents (pop. 5,000+)"
#98 on the list of "Top 101 cities with the most local government spending on current operations of parks and recreation per resident (population 10,000+)"
#2 on the list of "Top 101 counties with the highest percentage of residents that smoked 100+ cigarettes in their lives"
#13 on the list of "Top 101 counties with the largest number of people moving in compared to moving out (pop. 50,000+)"
#21 on the list of "Top 101 counties with the lowest percentage of residents that visited a dentist within the past year"
#38 on the list of "Top 101 counties with the highest percentage of residents that drank alcohol in the past 30 days"
#39 on the list of "Top 101 counties with the worst general health status score of residents (1-5), 3 years of data"
Top Patent Applicants
Miles R. Panaro (3)
Debora Ann Villella (1)
Christine Farmer (1)
William C. Reavis (1)
Rebecca Gale Payne (1)
Michael Siniscalchi (1)
Sharon Lynne Smith (1)
James Adam Jones (1)
Richard N. Hartley (1)
George W. Stevens (1)
Total of 11 patent applications in 2008-2024.
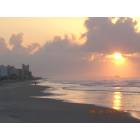

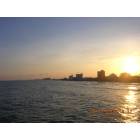
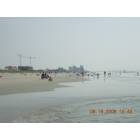
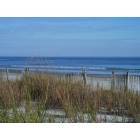

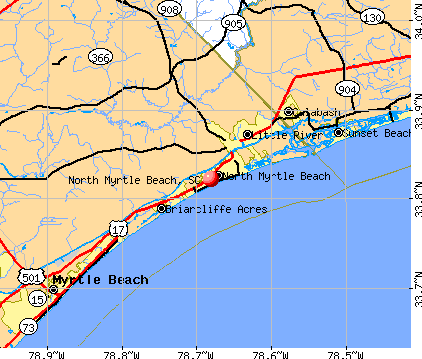


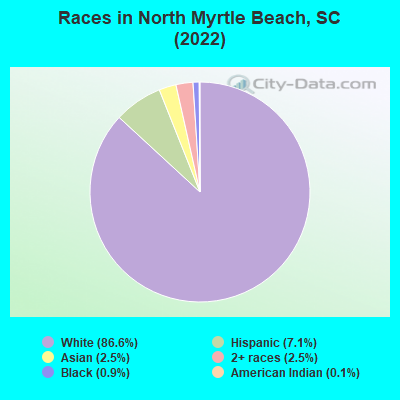
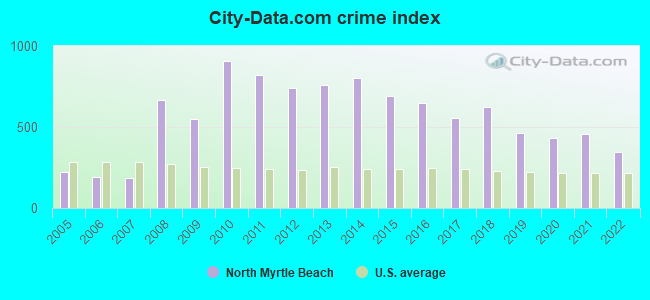
 Recent articles from our blog. Our writers, many of them Ph.D. graduates or candidates, create easy-to-read articles on a wide variety of topics.

 (52.1 miles
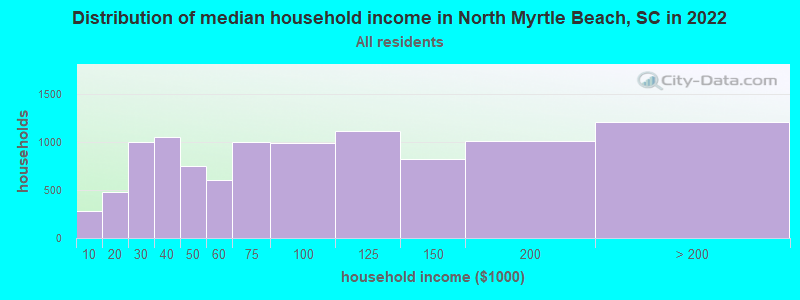
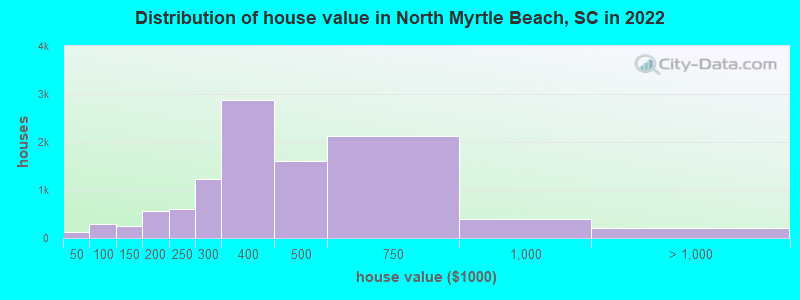
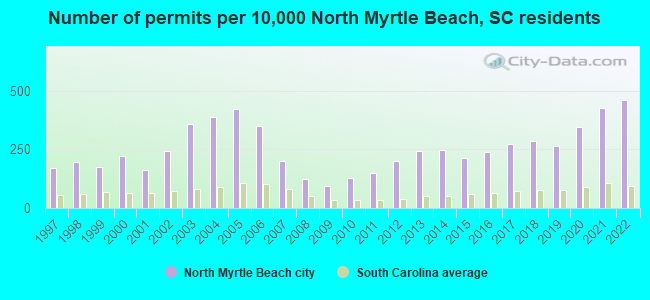
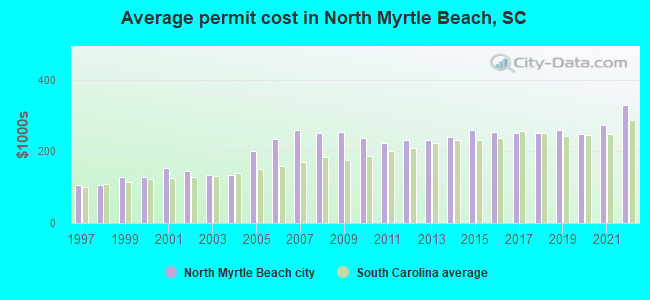
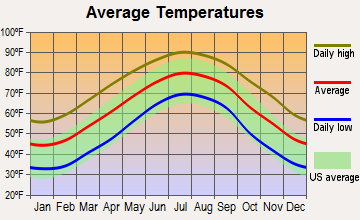
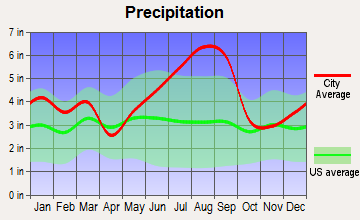
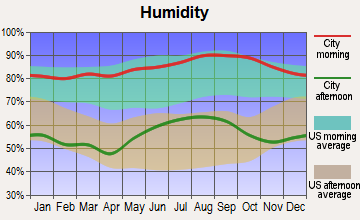
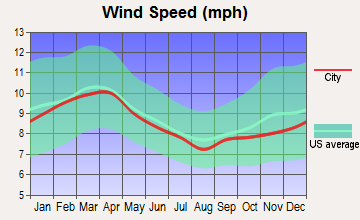
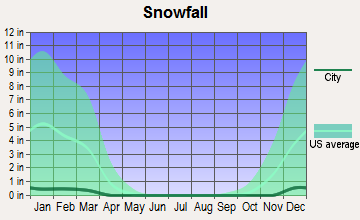
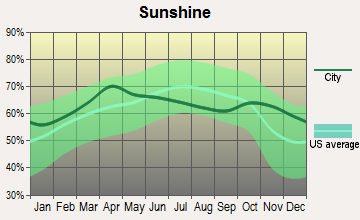
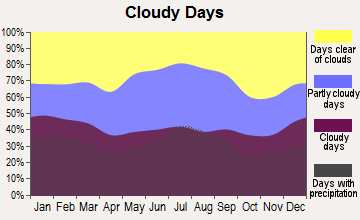
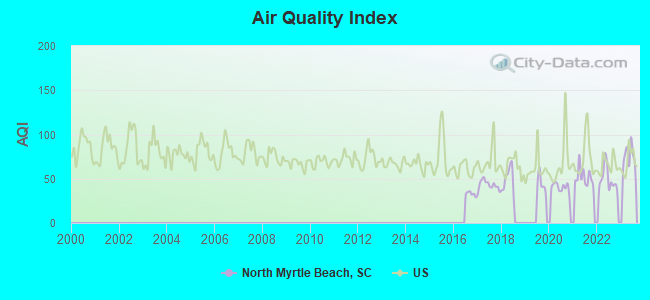
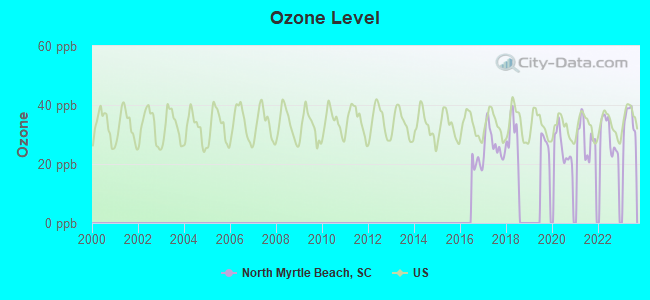
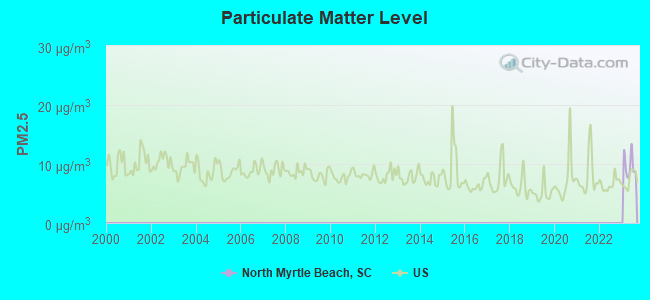
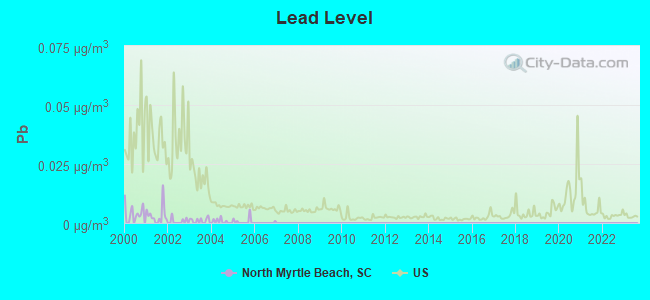

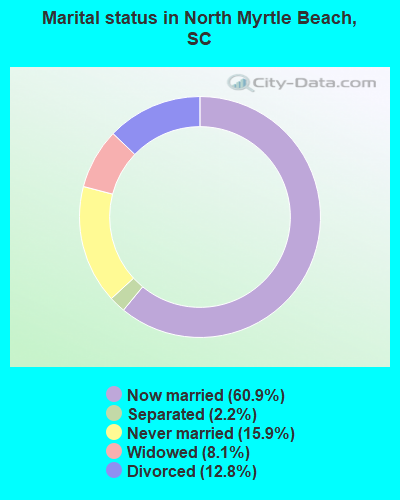
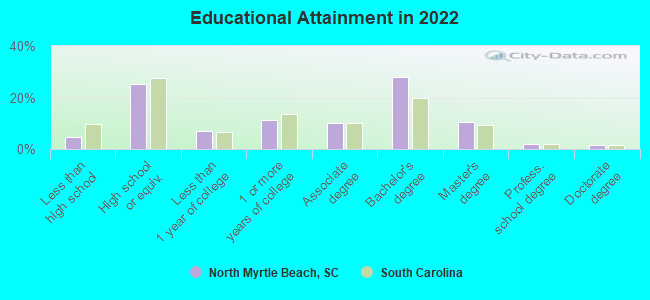
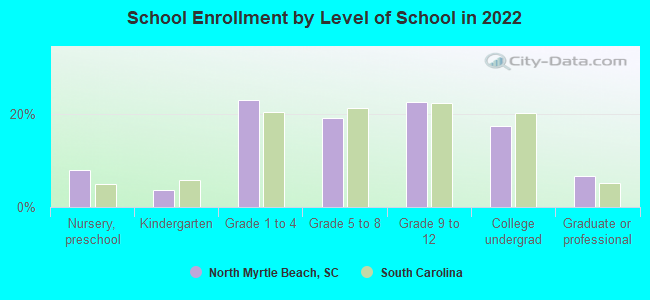
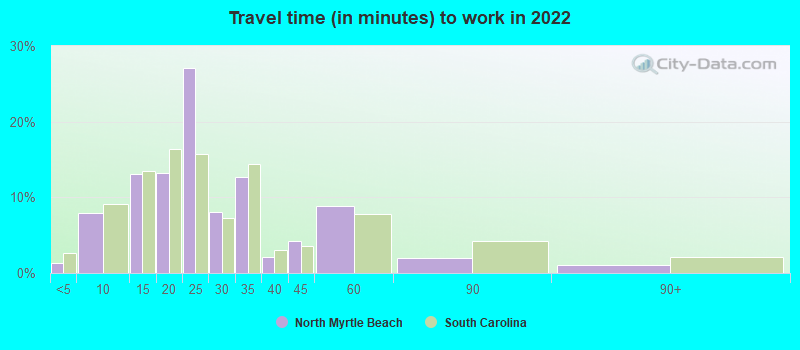
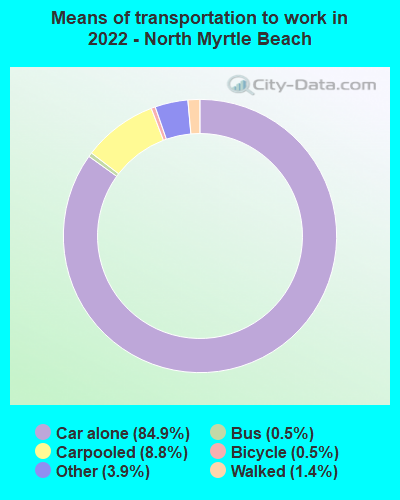
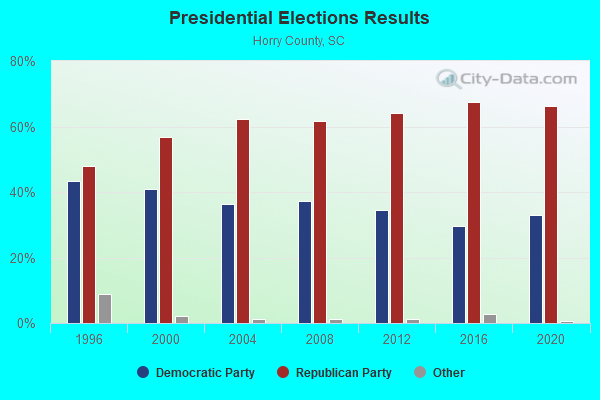
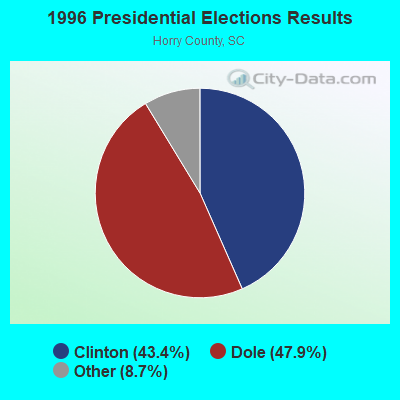
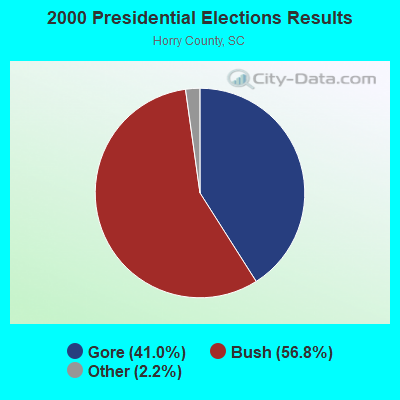
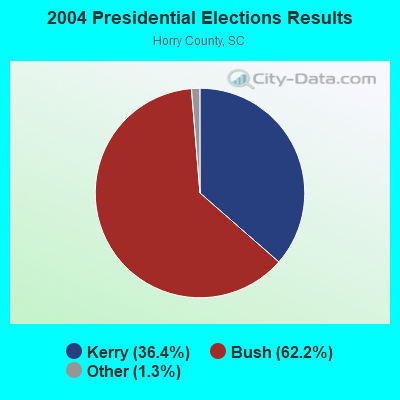
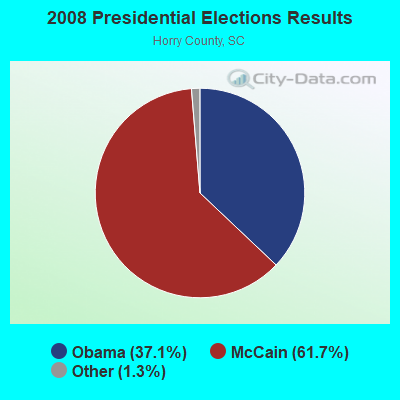

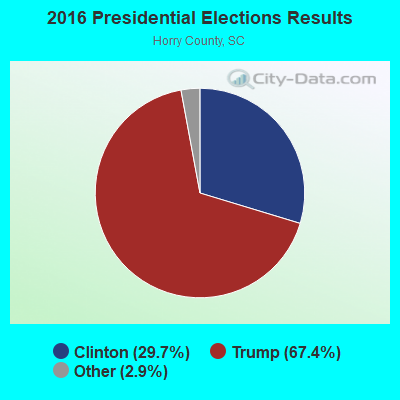
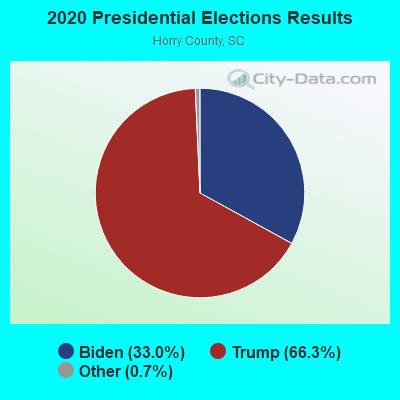
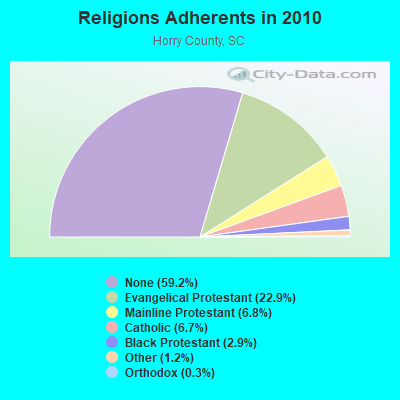
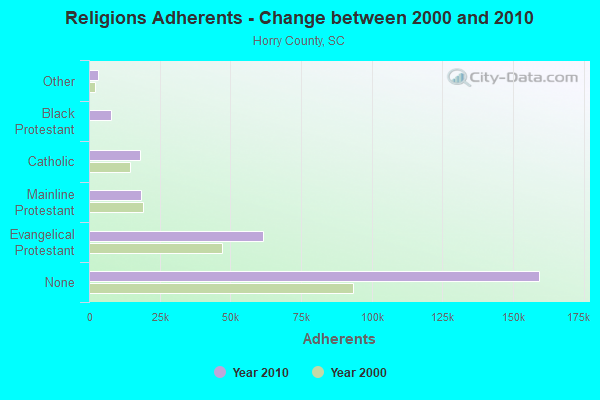
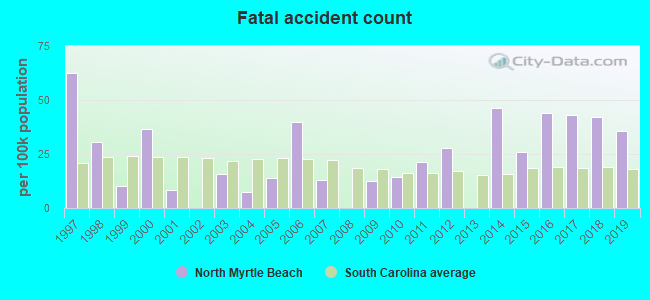
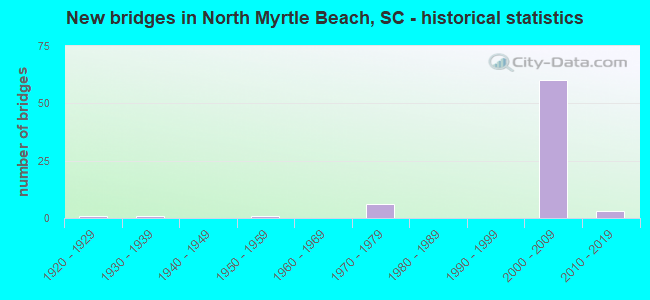
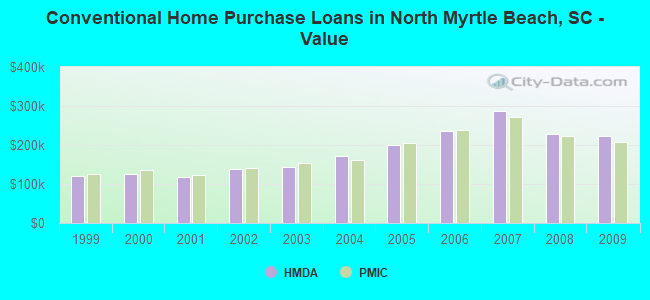
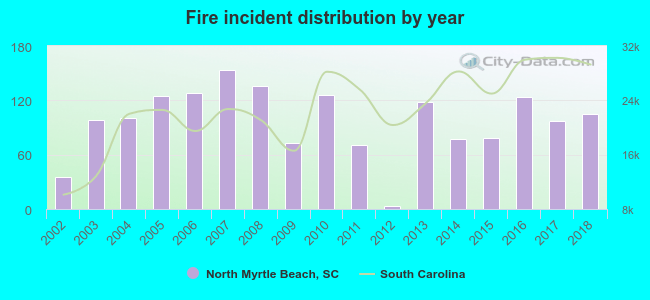 According to the data from the years 2002 - 2018 the average number of fire incidents per year is 97. The highest number of reported fires - 153 took place in 2007, and the least - 3 in 2012. The data has a growing trend.
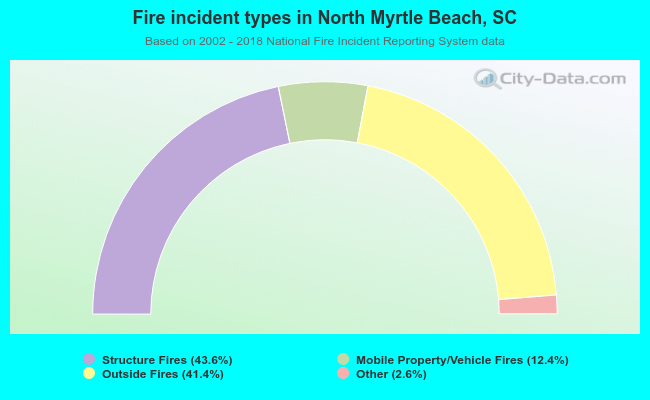 When looking into fire subcategories, the most incidents belonged to: Structure Fires (43.6%), and Outside Fires (41.4%).