Estimated zip code population in 2022: 10,933 Zip code population in 2010: 9,982 Zip code population in 2000: 10,729
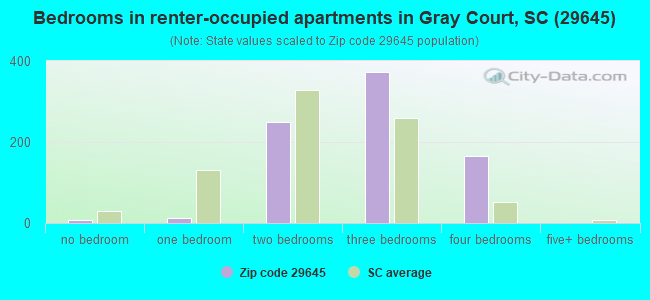
Houses and condos: 5,050 Renter-occupied apartments: 815
% of renters here:
18%
State:
28%
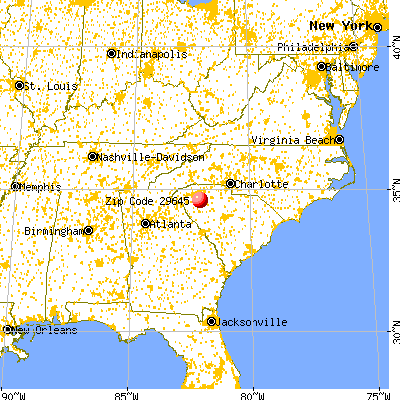
March 2022 cost of living index in zip code 29645: 80.7 (low, U.S. average is 100)
Land area: 107.1 sq. mi. Water area: 0.7 sq. mi.
Population density: 102 people per square mile
(very low).
OSM Map
General Map
Google Map
MSN Map
OSM Map
General Map
Google Map
MSN Map
OSM Map
General Map
Google Map
MSN Map
OSM Map
General Map
Google Map
MSN Map
Please wait while loading the map...
Real estate property taxes paid for housing units in 2022:
This zip code:
0.4% ($631)
South Carolina:
0.5% ($1,185)
Median real estate property taxes paid for housing units with mortgages in 2022: $1,063 (0.4%) Median real estate property taxes paid for housing units with no mortgage in 2022: $457 (0.4%)
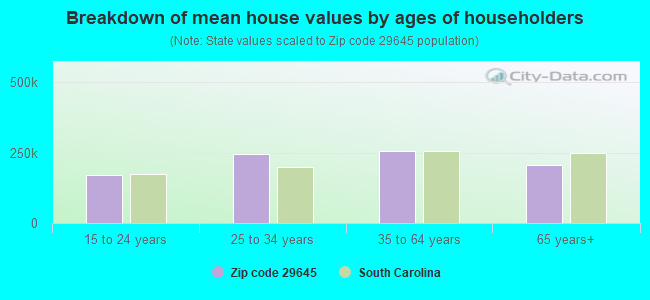
Estimated median house/condo value in 2022: $174,051
29645:
$174,051
South Carolina:
$254,600
According to our research of South Carolina and other state lists, there were 3 registered sex offenders living in 29645 zip code as of April 28, 2024. The ratio of all residents to sex offenders in zip code 29645 is 3,228 to 1. The ratio of registered sex offenders to all residents in this zip code is much lower than the state average.
Median resident age:
This zip code:
44.7 years
South Carolina median age:
40.5 years
Average household size:
This zip code:
2.4 people
South Carolina:
2.4 people
Averages for the 2020 tax year for zip code 29645, filed in 2021:
Average Adjusted Gross Income (AGI) in 2020: $47,897 (Individual Income Tax Returns)
Here:
$47,897
State:
$65,754
Salary/wage: $43,756 (reported on 86.1% of returns)
Here:
$43,756
State:
$52,566
(% of AGI for various income ranges: 1255.5% for AGIs below $25k, 4145.7% for AGIs $25k-50k, 7329.1% for AGIs $50k-75k, 9955.2% for AGIs $75k-100k, 20236.1% for AGIs $100k-200k, 46123.3% for AGIs over 200k)
Taxable interest for individuals: $662 (reported on 14.8% of returns)
This zip code:
$662
South Carolina:
$1,749
(% of AGI for various income ranges: 4.1% for AGIs below $25k, 11.3% for AGIs $25k-50k, 24.9% for AGIs $50k-75k, 16.0% for AGIs $75k-100k, 33.5% for AGIs $100k-200k, 196.7% for AGIs over 200k)
Ordinary dividends: $3,118 (reported on 8.3% of returns)
Here:
$3,118
State:
$8,783
(% of AGI for various income ranges: 8.2% for AGIs below $25k, 22.5% for AGIs $25k-50k, 26.8% for AGIs $50k-75k, 59.2% for AGIs $75k-100k, 134.3% for AGIs $100k-200k, 1040.0% for AGIs over 200k)
Net capital gain/loss in AGI: +$7,900 (reported on 7.3% of returns)
Here:
+$7,900
State:
+$24,194
(% of AGI for various income ranges: 3.8% for AGIs below $25k, 24.0% for AGIs $25k-50k, 59.4% for AGIs $50k-75k, 57.6% for AGIs $75k-100k, 227.4% for AGIs $100k-200k, 5033.3% for AGIs over 200k)
Profit/loss from business: +$5,847 (reported on 14.6% of returns)
Here:
+$5,847
State:
+$11,253
(% of AGI for various income ranges: 108.3% for AGIs below $25k, 70.7% for AGIs $25k-50k, 138.7% for AGIs $50k-75k, 263.2% for AGIs $75k-100k, 240.9% for AGIs $100k-200k)
Taxable individual retirement arrangement distribution: $14,879 (reported on 6.0% of returns)
29645:
$14,879
South Carolina:
$21,604
(% of AGI for various income ranges: 35.4% for AGIs below $25k, 81.5% for AGIs $25k-50k, 159.6% for AGIs $50k-75k, 284.0% for AGIs $75k-100k, 652.6% for AGIs $100k-200k)
Total itemized deductions: $29,994 (reported on 3.7% of returns)
Here:
$29,994
State:
$35,199
(% of AGI for various income ranges: 65.4% for AGIs $25k-50k, 131.3% for AGIs $50k-75k, 253.6% for AGIs $75k-100k, 905.7% for AGIs $100k-200k, 4550.0% for AGIs over 200k)
Charity contributions: $12,587 (reported on 3.1% of returns)
Here:
$12,587
State:
$14,319
(% of AGI for various income ranges: 79.8% for AGIs $50k-75k, 337.0% for AGIs $100k-200k, 2460.0% for AGIs over 200k)
Taxes paid: $6,917 (reported on 3.7% of returns)
29645:
$6,917
State:
$7,486
(% of AGI for various income ranges: 8.3% for AGIs $25k-50k, 30.9% for AGIs $50k-75k, 52.8% for AGIs $75k-100k, 251.7% for AGIs $100k-200k, 1000.0% for AGIs over 200k)
Earned income credit: $2,425 (reported on 23.7% of returns)
Here:
$2,425
State:
$2,397
(% of AGI for various income ranges: 130.3% for AGIs below $25k, 92.7% for AGIs $25k-50k)
Percentage of individuals using paid preparers for their 2020 taxes: 93.1%
Here:
93%
State:
93%
(% for various income ranges: 92.1% for AGIs below $25k, 93.2% for AGIs $25k-50k, 92.9% for AGIs $50k-75k, 97.2% for AGIs $75k-100k, 93.3% for AGIs $100k-200k, 100.0% for AGIs over 200k)
Averages for the 2012 tax year for zip code 29645, filed in 2013:
Average Adjusted Gross Income (AGI) in 2012: $39,087 (Individual Income Tax Returns)
Here:
$39,087
State:
$51,133
Salary/wage: $36,308 (reported on 89.0% of returns)
Here:
$36,308
State:
$42,173
(% of AGI for various income ranges: 81.1% for AGIs below $25k, 88.4% for AGIs $25k-50k, 84.1% for AGIs $50k-75k, 83.7% for AGIs $75k-100k, 83.7% for AGIs $100k-200k, 50.2% for AGIs over 200k)
Taxable interest for individuals: $679 (reported on 16.7% of returns)
This zip code:
$679
South Carolina:
$1,468
(% of AGI for various income ranges: 0.7% for AGIs below $25k, 0.2% for AGIs $25k-50k, 0.2% for AGIs $50k-75k, 0.2% for AGIs $75k-100k, 0.3% for AGIs $100k-200k)
Ordinary dividends: $1,343 (reported on 8.8% of returns)
Here:
$1,343
State:
$6,511
(% of AGI for various income ranges: 0.3% for AGIs below $25k, 0.2% for AGIs $25k-50k, 0.2% for AGIs $50k-75k, 0.4% for AGIs $75k-100k, 0.6% for AGIs $100k-200k)
Net capital gain/loss in AGI: +$5,465 (reported on 6.2% of returns)
Here:
+$5,465
State:
+$13,061
(% of AGI for various income ranges: 0.1% for AGIs $50k-75k, 0.3% for AGIs $75k-100k, 4.6% for AGIs $100k-200k)
Profit/loss from business: +$5,992 (reported on 11.5% of returns)
Here:
+$5,992
State:
+$10,167
(% of AGI for various income ranges: 5.9% for AGIs below $25k, 1.3% for AGIs $25k-50k, 0.8% for AGIs $50k-75k, 1.1% for AGIs $75k-100k, 1.1% for AGIs $100k-200k)
Taxable individual retirement arrangement distribution: $12,043 (reported on 6.7% of returns)
29645:
$12,043
South Carolina:
$17,019
(% of AGI for various income ranges: 2.1% for AGIs below $25k, 1.6% for AGIs $25k-50k, 2.0% for AGIs $50k-75k, 2.1% for AGIs $75k-100k, 3.3% for AGIs $100k-200k)
Total itemized deductions: $18,156 (24% of AGI, reported on 21.0% of returns)
Here:
$18,156
State:
$22,890
Here:
23.8% of AGI
State:
21.4% of AGI
(% of AGI for various income ranges: 5.5% for AGIs below $25k, 7.3% for AGIs $25k-50k, 9.0% for AGIs $50k-75k, 13.4% for AGIs $75k-100k, 14.2% for AGIs $100k-200k, 12.6% for AGIs over 200k)
Charity contributions: $4,593 (reported on 16.5% of returns)
Here:
$4,593
State:
$5,169
(% of AGI for various income ranges: 0.8% for AGIs below $25k, 1.1% for AGIs $25k-50k, 1.7% for AGIs $50k-75k, 3.2% for AGIs $75k-100k, 3.1% for AGIs $100k-200k, 3.2% for AGIs over 200k)
Taxes paid: $5,310 (reported on 21.0% of returns)
29645:
$5,310
State:
$7,644
(% of AGI for various income ranges: 0.7% for AGIs below $25k, 1.4% for AGIs $25k-50k, 2.5% for AGIs $50k-75k, 3.9% for AGIs $75k-100k, 5.5% for AGIs $100k-200k, 6.0% for AGIs over 200k)
Earned income credit: $2,417 (reported on 27.4% of returns)
Here:
$2,417
State:
$2,418
(% of AGI for various income ranges: 8.5% for AGIs below $25k, 1.5% for AGIs $25k-50k)
Percentage of individuals using paid preparers for their 2012 taxes: 56.8%
Here:
57%
State:
57%
(% for various income ranges: 56.9% for AGIs below $25k, 56.7% for AGIs $25k-50k, 57.9% for AGIs $50k-75k, 57.1% for AGIs $75k-100k, 52.2% for AGIs $100k-200k, 66.7% for AGIs over 200k)
Averages for the 2004 tax year for zip code 29645, filed in 2005:
Average Adjusted Gross Income (AGI) in 2004: $33,297 (Individual Income Tax Returns)
Here:
$33,297
State:
$41,965
Salary/wage: $32,172 (reported on 89.3% of returns)
Here:
$32,172
State:
$35,695
(% of AGI for various income ranges: 114.5% for AGIs below $10k, 84.6% for AGIs $10k-25k, 89.6% for AGIs $25k-50k, 88.2% for AGIs $50k-75k, 87.8% for AGIs $75k-100k, 70.3% for AGIs over 100k)
Taxable interest for individuals: $1,046 (reported on 23.9% of returns)
This zip code:
$1,046
South Carolina:
$1,623
(% of AGI for various income ranges: 3.1% for AGIs below $10k, 1.0% for AGIs $10k-25k, 0.6% for AGIs $25k-50k, 0.5% for AGIs $50k-75k, 0.4% for AGIs $75k-100k, 1.3% for AGIs over 100k)
Taxable dividends: $1,449 (reported on 11.1% of returns)
Here:
$1,449
State:
$3,999
(% of AGI for various income ranges: 1.3% for AGIs below $10k, 0.4% for AGIs $10k-25k, 0.4% for AGIs $25k-50k, 0.2% for AGIs $50k-75k, 0.3% for AGIs $75k-100k, 1.5% for AGIs over 100k)
Net capital gain/loss: +$2,956 (reported on 8.4% of returns)
Here:
+$2,956
State:
+$13,100
(% of AGI for various income ranges: -0.8% for AGIs below $10k, 0.1% for AGIs $10k-25k, 0.4% for AGIs $25k-50k, 0.4% for AGIs $50k-75k, 0.9% for AGIs $75k-100k, 3.2% for AGIs over 100k)
Profit/loss from business: +$3,280 (reported on 13.0% of returns)
Here:
+$3,280
State:
+$9,144
(% of AGI for various income ranges: 8.5% for AGIs below $10k, 3.6% for AGIs $10k-25k, 0.9% for AGIs $25k-50k, 0.9% for AGIs $50k-75k, 0.3% for AGIs $75k-100k, -0.0% for AGIs over 100k)
IRA payment deduction: $3,087 (reported on 1.1% of returns)
29645:
$3,087
South Carolina:
$2,972
Total itemized deductions: $15,748 (26% of AGI, reported on 26.0% of returns)
Here:
$15,748
State:
$19,039
Here:
25.8% of AGI
State:
22.8% of AGI
(% of AGI for various income ranges: 4.3% for AGIs below $10k, 7.2% for AGIs $10k-25k, 10.6% for AGIs $25k-50k, 13.9% for AGIs $50k-75k, 15.3% for AGIs $75k-100k, 17.4% for AGIs over 100k)
Charity contributions deductions: $3,613 (6% of AGI, reported on 22.7% of returns)
Here:
$3,613
State:
$4,305
Here:
5.7% of AGI
State:
5.0% of AGI
(% of AGI for various income ranges: 0.4% for AGIs below $10k, 1.1% for AGIs $10k-25k, 1.8% for AGIs $25k-50k, 2.8% for AGIs $50k-75k, 2.9% for AGIs $75k-100k, 4.9% for AGIs over 100k)
Total tax: $3,722 (reported on 68.0% of returns)
29645:
$3,722
State:
$6,497
(% of AGI for various income ranges: 3.6% for AGIs below $10k, 3.2% for AGIs $10k-25k, 5.8% for AGIs $25k-50k, 7.9% for AGIs $50k-75k, 9.7% for AGIs $75k-100k, 15.3% for AGIs over 100k)
Earned income credit: $1,890 (reported on 25.9% of returns)
Here:
$1,890
State:
$1,882
Percentage of individuals using paid preparers for their 2004 taxes: 68.3%
Here:
68%
State:
66%
(% for various income ranges: 62.7% for AGIs below $10k, 74.4% for AGIs $10k-25k, 68.4% for AGIs $25k-50k, 64.3% for AGIs $50k-75k, 61.7% for AGIs $75k-100k, 70.7% for AGIs over 100k)
Likely homosexual households (counted as self-reported same-sex unmarried-partner households)
Lesbian couples: 0.2% of all households
Gay men: 0.1% of all households
Household received Food Stamps/SNAP in the past 12 months: 519 Household did not receive Food Stamps/SNAP in the past 12 months: 3,998
Women who had a birth in the past 12 months: 223 (116 now married, 103 unmarried) Women who did not have a birth in the past 12 months: 2,071 (1,008 now married, 1,068 unmarried)
Housing units in zip code 29645 with a mortgage: 1,495 (18 second mortgage, 18 both second mortgage and home equity loan) Houses without a mortgage: 23
Median monthly owner costs for units with a mortgage: $1,202 Median monthly owner costs for units without a mortgage: $339
Residents with income below the poverty level in 2022:
This zip code:
17.0%
Whole state:
14.0%
Residents with income below 50% of the poverty level in 2022:
This zip code:
9.9%
Whole state:
7.3%
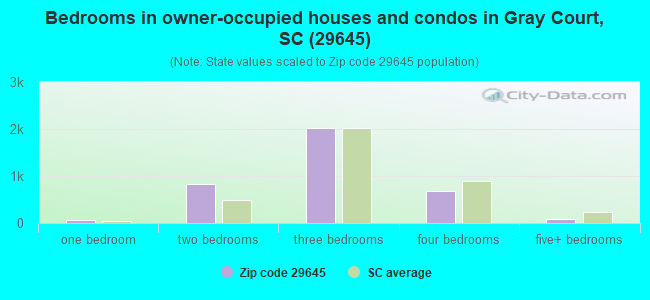
Median number of rooms in houses and condos:
Here:
6.0
State:
6.4
Median number of rooms in apartments:
Here:
5.0
State:
4.5
Notable locations in this zip code not listed on our city pages
Notable locations in zip code 29645: Laurens County Fire Department Youngs Station 2 (A), Laurens County Fire Department Gray Court (B), Laurens County Fire Department Hickory Tavern Station 1 (C). Display/hide their locations on the map
Churches in zip code 29645 include: Mount Carmel Church (A), Campbell Chapel (B), Gray Court Methodist Church (C), Welcome Church (D), Friendship Church (E), Free Will Church (F), Dials Church (G), Center Rabon Church (H), Harris Grove Church (I). Display/hide their locations on the map
Cemeteries: Wrights Cemetery (1), Garrett Cemetery (2), Martin Cemetery (3), Bramlett Cemetery (4), Dials Cemetery (5), Cheek Cemetery (6), Friendship Cemetery (7). Display/hide their locations on the map
Streams, rivers, and creeks: Pumpkin Branch (A), Stoddard Creek (B), South Durbin Creek (C), Reedy Creek (D), Wallace Branch (E), Mountain Creek (F). Display/hide their locations on the map
Size of family households: 1,556 2-persons, 623 3-persons, 517 4-persons, 305 5-persons, 89 6-persons, 48 7-or-more-persons
Size of nonfamily households: 1,065 1-person, 297 2-persons, 17 3-persons
1,564 married couples with children.
475 single-parent households (166 men, 309 women).
91.7% of residents of 29645 zip code speak English at home.
7.1% of residents speak Spanish at home (23% very well, 33% well, 35% not well, 9% not at all).
0.9% of residents speak other Indo-European language at home (100% very well).
0.1% of residents speak other language at home (100% very well).
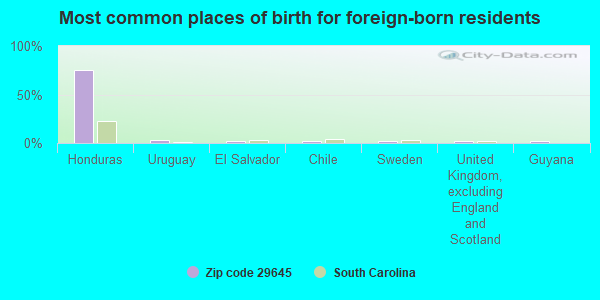
Foreign born population: 537 (4.9%) (16.3% of them are naturalized citizens)
This zip code:
4.9%
Whole state:
5.2%
76%Honduras
3%Uruguay
2%El Salvador
2%Chile
2%Sweden
2%United Kingdom, excluding England and Scotland
2%Guyana
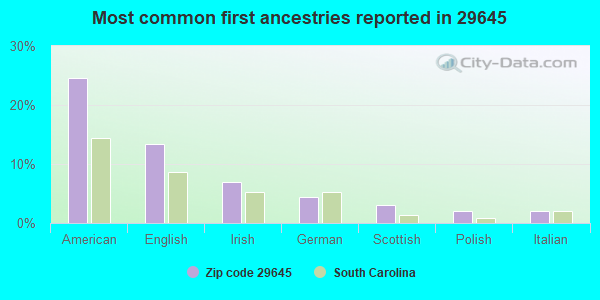
25%American
13%English
7%Irish
4%German
3%Scottish
2%Polish
2%Italian
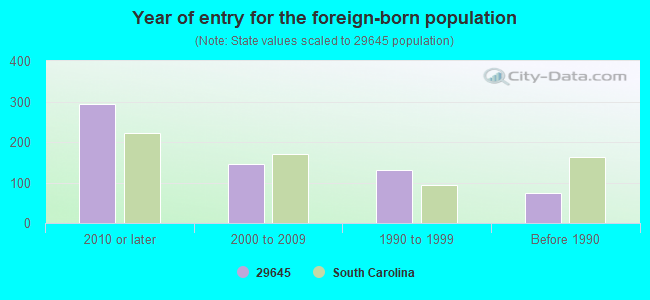
Year of entry for the foreign-born population
2952010 or later
1462000 to 2009
1301990 to 1999
75Before 1990
Facilities with environmental interests located in this zip code:
BBA FIBERWEB (100 ISO PARKWAY in GRAY COURT, SC)
AIR MINOR (AIRS/AFS) National Pollutant Discharge Elimination System NON-MAJOR (Tracking pollutant discharge elimination systems) - permit National Pollutant Discharge Elimination System NON-MAJOR (Tracking pollutant discharge elimination systems) - permit Conditionally Exempt Small Quantity Generators, less than 100 kg/month of hazardous waste (Resource Conservation and Recovery Act (tracking hazardous waste)) - notification STATE MASTER (South Carolina database) - AIR PROGRAM, National Pollutant Discharge Elimination System Permit, HAZARDOUS WASTE PROGRAM, AIR PROGRAM Business SIC classification: NONWOVEN FABRICS Organizations: RMT INC (CONTACT/ENGINEERING/CONSULTING FIRM)
, SUPERIOR NONWOVENS LLC (CONTACT/OWNER)
, BBA FIBERWEB/GRAY COURT (CONTACT/OWNER)
Alternative names: BBA FIBERWEB:GRAY COURT, BBA NONWOVENS, BBA NONWOVENS-GRAY COURT, SUPERIOR NONWOVENS, SUPERIOR NONWOVENS LLC
COOKS GIN #2 (RT 1 in GRAY COURT, SC)
AIR MINOR (AIRS/AFS) STATE MASTER (South Carolina database) - AIR PROGRAM Business SIC classification: COTTON GINNING
F AND R ASPHALT INCORPORATED GRAY COURT (1654 QUARRY ROAD in GRAY COURT, SC)
AIR SYNTHETIC MINOR (AIRS/AFS) STATE MASTER (South Carolina database) - AIR PROGRAM, AIR MAJOR Business SIC classification: ASPHALT PAVING MIXTURES AND BLOCKS Business NAICS classification: ASPHALT PAVING MIXTURE AND BLOCK MANUFACTURING. Organizations: ENVIRONMENTAL PROTECTION ASSOCIATES (CONTACT/ENGINEERING/CONSULTING FIRM)
Alternative names: F & R ASPHALT GRAYCOURT ASPHALT PLANT, REEVES & REEVES INVESTMENT INC
BLYTHE CONSTRUCTION INC (FRONTAGE RD & HWY 101 in GRAY COURT, SC)
Housing units lacking complete plumbing facilities: 3.0% Housing units lacking complete kitchen facilities: 3.4%
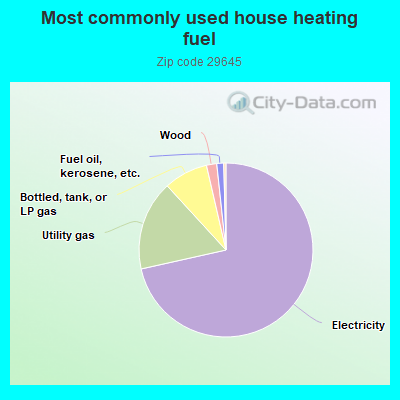
71.5%Electricity
16.7%Utility gas
8.2%Bottled, tank, or LP gas
1.9%Wood
1.3%Fuel oil, kerosene, etc.
Population in 1990: 9,987. Population change in the 1990s: +742 (+7.4%).
Place of birth for U.S.-born residents:
This state: 7,567
Northeast: 754
Midwest: 381
South: 1,201
West: 276
61% of the 29645 zip code residents lived in the same house 5 years ago. Out of people who lived in different houses, 46% lived in this county. Out of people who lived in different counties, 50% lived in South Carolina.
89% of the 29645 zip code residents lived in the same house 1 year ago. Out of people who lived in different houses, 25% moved from this county. Out of people who lived in different houses, 54% moved from different county within same state. Out of people who lived in different houses, 13% moved from different state. Out of people who lived in different houses, 9% moved from abroad.
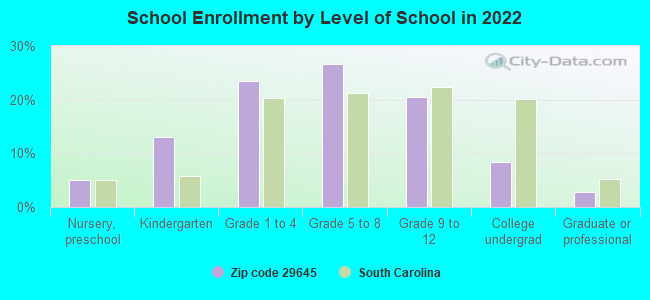
Private vs. public school enrollment:
Students in private schools in grades 1 to 8 (elementary and middle school): 130
Here:
13.3%
South Carolina:
14.4%
Students in private schools in grades 9 to 12 (high school): 102
Here:
25.4%
South Carolina:
11.1%
Students in private undergraduate colleges: 68
Here:
42.1%
South Carolina:
21.9%
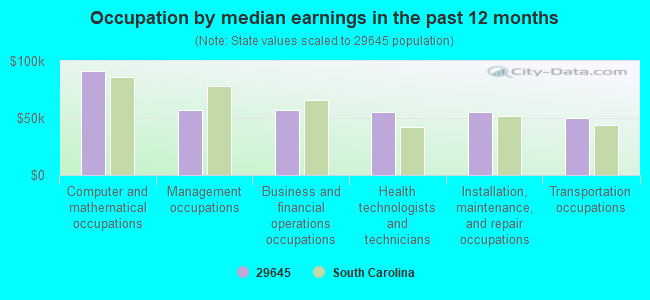
Occupation by median earnings in the past 12 months ($)
91,149Computer and mathematical occupations
57,096Management occupations
56,919Business and financial operations occupations
55,665Health technologists and technicians
55,439Installation, maintenance, and repair occupations
50,069Transportation occupations
Companies with federal contracts located in this zip code:
MPF PRODUCTS INC (3046 BRAMLETT CHURCH RD in GRAY COURT, SC; small business) : $62,702 in 4 contractsfrom 2003 to 2005
$21,560 with Navy for Optical Instruments, Test Equipment, Components and Accessories. Signed on 2005-07-22. Completion date: 2005-10-11.
$15,400, same as above.Signed on 2005-06-23. Completion date: 2005-10-11.
$13,750 with Navy for Fiber Optic Conductors. Signed on 2004-04-27. Completion date: 2004-07-29.
$11,992, same as above.Signed on 2003-09-30. Completion date: 2004-01-30.
PROFESSIONAL READERS SERVICE (697 MAIN ST in GRAY COURT, SC; small business) : $6,244 in 3 contractsfrom 2005 to 2006
$4,708 with Army for Books and Pamphlets. Signed on 2005-01-24. Completion date: 2006-03-31.
$3,122 with Army for Newspapers and Periodicals. Signed on 2006-02-06. Completion date: 2006-04-01.
-$1,586 with Army for Books and Pamphlets. Signed on 2006-06-28. Effective on 2006-05-09. Completion date: 2006-03-31.
Top industries in this zip code by the number of employees in 2005:
Other Services (except Public Administration): Religious Organizations (5-9 employees: 3 establishments, 1-4 employees: 10 establishments)
Construction: Site Preparation Contractors (20-49: 1, 5-9: 1)
Construction: Power and Communication Line and Related Structures Construction (20-49: 1)
Health Care and Social Assistance: Child Day Care Services (20-49: 1)
Construction: Water and Sewer Line and Related Structures Construction (20-49: 1)
Fatal accident statistics in 2014:
Fatal accident count: 3
Vehicles involved in fatal accidents: 3
Fatal accidents caused by drunken drivers: 1
Fatalities: 3
Persons involved in fatal accidents: 3
Pedestrians involved in fatal accidents: 2
Fatal accident statistics in 2012:
Fatal accident count: 4
Vehicles involved in fatal accidents: 5
Fatal accidents caused by drunken drivers: 4
Fatalities: 4
Persons involved in fatal accidents: 5
Pedestrians involved in fatal accidents: 0
Home Mortgage Disclosure Act Aggregated Statistics For Year 2009 (Based on 6 partial tracts)
A) FHA, FSA/RHS & VA Home Purchase Loans
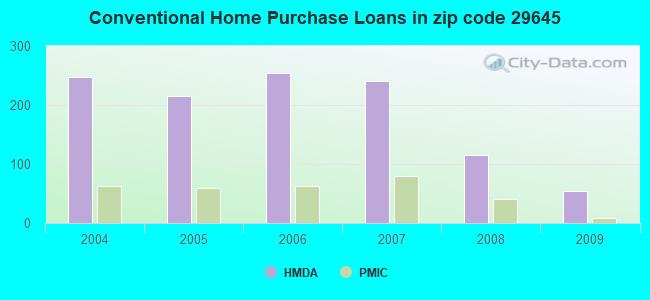
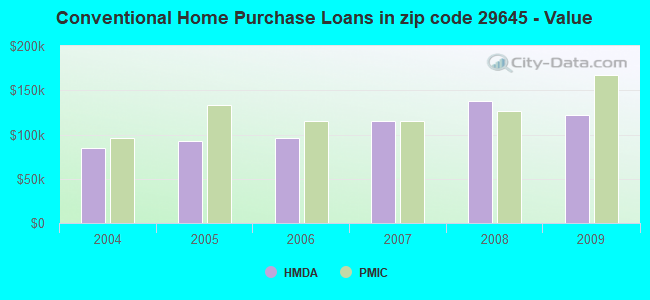
B) Conventional Home Purchase Loans
C) Refinancings
D) Home Improvement Loans
F) Non-occupant Loans on < 5 Family Dwellings (A B C & D)
G) Loans On Manufactured Home Dwelling (A B C & D)
Number
Average Value
Number
Average Value
Number
Average Value
Number
Average Value
Number
Average Value
Number
Average Value
LOANS ORIGINATED
82
$111,176
54
$121,899
233
$139,194
19
$45,285
27
$71,323
45
$58,592
APPLICATIONS APPROVED, NOT ACCEPTED
4
$123,478
7
$84,820
16
$119,934
3
$19,507
3
$81,020
9
$50,651
APPLICATIONS DENIED
19
$123,424
29
$96,661
138
$137,881
17
$51,490
6
$77,387
39
$47,854
APPLICATIONS WITHDRAWN
10
$126,664
8
$163,106
65
$143,228
3
$28,930
5
$62,222
9
$72,006
FILES CLOSED FOR INCOMPLETENESS
5
$107,016
3
$69,863
30
$159,214
3
$45,337
0
$0
3
$65,443
Aggregated Statistics For Year 2008 (Based on 6 partial tracts)
A) FHA, FSA/RHS & VA Home Purchase Loans
B) Conventional Home Purchase Loans
C) Refinancings
D) Home Improvement Loans
F) Non-occupant Loans on < 5 Family Dwellings (A B C & D)
G) Loans On Manufactured Home Dwelling (A B C & D)
Number
Average Value
Number
Average Value
Number
Average Value
Number
Average Value
Number
Average Value
Number
Average Value
LOANS ORIGINATED
75
$106,831
116
$137,351
228
$122,310
22
$84,228
52
$81,567
83
$63,213
APPLICATIONS APPROVED, NOT ACCEPTED
6
$102,960
23
$96,530
38
$142,205
4
$25,442
10
$135,227
23
$58,793
APPLICATIONS DENIED
19
$96,170
40
$110,960
217
$122,913
44
$70,666
25
$145,090
70
$76,923
APPLICATIONS WITHDRAWN
9
$99,617
11
$138,099
79
$140,374
5
$122,460
8
$183,605
12
$71,475
FILES CLOSED FOR INCOMPLETENESS
5
$135,762
5
$95,536
14
$127,207
3
$28,080
4
$101,162
4
$62,505
Aggregated Statistics For Year 2007 (Based on 6 partial tracts)
A) FHA, FSA/RHS & VA Home Purchase Loans
B) Conventional Home Purchase Loans
C) Refinancings
D) Home Improvement Loans
F) Non-occupant Loans on < 5 Family Dwellings (A B C & D)
G) Loans On Manufactured Home Dwelling (A B C & D)
Number
Average Value
Number
Average Value
Number
Average Value
Number
Average Value
Number
Average Value
Number
Average Value
LOANS ORIGINATED
35
$87,991
240
$115,518
228
$115,453
51
$42,080
72
$88,291
105
$64,509
APPLICATIONS APPROVED, NOT ACCEPTED
0
$0
31
$76,604
41
$114,583
9
$22,687
4
$105,630
15
$51,447
APPLICATIONS DENIED
7
$96,709
107
$123,412
257
$110,578
60
$43,618
25
$114,233
98
$55,669
APPLICATIONS WITHDRAWN
5
$141,606
24
$99,855
96
$127,968
10
$81,052
7
$95,994
15
$73,539
FILES CLOSED FOR INCOMPLETENESS
2
$152,645
11
$177,312
19
$140,738
1
$48,580
1
$229,860
1
$94,580
Aggregated Statistics For Year 2006 (Based on 6 partial tracts)
A) FHA, FSA/RHS & VA Home Purchase Loans
B) Conventional Home Purchase Loans
C) Refinancings
D) Home Improvement Loans
E) Loans on Dwellings For 5+ Families
F) Non-occupant Loans on < 5 Family Dwellings (A B C & D)
G) Loans On Manufactured Home Dwelling (A B C & D)
Number
Average Value
Number
Average Value
Number
Average Value
Number
Average Value
Number
Average Value
Number
Average Value
Number
Average Value
LOANS ORIGINATED
47
$99,524
254
$96,436
214
$100,706
73
$41,774
1
$113,730
79
$78,152
119
$62,988
APPLICATIONS APPROVED, NOT ACCEPTED
4
$91,308
51
$79,939
59
$82,542
14
$48,565
0
$0
10
$66,245
43
$55,247
APPLICATIONS DENIED
14
$68,787
112
$67,594
278
$97,661
92
$28,609
0
$0
15
$71,725
158
$62,831
APPLICATIONS WITHDRAWN
1
$158,910
33
$100,728
117
$114,139
19
$60,446
0
$0
3
$69,923
14
$57,926
FILES CLOSED FOR INCOMPLETENESS
0
$0
21
$122,585
39
$108,639
1
$28,260
0
$0
3
$90,177
1
$96,970
Aggregated Statistics For Year 2005 (Based on 6 partial tracts)
A) FHA, FSA/RHS & VA Home Purchase Loans
B) Conventional Home Purchase Loans
C) Refinancings
D) Home Improvement Loans
F) Non-occupant Loans on < 5 Family Dwellings (A B C & D)
G) Loans On Manufactured Home Dwelling (A B C & D)
Number
Average Value
Number
Average Value
Number
Average Value
Number
Average Value
Number
Average Value
Number
Average Value
LOANS ORIGINATED
35
$100,819
216
$92,360
244
$100,660
53
$24,626
56
$84,877
107
$62,311
APPLICATIONS APPROVED, NOT ACCEPTED
0
$0
53
$65,429
55
$106,438
11
$18,936
7
$85,736
39
$50,820
APPLICATIONS DENIED
21
$72,583
158
$69,985
294
$91,201
57
$30,668
20
$59,029
194
$59,222
APPLICATIONS WITHDRAWN
4
$98,500
53
$86,486
139
$105,852
20
$81,714
11
$115,035
39
$63,544
FILES CLOSED FOR INCOMPLETENESS
1
$94,580
9
$91,593
61
$110,917
2
$68,240
4
$95,665
12
$76,820
Aggregated Statistics For Year 2004 (Based on 6 partial tracts)
A) FHA, FSA/RHS & VA Home Purchase Loans
B) Conventional Home Purchase Loans
C) Refinancings
D) Home Improvement Loans
F) Non-occupant Loans on < 5 Family Dwellings (A B C & D)
G) Loans On Manufactured Home Dwelling (A B C & D)
2006 - 2018 National Fire Incident Reporting System (NFIRS) incidents
Based on the data from the years 2006 - 2018 the average number of fires per year is 94. The highest number of fires - 168 took place in 2016, and the least - 24 in 2006. The data has an increasing trend.
When looking into fire subcategories, the most reports belonged to: Outside Fires (47.6%), and Structure Fires (32.7%).
Fire incident types reported to NFIRS in Zip Code 29645


 Nearest zip codes: 29644, 29360, 29680, 29388, 29692, 29681.


 Based on the data from the years 2006 - 2018 the average number of fires per year is 94. The highest number of fires - 168 took place in 2016, and the least - 24 in 2006. The data has an increasing trend.
 When looking into fire subcategories, the most reports belonged to: Outside Fires (47.6%), and Structure Fires (32.7%).