Estimated zip code population in 2022: 34,686
Zip code population in 2010: 27,285
Zip code population in 2000: 20,044
Houses and condos: 13,651
Renter-occupied apartments: 2,995
% of renters here:
22%State:
28%
March 2022 cost of living index in zip code 29680: 86.9
(less than average, U.S. average is 100)
Land area: 31.0
sq. mi.
Water area: 0.4
sq. mi.
Population density: 1,118 people per square mile (low).
OSM Map
General Map
Google Map
MSN Map
OSM Map
General Map
Google Map
MSN Map
OSM Map
General Map
Google Map
MSN Map
OSM Map
General Map
Google Map
MSN Map
Please wait while loading the map...
Real estate property taxes paid for housing units in 2022:
This zip code:
0.5% ($1,388)South Carolina:
0.5% ($1,185)
Median real estate property taxes paid for housing units with mortgages in 2022: $1,447 (0.5%)
Median real estate property taxes paid for housing units with no mortgage in 2022: $1,254 (0.4%)
Profiles of local businesses
Business Search - 14 Million verified businesses
Males: 16,566 Females: 18,122
For population 25 years and over in 29680:
High school or higher: 96.6%Bachelor's degree or higher: 40.1%Graduate or professional degree: 15.8%Unemployed: 2.1%Mean travel time to work (commute): 23.5 minutes
For population 15 years and over in 29680:
Never married: 27.6%Now married: 59.0%Separated: 0.9%Widowed: 4.1%Divorced: 8.5%
Zip code 29680 compared to state average:
Unemployed percentage below state average. Length of stay since moving in above state average. House age below state average. 21,007 60.6% White 8,691 25.1% Black 2,630 7.6% Hispanic or Latino 1,632 4.7% Two or more races 402 1.2% Some other race 306 0.9% Asian 16 0.05% American Indian
Data:
Median household income ($)
Median household income (% change since 2000)
Household income diversity
Ratio of average income to average house value (%)
Ratio of average income to average rent
Median household income ($) - White
Median household income ($) - Black or African American
Median household income ($) - Asian
Median household income ($) - Hispanic or Latino
Median household income ($) - American Indian and Alaska Native
Median household income ($) - Multirace
Median household income ($) - Other Race
Median household income for houses/condos with a mortgage ($)
Median household income for apartments without a mortgage ($)
Races - White alone (%)
Races - White alone (% change since 2000)
Races - Black alone (%)
Races - Black alone (% change since 2000)
Races - American Indian alone (%)
Races - American Indian alone (% change since 2000)
Races - Asian alone (%)
Races - Asian alone (% change since 2000)
Races - Hispanic (%)
Races - Hispanic (% change since 2000)
Races - Native Hawaiian and Other Pacific Islander alone (%)
Races - Native Hawaiian and Other Pacific Islander alone (% change since 2000)
Races - Two or more races (%)
Races - Two or more races (% change since 2000)
Races - Other race alone (%)
Races - Other race alone (% change since 2000)
Racial diversity
Unemployment (%)
Unemployment (% change since 2000)
Unemployment (%) - White
Unemployment (%) - Black or African American
Unemployment (%) - Asian
Unemployment (%) - Hispanic or Latino
Unemployment (%) - American Indian and Alaska Native
Unemployment (%) - Multirace
Unemployment (%) - Other Race
Population density (people per square mile)
Population - Males (%)
Population - Females (%)
Population - Males (%) - White
Population - Males (%) - Black or African American
Population - Males (%) - Asian
Population - Males (%) - Hispanic or Latino
Population - Males (%) - American Indian and Alaska Native
Population - Males (%) - Multirace
Population - Males (%) - Other Race
Population - Females (%) - White
Population - Females (%) - Black or African American
Population - Females (%) - Asian
Population - Females (%) - Hispanic or Latino
Population - Females (%) - American Indian and Alaska Native
Population - Females (%) - Multirace
Population - Females (%) - Other Race
Coronavirus confirmed cases (Apr 27, 2024)
Deaths caused by coronavirus (Apr 27, 2024)
Coronavirus confirmed cases (per 100k population) (Apr 27, 2024)
Deaths caused by coronavirus (per 100k population) (Apr 27, 2024)
Daily increase in number of cases (Apr 27, 2024)
Weekly increase in number of cases (Apr 27, 2024)
Cases doubled (in days) (Apr 27, 2024)
Hospitalized patients (Apr 18, 2022)
Negative test results (Apr 18, 2022)
Total test results (Apr 18, 2022)
COVID Vaccine doses distributed (per 100k population) (Sep 19, 2023)
COVID Vaccine doses administered (per 100k population) (Sep 19, 2023)
COVID Vaccine doses distributed (Sep 19, 2023)
COVID Vaccine doses administered (Sep 19, 2023)
Likely homosexual households (%)
Likely homosexual households (% change since 2000)
Likely homosexual households - Lesbian couples (%)
Likely homosexual households - Lesbian couples (% change since 2000)
Likely homosexual households - Gay men (%)
Likely homosexual households - Gay men (% change since 2000)
Cost of living index
Median gross rent ($)
Median contract rent ($)
Median monthly housing costs ($)
Median house or condo value ($)
Median house or condo value ($ change since 2000)
Mean house or condo value by units in structure - 1, detached ($)
Mean house or condo value by units in structure - 1, attached ($)
Mean house or condo value by units in structure - 2 ($)
Mean house or condo value by units in structure by units in structure - 3 or 4 ($)
Mean house or condo value by units in structure - 5 or more ($)
Mean house or condo value by units in structure - Boat, RV, van, etc. ($)
Mean house or condo value by units in structure - Mobile home ($)
Median house or condo value ($) - White
Median house or condo value ($) - Black or African American
Median house or condo value ($) - Asian
Median house or condo value ($) - Hispanic or Latino
Median house or condo value ($) - American Indian and Alaska Native
Median house or condo value ($) - Multirace
Median house or condo value ($) - Other Race
Median resident age
Resident age diversity
Median resident age - Males
Median resident age - Females
Median resident age - White
Median resident age - Black or African American
Median resident age - Asian
Median resident age - Hispanic or Latino
Median resident age - American Indian and Alaska Native
Median resident age - Multirace
Median resident age - Other Race
Median resident age - Males - White
Median resident age - Males - Black or African American
Median resident age - Males - Asian
Median resident age - Males - Hispanic or Latino
Median resident age - Males - American Indian and Alaska Native
Median resident age - Males - Multirace
Median resident age - Males - Other Race
Median resident age - Females - White
Median resident age - Females - Black or African American
Median resident age - Females - Asian
Median resident age - Females - Hispanic or Latino
Median resident age - Females - American Indian and Alaska Native
Median resident age - Females - Multirace
Median resident age - Females - Other Race
Commute - mean travel time to work (minutes)
Travel time to work - Less than 5 minutes (%)
Travel time to work - Less than 5 minutes (% change since 2000)
Travel time to work - 5 to 9 minutes (%)
Travel time to work - 5 to 9 minutes (% change since 2000)
Travel time to work - 10 to 19 minutes (%)
Travel time to work - 10 to 19 minutes (% change since 2000)
Travel time to work - 20 to 29 minutes (%)
Travel time to work - 20 to 29 minutes (% change since 2000)
Travel time to work - 30 to 39 minutes (%)
Travel time to work - 30 to 39 minutes (% change since 2000)
Travel time to work - 40 to 59 minutes (%)
Travel time to work - 40 to 59 minutes (% change since 2000)
Travel time to work - 60 to 89 minutes (%)
Travel time to work - 60 to 89 minutes (% change since 2000)
Travel time to work - 90 or more minutes (%)
Travel time to work - 90 or more minutes (% change since 2000)
Marital status - Never married (%)
Marital status - Now married (%)
Marital status - Separated (%)
Marital status - Widowed (%)
Marital status - Divorced (%)
Median family income ($)
Median family income (% change since 2000)
Median non-family income ($)
Median non-family income (% change since 2000)
Median per capita income ($)
Median per capita income (% change since 2000)
Median family income ($) - White
Median family income ($) - Black or African American
Median family income ($) - Asian
Median family income ($) - Hispanic or Latino
Median family income ($) - American Indian and Alaska Native
Median family income ($) - Multirace
Median family income ($) - Other Race
Median year house/condo built
Median year apartment built
Year house built - Built 2005 or later (%)
Year house built - Built 2000 to 2004 (%)
Year house built - Built 1990 to 1999 (%)
Year house built - Built 1980 to 1989 (%)
Year house built - Built 1970 to 1979 (%)
Year house built - Built 1960 to 1969 (%)
Year house built - Built 1950 to 1959 (%)
Year house built - Built 1940 to 1949 (%)
Year house built - Built 1939 or earlier (%)
Average household size
Household density (households per square mile)
Average household size - White
Average household size - Black or African American
Average household size - Asian
Average household size - Hispanic or Latino
Average household size - American Indian and Alaska Native
Average household size - Multirace
Average household size - Other Race
Occupied housing units (%)
Vacant housing units (%)
Owner occupied housing units (%)
Renter occupied housing units (%)
Vacancy status - For rent (%)
Vacancy status - For sale only (%)
Vacancy status - Rented or sold, not occupied (%)
Vacancy status - For seasonal, recreational, or occasional use (%)
Vacancy status - For migrant workers (%)
Vacancy status - Other vacant (%)
Residents with income below the poverty level (%)
Residents with income below 50% of the poverty level (%)
Children below poverty level (%)
Poor families by family type - Married-couple family (%)
Poor families by family type - Male, no wife present (%)
Poor families by family type - Female, no husband present (%)
Poverty status for native-born residents (%)
Poverty status for foreign-born residents (%)
Poverty among high school graduates not in families (%)
Poverty among people who did not graduate high school not in families (%)
Residents with income below the poverty level (%) - White
Residents with income below the poverty level (%) - Black or African American
Residents with income below the poverty level (%) - Asian
Residents with income below the poverty level (%) - Hispanic or Latino
Residents with income below the poverty level (%) - American Indian and Alaska Native
Residents with income below the poverty level (%) - Multirace
Residents with income below the poverty level (%) - Other Race
Air pollution - Air Quality Index (AQI)
Air pollution - CO
Air pollution - NO2
Air pollution - SO2
Air pollution - Ozone
Air pollution - PM10
Air pollution - PM25
Air pollution - Pb
Crime - Murders per 100,000 population
Crime - Rapes per 100,000 population
Crime - Robberies per 100,000 population
Crime - Assaults per 100,000 population
Crime - Burglaries per 100,000 population
Crime - Thefts per 100,000 population
Crime - Auto thefts per 100,000 population
Crime - Arson per 100,000 population
Crime - City-data.com crime index
Crime - Violent crime index
Crime - Property crime index
Crime - Murders per 100,000 population (5 year average)
Crime - Rapes per 100,000 population (5 year average)
Crime - Robberies per 100,000 population (5 year average)
Crime - Assaults per 100,000 population (5 year average)
Crime - Burglaries per 100,000 population (5 year average)
Crime - Thefts per 100,000 population (5 year average)
Crime - Auto thefts per 100,000 population (5 year average)
Crime - Arson per 100,000 population (5 year average)
Crime - City-data.com crime index (5 year average)
Crime - Violent crime index (5 year average)
Crime - Property crime index (5 year average)
1996 Presidential Elections Results (%) - Democratic Party (Clinton)
1996 Presidential Elections Results (%) - Republican Party (Dole)
1996 Presidential Elections Results (%) - Other
2000 Presidential Elections Results (%) - Democratic Party (Gore)
2000 Presidential Elections Results (%) - Republican Party (Bush)
2000 Presidential Elections Results (%) - Other
2004 Presidential Elections Results (%) - Democratic Party (Kerry)
2004 Presidential Elections Results (%) - Republican Party (Bush)
2004 Presidential Elections Results (%) - Other
2008 Presidential Elections Results (%) - Democratic Party (Obama)
2008 Presidential Elections Results (%) - Republican Party (McCain)
2008 Presidential Elections Results (%) - Other
2012 Presidential Elections Results (%) - Democratic Party (Obama)
2012 Presidential Elections Results (%) - Republican Party (Romney)
2012 Presidential Elections Results (%) - Other
2016 Presidential Elections Results (%) - Democratic Party (Clinton)
2016 Presidential Elections Results (%) - Republican Party (Trump)
2016 Presidential Elections Results (%) - Other
2020 Presidential Elections Results (%) - Democratic Party (Biden)
2020 Presidential Elections Results (%) - Republican Party (Trump)
2020 Presidential Elections Results (%) - Other
Ancestries Reported - Arab (%)
Ancestries Reported - Czech (%)
Ancestries Reported - Danish (%)
Ancestries Reported - Dutch (%)
Ancestries Reported - English (%)
Ancestries Reported - French (%)
Ancestries Reported - French Canadian (%)
Ancestries Reported - German (%)
Ancestries Reported - Greek (%)
Ancestries Reported - Hungarian (%)
Ancestries Reported - Irish (%)
Ancestries Reported - Italian (%)
Ancestries Reported - Lithuanian (%)
Ancestries Reported - Norwegian (%)
Ancestries Reported - Polish (%)
Ancestries Reported - Portuguese (%)
Ancestries Reported - Russian (%)
Ancestries Reported - Scotch-Irish (%)
Ancestries Reported - Scottish (%)
Ancestries Reported - Slovak (%)
Ancestries Reported - Subsaharan African (%)
Ancestries Reported - Swedish (%)
Ancestries Reported - Swiss (%)
Ancestries Reported - Ukrainian (%)
Ancestries Reported - United States (%)
Ancestries Reported - Welsh (%)
Ancestries Reported - West Indian (%)
Ancestries Reported - Other (%)
Educational Attainment - No schooling completed (%)
Educational Attainment - Less than high school (%)
Educational Attainment - High school or equivalent (%)
Educational Attainment - Less than 1 year of college (%)
Educational Attainment - 1 or more years of college (%)
Educational Attainment - Associate degree (%)
Educational Attainment - Bachelor's degree (%)
Educational Attainment - Master's degree (%)
Educational Attainment - Professional school degree (%)
Educational Attainment - Doctorate degree (%)
School Enrollment - Nursery, preschool (%)
School Enrollment - Kindergarten (%)
School Enrollment - Grade 1 to 4 (%)
School Enrollment - Grade 5 to 8 (%)
School Enrollment - Grade 9 to 12 (%)
School Enrollment - College undergrad (%)
School Enrollment - Graduate or professional (%)
School Enrollment - Not enrolled in school (%)
School enrollment - Public schools (%)
School enrollment - Private schools (%)
School enrollment - Not enrolled (%)
Median number of rooms in houses and condos
Median number of rooms in apartments
Housing units lacking complete plumbing facilities (%)
Housing units lacking complete kitchen facilities (%)
Density of houses
Urban houses (%)
Rural houses (%)
Households with people 60 years and over (%)
Households with people 65 years and over (%)
Households with people 75 years and over (%)
Households with one or more nonrelatives (%)
Households with no nonrelatives (%)
Population in households (%)
Family households (%)
Nonfamily households (%)
Population in families (%)
Family households with own children (%)
Median number of bedrooms in owner occupied houses
Mean number of bedrooms in owner occupied houses
Median number of bedrooms in renter occupied houses
Mean number of bedrooms in renter occupied houses
Median number of vehichles in owner occupied houses
Mean number of vehichles in owner occupied houses
Median number of vehichles in renter occupied houses
Mean number of vehichles in renter occupied houses
Mortgage status - with mortgage (%)
Mortgage status - with second mortgage (%)
Mortgage status - with home equity loan (%)
Mortgage status - with both second mortgage and home equity loan (%)
Mortgage status - without a mortgage (%)
Average family size
Average family size - White
Average family size - Black or African American
Average family size - Asian
Average family size - Hispanic or Latino
Average family size - American Indian and Alaska Native
Average family size - Multirace
Average family size - Other Race
Geographical mobility - Same house 1 year ago (%)
Geographical mobility - Moved within same county (%)
Geographical mobility - Moved from different county within same state (%)
Geographical mobility - Moved from different state (%)
Geographical mobility - Moved from abroad (%)
Place of birth - Born in state of residence (%)
Place of birth - Born in other state (%)
Place of birth - Native, outside of US (%)
Place of birth - Foreign born (%)
Housing units in structures - 1, detached (%)
Housing units in structures - 1, attached (%)
Housing units in structures - 2 (%)
Housing units in structures - 3 or 4 (%)
Housing units in structures - 5 to 9 (%)
Housing units in structures - 10 to 19 (%)
Housing units in structures - 20 to 49 (%)
Housing units in structures - 50 or more (%)
Housing units in structures - Mobile home (%)
Housing units in structures - Boat, RV, van, etc. (%)
House/condo owner moved in on average (years ago)
Renter moved in on average (years ago)
Year householder moved into unit - Moved in 1999 to March 2000 (%)
Year householder moved into unit - Moved in 1995 to 1998 (%)
Year householder moved into unit - Moved in 1990 to 1994 (%)
Year householder moved into unit - Moved in 1980 to 1989 (%)
Year householder moved into unit - Moved in 1970 to 1979 (%)
Year householder moved into unit - Moved in 1969 or earlier (%)
Means of transportation to work - Drove car alone (%)
Means of transportation to work - Carpooled (%)
Means of transportation to work - Public transportation (%)
Means of transportation to work - Bus or trolley bus (%)
Means of transportation to work - Streetcar or trolley car (%)
Means of transportation to work - Subway or elevated (%)
Means of transportation to work - Railroad (%)
Means of transportation to work - Ferryboat (%)
Means of transportation to work - Taxicab (%)
Means of transportation to work - Motorcycle (%)
Means of transportation to work - Bicycle (%)
Means of transportation to work - Walked (%)
Means of transportation to work - Other means (%)
Working at home (%)
Industry diversity
Most Common Industries - Agriculture, forestry, fishing and hunting, and mining (%)
Most Common Industries - Agriculture, forestry, fishing and hunting (%)
Most Common Industries - Mining, quarrying, and oil and gas extraction (%)
Most Common Industries - Construction (%)
Most Common Industries - Manufacturing (%)
Most Common Industries - Wholesale trade (%)
Most Common Industries - Retail trade (%)
Most Common Industries - Transportation and warehousing, and utilities (%)
Most Common Industries - Transportation and warehousing (%)
Most Common Industries - Utilities (%)
Most Common Industries - Information (%)
Most Common Industries - Finance and insurance, and real estate and rental and leasing (%)
Most Common Industries - Finance and insurance (%)
Most Common Industries - Real estate and rental and leasing (%)
Most Common Industries - Professional, scientific, and management, and administrative and waste management services (%)
Most Common Industries - Professional, scientific, and technical services (%)
Most Common Industries - Management of companies and enterprises (%)
Most Common Industries - Administrative and support and waste management services (%)
Most Common Industries - Educational services, and health care and social assistance (%)
Most Common Industries - Educational services (%)
Most Common Industries - Health care and social assistance (%)
Most Common Industries - Arts, entertainment, and recreation, and accommodation and food services (%)
Most Common Industries - Arts, entertainment, and recreation (%)
Most Common Industries - Accommodation and food services (%)
Most Common Industries - Other services, except public administration (%)
Most Common Industries - Public administration (%)
Occupation diversity
Most Common Occupations - Management, business, science, and arts occupations (%)
Most Common Occupations - Management, business, and financial occupations (%)
Most Common Occupations - Management occupations (%)
Most Common Occupations - Business and financial operations occupations (%)
Most Common Occupations - Computer, engineering, and science occupations (%)
Most Common Occupations - Computer and mathematical occupations (%)
Most Common Occupations - Architecture and engineering occupations (%)
Most Common Occupations - Life, physical, and social science occupations (%)
Most Common Occupations - Education, legal, community service, arts, and media occupations (%)
Most Common Occupations - Community and social service occupations (%)
Most Common Occupations - Legal occupations (%)
Most Common Occupations - Education, training, and library occupations (%)
Most Common Occupations - Arts, design, entertainment, sports, and media occupations (%)
Most Common Occupations - Healthcare practitioners and technical occupations (%)
Most Common Occupations - Health diagnosing and treating practitioners and other technical occupations (%)
Most Common Occupations - Health technologists and technicians (%)
Most Common Occupations - Service occupations (%)
Most Common Occupations - Healthcare support occupations (%)
Most Common Occupations - Protective service occupations (%)
Most Common Occupations - Fire fighting and prevention, and other protective service workers including supervisors (%)
Most Common Occupations - Law enforcement workers including supervisors (%)
Most Common Occupations - Food preparation and serving related occupations (%)
Most Common Occupations - Building and grounds cleaning and maintenance occupations (%)
Most Common Occupations - Personal care and service occupations (%)
Most Common Occupations - Sales and office occupations (%)
Most Common Occupations - Sales and related occupations (%)
Most Common Occupations - Office and administrative support occupations (%)
Most Common Occupations - Natural resources, construction, and maintenance occupations (%)
Most Common Occupations - Farming, fishing, and forestry occupations (%)
Most Common Occupations - Construction and extraction occupations (%)
Most Common Occupations - Installation, maintenance, and repair occupations (%)
Most Common Occupations - Production, transportation, and material moving occupations (%)
Most Common Occupations - Production occupations (%)
Most Common Occupations - Transportation occupations (%)
Most Common Occupations - Material moving occupations (%)
People in Group quarters - Institutionalized population (%)
People in Group quarters - Correctional institutions (%)
People in Group quarters - Federal prisons and detention centers (%)
People in Group quarters - Halfway houses (%)
People in Group quarters - Local jails and other confinement facilities (including police lockups) (%)
People in Group quarters - Military disciplinary barracks (%)
People in Group quarters - State prisons (%)
People in Group quarters - Other types of correctional institutions (%)
People in Group quarters - Nursing homes (%)
People in Group quarters - Hospitals/wards, hospices, and schools for the handicapped (%)
People in Group quarters - Hospitals/wards and hospices for chronically ill (%)
People in Group quarters - Hospices or homes for chronically ill (%)
People in Group quarters - Military hospitals or wards for chronically ill (%)
People in Group quarters - Other hospitals or wards for chronically ill (%)
People in Group quarters - Hospitals or wards for drug/alcohol abuse (%)
People in Group quarters - Mental (Psychiatric) hospitals or wards (%)
People in Group quarters - Schools, hospitals, or wards for the mentally retarded (%)
People in Group quarters - Schools, hospitals, or wards for the physically handicapped (%)
People in Group quarters - Institutions for the deaf (%)
People in Group quarters - Institutions for the blind (%)
People in Group quarters - Orthopedic wards and institutions for the physically handicapped (%)
People in Group quarters - Wards in general hospitals for patients who have no usual home elsewhere (%)
People in Group quarters - Wards in military hospitals for patients who have no usual home elsewhere (%)
People in Group quarters - Juvenile institutions (%)
People in Group quarters - Long-term care (%)
People in Group quarters - Homes for abused, dependent, and neglected children (%)
People in Group quarters - Residential treatment centers for emotionally disturbed children (%)
People in Group quarters - Training schools for juvenile delinquents (%)
People in Group quarters - Short-term care, detention or diagnostic centers for delinquent children (%)
People in Group quarters - Type of juvenile institution unknown (%)
People in Group quarters - Noninstitutionalized population (%)
People in Group quarters - College dormitories (includes college quarters off campus) (%)
People in Group quarters - Military quarters (%)
People in Group quarters - On base (%)
People in Group quarters - Barracks, unaccompanied personnel housing (UPH), (Enlisted/Officer), ;and similar group living quarters for military personnel (%)
People in Group quarters - Transient quarters for temporary residents (%)
People in Group quarters - Military ships (%)
People in Group quarters - Group homes (%)
People in Group quarters - Homes or halfway houses for drug/alcohol abuse (%)
People in Group quarters - Homes for the mentally ill (%)
People in Group quarters - Homes for the mentally retarded (%)
People in Group quarters - Homes for the physically handicapped (%)
People in Group quarters - Other group homes (%)
People in Group quarters - Religious group quarters (%)
People in Group quarters - Dormitories (%)
People in Group quarters - Agriculture workers' dormitories on farms (%)
People in Group quarters - Job Corps and vocational training facilities (%)
People in Group quarters - Other workers' dormitories (%)
People in Group quarters - Crews of maritime vessels (%)
People in Group quarters - Other nonhousehold living situations (%)
People in Group quarters - Other noninstitutional group quarters (%)
Residents speaking English at home (%)
Residents speaking English at home - Born in the United States (%)
Residents speaking English at home - Native, born elsewhere (%)
Residents speaking English at home - Foreign born (%)
Residents speaking Spanish at home (%)
Residents speaking Spanish at home - Born in the United States (%)
Residents speaking Spanish at home - Native, born elsewhere (%)
Residents speaking Spanish at home - Foreign born (%)
Residents speaking other language at home (%)
Residents speaking other language at home - Born in the United States (%)
Residents speaking other language at home - Native, born elsewhere (%)
Residents speaking other language at home - Foreign born (%)
Class of Workers - Employee of private company (%)
Class of Workers - Self-employed in own incorporated business (%)
Class of Workers - Private not-for-profit wage and salary workers (%)
Class of Workers - Local government workers (%)
Class of Workers - State government workers (%)
Class of Workers - Federal government workers (%)
Class of Workers - Self-employed workers in own not incorporated business and Unpaid family workers (%)
House heating fuel used in houses and condos - Utility gas (%)
House heating fuel used in houses and condos - Bottled, tank, or LP gas (%)
House heating fuel used in houses and condos - Electricity (%)
House heating fuel used in houses and condos - Fuel oil, kerosene, etc. (%)
House heating fuel used in houses and condos - Coal or coke (%)
House heating fuel used in houses and condos - Wood (%)
House heating fuel used in houses and condos - Solar energy (%)
House heating fuel used in houses and condos - Other fuel (%)
House heating fuel used in houses and condos - No fuel used (%)
House heating fuel used in apartments - Utility gas (%)
House heating fuel used in apartments - Bottled, tank, or LP gas (%)
House heating fuel used in apartments - Electricity (%)
House heating fuel used in apartments - Fuel oil, kerosene, etc. (%)
House heating fuel used in apartments - Coal or coke (%)
House heating fuel used in apartments - Wood (%)
House heating fuel used in apartments - Solar energy (%)
House heating fuel used in apartments - Other fuel (%)
House heating fuel used in apartments - No fuel used (%)
Armed forces status - In Armed Forces (%)
Armed forces status - Civilian (%)
Armed forces status - Civilian - Veteran (%)
Armed forces status - Civilian - Nonveteran (%)
Fatal accidents locations in years 2005-2021
Fatal accidents locations in 2005
Fatal accidents locations in 2006
Fatal accidents locations in 2007
Fatal accidents locations in 2008
Fatal accidents locations in 2009
Fatal accidents locations in 2010
Fatal accidents locations in 2011
Fatal accidents locations in 2012
Fatal accidents locations in 2013
Fatal accidents locations in 2014
Fatal accidents locations in 2015
Fatal accidents locations in 2016
Fatal accidents locations in 2017
Fatal accidents locations in 2018
Fatal accidents locations in 2019
Fatal accidents locations in 2020
Fatal accidents locations in 2021
Alcohol use - People drinking some alcohol every month (%)
Alcohol use - People not drinking at all (%)
Alcohol use - Average days/month drinking alcohol
Alcohol use - Average drinks/week
Alcohol use - Average days/year people drink much
Audiometry - Average condition of hearing (%)
Audiometry - People that can hear a whisper from across a quiet room (%)
Audiometry - People that can hear normal voice from across a quiet room (%)
Audiometry - Ears ringing, roaring, buzzing (%)
Audiometry - Had a job exposure to loud noise (%)
Audiometry - Had off-work exposure to loud noise (%)
Blood Pressure & Cholesterol - Has high blood pressure (%)
Blood Pressure & Cholesterol - Checking blood pressure at home (%)
Blood Pressure & Cholesterol - Frequently checking blood cholesterol (%)
Blood Pressure & Cholesterol - Has high cholesterol level (%)
Consumer Behavior - Money monthly spent on food at supermarket/grocery store
Consumer Behavior - Money monthly spent on food at other stores
Consumer Behavior - Money monthly spent on eating out
Consumer Behavior - Money monthly spent on carryout/delivered foods
Consumer Behavior - Income spent on food at supermarket/grocery store (%)
Consumer Behavior - Income spent on food at other stores (%)
Consumer Behavior - Income spent on eating out (%)
Consumer Behavior - Income spent on carryout/delivered foods (%)
Current Health Status - General health condition (%)
Current Health Status - Blood donors (%)
Current Health Status - Has blood ever tested for HIV virus (%)
Current Health Status - Left-handed people (%)
Dermatology - People using sunscreen (%)
Diabetes - Diabetics (%)
Diabetes - Had a blood test for high blood sugar (%)
Diabetes - People taking insulin (%)
Diet Behavior & Nutrition - Diet health (%)
Diet Behavior & Nutrition - Milk product consumption (# of products/month)
Diet Behavior & Nutrition - Meals not home prepared (#/week)
Diet Behavior & Nutrition - Meals from fast food or pizza place (#/week)
Diet Behavior & Nutrition - Ready-to-eat foods (#/month)
Diet Behavior & Nutrition - Frozen meals/pizza (#/month)
Drug Use - People that ever used marijuana or hashish (%)
Drug Use - Ever used hard drugs (%)
Drug Use - Ever used any form of cocaine (%)
Drug Use - Ever used heroin (%)
Drug Use - Ever used methamphetamine (%)
Health Insurance - People covered by health insurance (%)
Kidney Conditions-Urology - Avg. # of times urinating at night
Medical Conditions - People with asthma (%)
Medical Conditions - People with anemia (%)
Medical Conditions - People with psoriasis (%)
Medical Conditions - People with overweight (%)
Medical Conditions - Elderly people having difficulties in thinking or remembering (%)
Medical Conditions - People who ever received blood transfusion (%)
Medical Conditions - People having trouble seeing even with glass/contacts (%)
Medical Conditions - People with arthritis (%)
Medical Conditions - People with gout (%)
Medical Conditions - People with congestive heart failure (%)
Medical Conditions - People with coronary heart disease (%)
Medical Conditions - People with angina pectoris (%)
Medical Conditions - People who ever had heart attack (%)
Medical Conditions - People who ever had stroke (%)
Medical Conditions - People with emphysema (%)
Medical Conditions - People with thyroid problem (%)
Medical Conditions - People with chronic bronchitis (%)
Medical Conditions - People with any liver condition (%)
Medical Conditions - People who ever had cancer or malignancy (%)
Mental Health - People who have little interest in doing things (%)
Mental Health - People feeling down, depressed, or hopeless (%)
Mental Health - People who have trouble sleeping or sleeping too much (%)
Mental Health - People feeling tired or having little energy (%)
Mental Health - People with poor appetite or overeating (%)
Mental Health - People feeling bad about themself (%)
Mental Health - People who have trouble concentrating on things (%)
Mental Health - People moving or speaking slowly or too fast (%)
Mental Health - People having thoughts they would be better off dead (%)
Oral Health - Average years since last visit a dentist
Oral Health - People embarrassed because of mouth (%)
Oral Health - People with gum disease (%)
Oral Health - General health of teeth and gums (%)
Oral Health - Average days a week using dental floss/device
Oral Health - Average days a week using mouthwash for dental problem
Oral Health - Average number of teeth
Pesticide Use - Households using pesticides to control insects (%)
Pesticide Use - Households using pesticides to kill weeds (%)
Physical Activity - People doing vigorous-intensity work activities (%)
Physical Activity - People doing moderate-intensity work activities (%)
Physical Activity - People walking or bicycling (%)
Physical Activity - People doing vigorous-intensity recreational activities (%)
Physical Activity - People doing moderate-intensity recreational activities (%)
Physical Activity - Average hours a day doing sedentary activities
Physical Activity - Average hours a day watching TV or videos
Physical Activity - Average hours a day using computer
Physical Functioning - People having limitations keeping them from working (%)
Physical Functioning - People limited in amount of work they can do (%)
Physical Functioning - People that need special equipment to walk (%)
Physical Functioning - People experiencing confusion/memory problems (%)
Physical Functioning - People requiring special healthcare equipment (%)
Prescription Medications - Average number of prescription medicines taking
Preventive Aspirin Use - Adults 40+ taking low-dose aspirin (%)
Reproductive Health - Vaginal deliveries (%)
Reproductive Health - Cesarean deliveries (%)
Reproductive Health - Deliveries resulted in a live birth (%)
Reproductive Health - Pregnancies resulted in a delivery (%)
Reproductive Health - Women breastfeeding newborns (%)
Reproductive Health - Women that had a hysterectomy (%)
Reproductive Health - Women that had both ovaries removed (%)
Reproductive Health - Women that have ever taken birth control pills (%)
Reproductive Health - Women taking birth control pills (%)
Reproductive Health - Women that have ever used Depo-Provera or injectables (%)
Reproductive Health - Women that have ever used female hormones (%)
Sexual Behavior - People 18+ that ever had sex (vaginal, anal, or oral) (%)
Sexual Behavior - Males 18+ that ever had vaginal sex with a woman (%)
Sexual Behavior - Males 18+ that ever performed oral sex on a woman (%)
Sexual Behavior - Males 18+ that ever had anal sex with a woman (%)
Sexual Behavior - Males 18+ that ever had any sex with a man (%)
Sexual Behavior - Females 18+ that ever had vaginal sex with a man (%)
Sexual Behavior - Females 18+ that ever performed oral sex on a man (%)
Sexual Behavior - Females 18+ that ever had anal sex with a man (%)
Sexual Behavior - Females 18+ that ever had any kind of sex with a woman (%)
Sexual Behavior - Average age people first had sex
Sexual Behavior - Average number of female sex partners in lifetime (males 18+)
Sexual Behavior - Average number of female vaginal sex partners in lifetime (males 18+)
Sexual Behavior - Average age people first performed oral sex on a woman (18+)
Sexual Behavior - Average number of woman performed oral sex on in lifetime (18+)
Sexual Behavior - Average number of male sex partners in lifetime (males 18+)
Sexual Behavior - Average number of male anal sex partners in lifetime (males 18+)
Sexual Behavior - Average age people first performed oral sex on a man (18+)
Sexual Behavior - Average number of male oral sex partners in lifetime (18+)
Sexual Behavior - People using protection when performing oral sex (%)
Sexual Behavior - Average number of times people have vaginal or anal sex a year
Sexual Behavior - People having sex without condom (%)
Sexual Behavior - Average number of male sex partners in lifetime (females 18+)
Sexual Behavior - Average number of male vaginal sex partners in lifetime (females 18+)
Sexual Behavior - Average number of female sex partners in lifetime (females 18+)
Sexual Behavior - Circumcised males 18+ (%)
Sleep Disorders - Average hours sleeping at night
Sleep Disorders - People that has trouble sleeping (%)
Smoking-Cigarette Use - People smoking cigarettes (%)
Taste & Smell - People 40+ having problems with smell (%)
Taste & Smell - People 40+ having problems with taste (%)
Taste & Smell - People 40+ that ever had wisdom teeth removed (%)
Taste & Smell - People 40+ that ever had tonsils teeth removed (%)
Taste & Smell - People 40+ that ever had a loss of consciousness because of a head injury (%)
Taste & Smell - People 40+ that ever had a broken nose or other serious injury to face or skull (%)
Taste & Smell - People 40+ that ever had two or more sinus infections (%)
Weight - Average height (inches)
Weight - Average weight (pounds)
Weight - Average BMI
Weight - People that are obese (%)
Weight - People that ever were obese (%)
Weight - People trying to lose weight (%)
Urban population: 29,549
Rural population: 5,136
Estimated median house/condo value in 2022: $301,822
29680:
$301,822South Carolina:
$254,600
According to our research of South Carolina and other state lists, there were 2 registered sex offenders living in 29680 zip code as of April 27, 2024 . The ratio of all residents to sex offenders in zip code 29680 is 15,017 to 1.The ratio of registered sex offenders to all residents in this zip code is much lower than the state average.
Median resident age: This zip code:
37.4 yearsSouth Carolina median age:
40.5 years
Average household size: This zip code:
2.6 peopleSouth Carolina:
2.4 people
Averages for the 2020 tax year for zip code 29680, filed in 2021:
Average Adjusted Gross Income (AGI) in 2020: $64,943 (Individual Income Tax Returns) Here:
$64,943State:
$65,754
Salary/wage: $58,832 (reported on 86.0% of returns )Here:
$58,832State:
$52,566
(% of AGI for various income ranges: 1224.8% for AGIs below $25k , 3951.4% for AGIs $25k-50k , 7084.3% for AGIs $50k-75k , 10067.4% for AGIs $75k-100k , 19587.2% for AGIs $100k-200k , 71879.5% for AGIs over 200k ) Taxable interest for individuals: $944 (reported on 22.8% of returns )This zip code:
$944South Carolina:
$1,749
(% of AGI for various income ranges: 10.1% for AGIs below $25k , 17.1% for AGIs $25k-50k , 22.4% for AGIs $50k-75k , 36.6% for AGIs $75k-100k , 52.5% for AGIs $100k-200k , 584.2% for AGIs over 200k ) Ordinary dividends: $3,353 (reported on 16.5% of returns )(% of AGI for various income ranges: 18.9% for AGIs below $25k , 23.3% for AGIs $25k-50k , 58.0% for AGIs $50k-75k , 72.4% for AGIs $75k-100k , 216.3% for AGIs $100k-200k , 1473.2% for AGIs over 200k ) Net capital gain/loss in AGI: +$11,552 (reported on 14.8% of returns )Here:
+$11,552State:
+$24,194
(% of AGI for various income ranges: 7.8% for AGIs below $25k , 29.9% for AGIs $25k-50k , 55.1% for AGIs $50k-75k , 146.8% for AGIs $75k-100k , 430.3% for AGIs $100k-200k , 10238.9% for AGIs over 200k ) Profit/loss from business: +$7,511 (reported on 16.9% of returns )Here:
+$7,511State:
+$11,253
(% of AGI for various income ranges: 68.7% for AGIs below $25k , 76.3% for AGIs $25k-50k , 183.6% for AGIs $50k-75k , 176.6% for AGIs $75k-100k , 392.6% for AGIs $100k-200k , 2735.3% for AGIs over 200k ) Taxable individual retirement arrangement distribution: $18,596 (reported on 8.6% of returns )29680:
$18,596South Carolina:
$21,604
(% of AGI for various income ranges: 54.4% for AGIs below $25k , 106.7% for AGIs $25k-50k , 192.5% for AGIs $50k-75k , 307.4% for AGIs $75k-100k , 724.3% for AGIs $100k-200k , 1730.5% for AGIs over 200k ) Self-employed (Keogh) retirement plans: $16,067 (reported on 0.2% of returns )29680:
$16,067South Carolina:
$25,038
(% of AGI for various income ranges: 30.3% for AGIs $100k-200k ) Total itemized deductions: $29,437 (reported on 8.2% of returns )Here:
$29,437State:
$35,199
(% of AGI for various income ranges: 32.6% for AGIs below $25k , 121.9% for AGIs $25k-50k , 287.0% for AGIs $50k-75k , 437.4% for AGIs $75k-100k , 1033.2% for AGIs $100k-200k , 5082.1% for AGIs over 200k ) Charity contributions: $10,949 (reported on 6.8% of returns )Here:
$10,949State:
$14,319
(% of AGI for various income ranges: 3.2% for AGIs below $25k , 19.5% for AGIs $25k-50k , 58.6% for AGIs $50k-75k , 124.9% for AGIs $75k-100k , 316.5% for AGIs $100k-200k , 2447.9% for AGIs over 200k ) Taxes paid: $7,193 (reported on 8.2% of returns )(% of AGI for various income ranges: 6.0% for AGIs below $25k , 19.0% for AGIs $25k-50k , 65.2% for AGIs $50k-75k , 112.4% for AGIs $75k-100k , 302.3% for AGIs $100k-200k , 1071.6% for AGIs over 200k ) Earned income credit: $2,213 (reported on 14.2% of returns )(% of AGI for various income ranges: 80.5% for AGIs below $25k , 72.9% for AGIs $25k-50k , 1.7% for AGIs $50k-75k ) Percentage of individuals using paid preparers for their 2020 taxes: 92.8%(% for various income ranges: 90.9% for AGIs below $25k , 93.3% for AGIs $25k-50k , 93.4% for AGIs $50k-75k , 93.4% for AGIs $75k-100k , 93.8% for AGIs $100k-200k , 95.0% for AGIs over 200k )
Averages for the 2012 tax year for zip code 29680, filed in 2013:
Average Adjusted Gross Income (AGI) in 2012: $55,975 (Individual Income Tax Returns) Here:
$55,975State:
$51,133
Salary/wage: $52,844 (reported on 89.2% of returns )Here:
$52,844State:
$42,173
(% of AGI for various income ranges: 80.2% for AGIs below $25k , 84.9% for AGIs $25k-50k , 84.1% for AGIs $50k-75k , 84.8% for AGIs $75k-100k , 85.6% for AGIs $100k-200k , 80.5% for AGIs over 200k ) Taxable interest for individuals: $689 (reported on 27.1% of returns )This zip code:
$689South Carolina:
$1,468
(% of AGI for various income ranges: 0.7% for AGIs below $25k , 0.3% for AGIs $25k-50k , 0.3% for AGIs $50k-75k , 0.3% for AGIs $75k-100k , 0.3% for AGIs $100k-200k , 0.4% for AGIs over 200k ) Ordinary dividends: $2,404 (reported on 17.2% of returns )(% of AGI for various income ranges: 0.9% for AGIs below $25k , 0.5% for AGIs $25k-50k , 0.6% for AGIs $50k-75k , 0.6% for AGIs $75k-100k , 0.8% for AGIs $100k-200k , 1.2% for AGIs over 200k ) Net capital gain/loss in AGI: +$2,970 (reported on 11.9% of returns )Here:
+$2,970State:
+$13,061
(% of AGI for various income ranges: 0.2% for AGIs $50k-75k , 0.2% for AGIs $75k-100k , 0.9% for AGIs $100k-200k , 2.7% for AGIs over 200k ) Profit/loss from business: +$7,445 (reported on 13.9% of returns )Here:
+$7,445State:
+$10,167
(% of AGI for various income ranges: 5.4% for AGIs below $25k , 1.9% for AGIs $25k-50k , 1.7% for AGIs $50k-75k , 1.1% for AGIs $75k-100k , 1.4% for AGIs $100k-200k , 2.3% for AGIs over 200k ) Taxable individual retirement arrangement distribution: $14,145 (reported on 8.7% of returns )29680:
$14,145South Carolina:
$17,019
(% of AGI for various income ranges: 2.9% for AGIs below $25k , 2.5% for AGIs $25k-50k , 2.2% for AGIs $50k-75k , 2.6% for AGIs $75k-100k , 1.9% for AGIs $100k-200k , 1.5% for AGIs over 200k ) Self-employment retirement plans: $17,700 (reported on 0.2% of returns )29680:
$17,700South Carolina:
$21,023
Total itemized deductions: $19,480 (21% of AGI, reported on 40.0% of returns )Here:
$19,480State:
$22,890
Here:
21.0% of AGIState:
21.4% of AGI
(% of AGI for various income ranges: 8.5% for AGIs below $25k , 10.9% for AGIs $25k-50k , 14.1% for AGIs $50k-75k , 15.6% for AGIs $75k-100k , 15.8% for AGIs $100k-200k , 13.2% for AGIs over 200k ) Charity contributions: $4,010 (reported on 33.4% of returns )(% of AGI for various income ranges: 0.9% for AGIs below $25k , 1.6% for AGIs $25k-50k , 2.4% for AGIs $50k-75k , 2.6% for AGIs $75k-100k , 2.9% for AGIs $100k-200k , 2.7% for AGIs over 200k ) Taxes paid: $6,728 (reported on 39.8% of returns )(% of AGI for various income ranges: 1.2% for AGIs below $25k , 2.3% for AGIs $25k-50k , 4.0% for AGIs $50k-75k , 5.1% for AGIs $75k-100k , 6.4% for AGIs $100k-200k , 6.9% for AGIs over 200k ) Earned income credit: $2,204 (reported on 16.5% of returns )(% of AGI for various income ranges: 6.5% for AGIs below $25k , 1.2% for AGIs $25k-50k ) Percentage of individuals using paid preparers for their 2012 taxes: 47.8%(% for various income ranges: 45.2% for AGIs below $25k , 47.9% for AGIs $25k-50k , 51.2% for AGIs $50k-75k , 48.2% for AGIs $75k-100k , 46.7% for AGIs $100k-200k , 66.7% for AGIs over 200k )
Averages for the 2004 tax year for zip code 29680, filed in 2005:
Average Adjusted Gross Income (AGI) in 2004: $48,205 (Individual Income Tax Returns) Here:
$48,205State:
$41,965
Salary/wage: $46,002 (reported on 92.4% of returns )Here:
$46,002State:
$35,695
(% of AGI for various income ranges: 106.0% for AGIs below $10k , 85.1% for AGIs $10k-25k , 88.9% for AGIs $25k-50k , 90.2% for AGIs $50k-75k , 91.6% for AGIs $75k-100k , 83.2% for AGIs over 100k ) Taxable interest for individuals: $655 (reported on 35.9% of returns )This zip code:
$655South Carolina:
$1,623
(% of AGI for various income ranges: 2.6% for AGIs below $10k , 0.8% for AGIs $10k-25k , 0.6% for AGIs $25k-50k , 0.4% for AGIs $50k-75k , 0.2% for AGIs $75k-100k , 0.5% for AGIs over 100k ) Taxable dividends: $1,164 (reported on 20.1% of returns )(% of AGI for various income ranges: 1.1% for AGIs below $10k , 0.6% for AGIs $10k-25k , 0.4% for AGIs $25k-50k , 0.4% for AGIs $50k-75k , 0.4% for AGIs $75k-100k , 0.6% for AGIs over 100k ) Net capital gain/loss: +$4,716 (reported on 14.9% of returns )Here:
+$4,716State:
+$13,100
(% of AGI for various income ranges: -0.3% for AGIs below $10k , 0.4% for AGIs $10k-25k , 0.1% for AGIs $25k-50k , 0.4% for AGIs $50k-75k , 0.5% for AGIs $75k-100k , 4.3% for AGIs over 100k ) Profit/loss from business: +$4,947 (reported on 14.6% of returns )Here:
+$4,947State:
+$9,144
(% of AGI for various income ranges: 2.3% for AGIs below $10k , 3.4% for AGIs $10k-25k , 1.1% for AGIs $25k-50k , 0.9% for AGIs $50k-75k , 1.1% for AGIs $75k-100k , 2.1% for AGIs over 100k ) IRA payment deduction: $2,824 (reported on 2.0% of returns )29680:
$2,824South Carolina:
$2,972
(% of AGI for various income ranges: 0.1% for AGIs $10k-25k , 0.1% for AGIs $25k-50k , 0.1% for AGIs $50k-75k , 0.1% for AGIs $75k-100k , 0.1% for AGIs over 100k ) Self-employed pension: $15,050 (reported on 0.2% of returns )Here:
$15,050South Carolina:
$15,117
Total itemized deductions: $17,210 (23% of AGI, reported on 49.2% of returns )Here:
$17,210State:
$19,039
Here:
23.4% of AGIState:
22.8% of AGI
(% of AGI for various income ranges: 11.3% for AGIs below $10k , 11.7% for AGIs $10k-25k , 16.1% for AGIs $25k-50k , 19.6% for AGIs $50k-75k , 19.9% for AGIs $75k-100k , 16.9% for AGIs over 100k ) Charity contributions deductions: $3,015 (4% of AGI, reported on 44.2% of returns )Here:
4.0% of AGIState:
5.0% of AGI
(% of AGI for various income ranges: 0.8% for AGIs below $10k , 1.7% for AGIs $10k-25k , 2.4% for AGIs $25k-50k , 3.1% for AGIs $50k-75k , 3.0% for AGIs $75k-100k , 3.0% for AGIs over 100k ) Total tax: $5,782 (reported on 78.2% of returns )(% of AGI for various income ranges: 2.6% for AGIs below $10k , 4.1% for AGIs $10k-25k , 6.1% for AGIs $25k-50k , 7.6% for AGIs $50k-75k , 9.2% for AGIs $75k-100k , 15.0% for AGIs over 100k ) Earned income credit: $1,668 (reported on 13.3% of returns )Percentage of individuals using paid preparers for their 2004 taxes: 54.8%(% for various income ranges: 45.9% for AGIs below $10k , 62.6% for AGIs $10k-25k , 58.4% for AGIs $25k-50k , 54.0% for AGIs $50k-75k , 49.1% for AGIs $75k-100k , 52.9% for AGIs over 100k )
Estimated median household income in 2022: This zip code:
$86,575South Carolina:
$64,115
Nearest zip codes: 29662 ,
29644 ,
29681 ,
29605 ,
29669 ,
29607 .
Simpsonville Zip Code Map
Percentage of family households: This zip code:
53.4%South Carolina:
44.7%
Percentage of households with unmarried partners: This zip code:
4.0%South Carolina:
47.7%
Likely homosexual households (counted as self-reported same-sex unmarried-partner households)
Lesbian couples: 0.2% of all households Gay men: 0.2% of all households
Household received Food Stamps/SNAP in the past 12 months: 621Household did not receive Food Stamps/SNAP in the past 12 months: 12,807
Women who had a birth in the past 12 months: 497 (353 now married , 150 unmarried) Women who did not have a birth in the past 12 months: 8,222 (4,453 now married , 3,805 unmarried)
Housing units in zip code 29680 with a mortgage: 7,454 (493
second mortgage , 10
home equity loan , 441
both second mortgage and home equity loan )
Houses without a mortgage: 135
Median monthly owner costs for units with a mortgage: $1,378
Median monthly owner costs for units without a mortgage: $378
Residents with income below the poverty level in 2022:
This zip code:
6.8%Whole state:
14.0%
Residents with income below 50% of the poverty level in 2022:
This zip code:
4.4%Whole state:
7.3%
Median number of rooms in houses and condos: Median number of rooms in apartments: Notable locations in this zip code not listed on our city pages
Click to draw/clear zip code borders Notable locations in zip code 29680: (A) , Givens Youth Correctional Center (B) , South Greenville Fire Department Station 6 (C) , Simpsonville Fire Department Station 4 (D) , Simpsonville Fire Department Station 2 (E) . Display/hide their locations on the map
Churches in zip code 29680 include: (A) , Hopewell Church (B) , Messiah Church (C) , Saint Elizabeth Ann Seton Church (D) , Standing Springs Church (E) , Rocky Creek Church (F) , Reedy Fork Church (G) . Display/hide their locations on the map
Cemeteries: (1) , Harrison Cemetery (2) , Standing Springs Cemetery (3) , Reedy Fork Cemetery (4) , Pisgah Cemetery (5) , Hopewell Cemetery (6) . Display/hide their locations on the map
Reservoirs: (A) , Thads Pond (B) , Goochs Lake (C) , Kelletts Lake (D) , Huff Creek Watershed Lake (E) . Display/hide their locations on the map
Creek: (A) . Display/hide its location on the map
Year house built (houses)
249 2020 or later4,649 2010 to 20192,885 2000 to 20092,778 1990 to 19991,386 1980 to 19891,199 1970 to 1979313 1960 to 1969193 1950 to 195989 1940 to 194958 1939 or earlier
Zip code 29680 household income distribution in 2022 278 Less than $10,000144 $10,000 to $14,999247 $15,000 to $19,999407 $20,000 to $24,999283 $25,000 to $29,999443 $30,000 to $34,999652 $35,000 to $39,999285 $40,000 to $44,999620 $45,000 to $49,999763 $50,000 to $59,9991,412 $60,000 to $74,9992,396 $75,000 to $99,9991,740 $100,000 to $124,9991,244 $125,000 to $149,9991,331 $150,000 to $199,9991,254 $200,000 or moreEstimate of home value of owner-occupied houses/condos in 2022 in zip code 29680 140 Less than $10,00049 $10,000 to $14,99915 $15,000 to $19,99932 $20,000 to $24,99973 $25,000 to $29,99943 $30,000 to $34,99921 $50,000 to $59,99967 $70,000 to $79,99918 $80,000 to $89,99917 $90,000 to $99,999398 $100,000 to $124,999341 $125,000 to $149,999636 $150,000 to $174,999523 $175,000 to $199,9991,915 $200,000 to $249,9992,044 $250,000 to $299,9992,751 $300,000 to $399,999956 $400,000 to $499,999610 $500,000 to $749,99939 $750,000 to $999,99915 $1,000,000 to $1,499,99912 $1,500,000 to $1,999,999105 $2,000,000 or moreRent paid by renters in 2022 in zip code 29680 18 $200 to $24938 $450 to $49933 $550 to $59926 $650 to $69961 $700 to $749158 $750 to $799120 $800 to $899341 $900 to $999840 $1,000 to $1,249526 $1,250 to $1,499804 $1,500 to $1,99999 $2,000 to $2,49911 $3,500 or more96 No cash rent
Median gross rent in 2022: $1,356.
Median price asked for vacant for-sale houses and condos in 2022: $438,856.
Estimated median house (or condo) value in 2022 for: White Non-Hispanic householders: $316,687Black or African American householders: $280,851Asian householders: $354,913Some other race householders: $335,535Two or more races householders: $271,294Hispanic or Latino householders: $298,636Estimated median house or condo value in 2022: $301,822
29680:
$301,822South Carolina:
$254,600
Lower value quartile - upper value quartile: $228,588 - $385,895
Mean price in 2022: Detached houses: $276,873Here:
$276,873State:
$368,255
Townhouses or other attached units: $61,392Here:
$61,392State:
$292,023
In 5-or-more-unit structures: $440,925Here:
$440,925State:
$326,361
Mobile homes: $57,066Here:
$57,066State:
$102,531
Housing units in structures:
One, detached: 10,588One, attached: 178Two: 1633 or 4: 4655 to 9: 47810 to 19: 33620 to 49: 42150 or more: 274Mobile homes: 777Unemployment : 2.1%
Means of transportation to work in zip code 29680 79.5% 14,674 Drove a car alone4.3% 797 Carpooled0.4% 68 Bus or trolley bus0.3% 57 Taxi0.1% 16 Motorcycle0.3% 48 Walked2.1% 383 Other means13.7% 2,530 Worked at homeTravel time to work (commute) in zip code 29680 207 Less than 5 minutes1,110 5 to 9 minutes1,967 10 to 14 minutes2,555 15 to 19 minutes3,715 20 to 24 minutes1,437 25 to 29 minutes2,779 30 to 34 minutes588 35 to 39 minutes424 40 to 44 minutes704 45 to 59 minutes437 60 to 89 minutes110 90 or more minutes
Percentage of zip code residents living and working in this county: 85.8%
Household type by relationship:
Households: 34,686
Male householders: 6,741 (1,274 living alone ), Female householders: 6,709 (1,761 living alone )7,906 spouses (7,835 opposite-sex spouses ), 815 unmarried partners , (755 opposite-sex unmarried partners ), 10,712 children (10,130 natural , 325 adopted , 246 stepchildren ), 556 grandchildren , 153 brothers or sisters , 314 parents , 15 foster children , 180 other relatives , 606 non-relatives In group quarters: 24 (-1 institutionalized population )
Size of family households: 4,202 2-persons , 2,136 3-persons , 2,031 4-persons , 984 5-persons , 269 6-persons , 71 7-or-more-persons
Size of nonfamily households: 3,035 1-person , 564 2-persons , 85 3-persons , 9 4-persons , 22 5-persons
6,371 married couples with children. single-parent households (477 men , 1,043 women ).
89.9% of residents of 29680 zip code speak English at home. of residents speak Spanish at home (61% very well, 30% well, 7% not well, 3% not at all ).of residents speak other Indo-European language at home (73% very well, 23% well, 4% not at all ).of residents speak Asian or Pacific Island language at home (83% very well, 17% well ).of residents speak other language at home (100% very well ).
Foreign born population: 2,229 (6.4%)
(54.8%
of them are naturalized citizens )
This zip code:
6.4%Whole state:
5.2%
29% Chile 8% Grenada 7% Honduras 5% Sweden 3% Poland 3% United Kingdom, excluding England and Scotland 3% France 13% English 11% American 7% Irish 5% German 3% European 3% Italian 2% Scotch-Irish
Year of entry for the foreign-born population
573 2010 or later 773 2000 to 2009 667 1990 to 1999 490 Before 1990
There are
57 Medical Specialists in Zip Code 29680 .
Facilities with environmental interests located in this zip code:
CENTURY PLASTICS INCORPORATED (849 NEELY FERRY ROAD in SIMPSONVILLE, SC)
AIR MINOR (AIRS/AFS) STATE MASTER (South Carolina database) - AIR PROGRAM, TRI REPORTER (Tracking of toxic chemicals releasing facilities) Business SIC classification: PLASTICS PRODUCTSOrganizations: S&D SYSTEMS (CONTACT/ENGINEERING/CONSULTING FIRM)
ECC CARD CLOTHING INCORPORATED (2902 GRANDVIEW DR in SIMPSONVILLE, SC)
Conditionally Exempt Small Quantity Generators, less than 100 kg/month of hazardous waste (Resource Conservation and Recovery Act (tracking hazardous waste)) STATE MASTER (South Carolina database) - HAZARDOUS WASTE PROGRAM Organizations: BEKAERT CORP (CONTACT/OPERATOR)
, CARCLO ENGINEERING GROUP PLC (CONTACT/OWNER)
Alternative names: ASHWORTH CARD CLOTHING INC
FUFNER TEXTILE CORPORATION (508 W GEORGIA RD in SIMPSONVILLE, SC)
Conditionally Exempt Small Quantity Generators, less than 100 kg/month of hazardous waste (Resource Conservation and Recovery Act (tracking hazardous waste)) - notification STATE MASTER (South Carolina database) - AIR PROGRAM, HAZARDOUS WASTE PROGRAM, Business SIC classification: APPAREL AND ACCESSORIESOrganizations: JOSEF & GEORG KUENER (CONTACT/OWNER)
Alternative names: KUFNER TEXTILE-CLOSD
FORK SHOALS ENERGY LLC (HIGHWAY 418 & WOODSIDE ROAD in SIMPSONVILLE, SC)
AIR MAJOR (AIRS/AFS) STATE MASTER (South Carolina database) - AIR MAJOR Business SIC classification: ELECTRIC SERVICESBusiness NAICS classification: HYDROELECTRIC POWER GENERATION.
COLONIAL PIPELINE/REEDY RIVER (4400 NNW OF HWY 418 in SIMPSONVILLE, SC)
(Integrated Compliance Information System) - ICIS-04-1997-0525, FORMAL ENFORCEMENT ACTION Business SIC classification: REFINED PETROLEUM PIPELINES; PETROLEUM BULK STATIONS AND TERMINALSAlternative names: COLONIAL PIPELINE - REEDY RIVER SPILL
Housing units lacking complete plumbing facilities: 0.2%
Housing units lacking complete kitchen facilities: 0.7%
50.0% Electricity 47.3% Utility gas 1.2% Bottled, tank, or LP gas 1.0% Fuel oil, kerosene, etc.
Place of birth for U.S.-born residents:
This state: 15,384Northeast: 4,822Midwest: 3,687South: 6,983West: 1,458
45% of the 29680 zip code residents lived in the same house 5 years ago.
Out of people who lived in different houses, 53% lived in this county.
Out of people who lived in different counties, 50% lived in South Carolina.
87% of the 29680 zip code residents lived in the same house 1 year ago.
Out of people who lived in different houses, 43% moved from this county.
Out of people who lived in different houses, 16% moved from different county within same state.
Out of people who lived in different houses, 38% moved from different state.
Out of people who lived in different houses, 3% moved from abroad.
Private vs. public school enrollment:
Students in private schools in grades 1 to 8 (elementary and middle school): 823
Here:
20.0%South Carolina:
14.4%
Students in private schools in grades 9 to 12 (high school): 342
Here:
24.9%South Carolina:
11.1%
Students in private undergraduate colleges: 259
Here:
28.1%South Carolina:
21.9%
Occupation by median earnings in the past 12 months ($)
93,810 Architecture and engineering occupations 83,329 Management occupations 82,665 Health diagnosing and treating practitioners and other technical occupations 74,007 Life, physical, and social science occupations 72,664 Legal occupations 65,380 Computer and mathematical occupations
Companies with federal contracts located in this zip code:
SLOAN LAWNCARE & LANDSCAPING I (3 E OKALOOSA WAY in SIMPSONVILLE, SC; small business) in 5 contracts from 2002 to 2005
Contracts for Landscaping/Groundskeeping Services by NavySigned by year: 2000: $0; 2001: $0; 2002: $30,574; 2003: $7,580; 2004: $7,950; 2005: $15,540; 2006: $0.
Biggest contracts: with Navy for Landscaping/Groundskeeping Services. Signed on 2002-09-18. Completion date: 2002-10-31.
, same as above. Signed on 2005-05-26. Completion date: 2006-06-04.
, same as above. Signed on 2004-06-28. Completion date: 2005-06-06.
, same as above. Signed on 2003-05-30. Completion date: 2004-06-04.
Top industries in this zip code by the number of employees in 2005:
Accommodation and Food Services: Full-Service Restaurants (100-249 employees: 1 establishment, 50-99 employees: 2 establishments, 20-49 employees: 3 establishments, 10-19 employees: 1 establishment, 5-9 employees: 1 establishment, 1-4 employees: 3 establishments)Administrative and Support and Waste Management and Remediation Services: Professional Employer Organizations (250-499: 1)Accommodation and Food Services: Limited-Service Restaurants (20-49: 5, 10-19: 1, 1-4: 3)Other Services (except Public Administration): Religious Organizations (50-99: 1, 10-19: 2, 5-9: 4, 1-4: 10)Construction: Plumbing, Heating, and Air-Conditioning Contractors (20-49: 2, 10-19: 2, 5-9: 1, 1-4: 3)Accommodation and Food Services: Hotels (except Casino Hotels) and Motels (20-49: 2, 10-19: 1, 5-9: 2)
People in group quarters in 2010:
1,021 people in state prisons
4 people in group homes intended for adults
People in group quarters in 2000:
1,009 people in state prisons
3 people in other noninstitutional group quarters
Fatal accident statistics in 2014:
Fatal accident count: 2Vehicles involved in fatal accidents: 2Fatal accidents caused by drunken drivers: 1Fatalities: 2Persons involved in fatal accidents: 2Pedestrians involved in fatal accidents: 1
Fatal accident statistics in 2013:
Fatal accident count: 4Vehicles involved in fatal accidents: 5Fatal accidents caused by drunken drivers: 2Fatalities: 5Persons involved in fatal accidents: 7Pedestrians involved in fatal accidents: 1
Home Mortgage Disclosure Act Aggregated Statistics For Year 2009(Based on 4 full and 4 partial tracts) A) FHA, FSA/RHS & VA B) Conventional C) Refinancings D) Home Improvement Loans F) Non-occupant Loans on G) Loans On Manufactured Number Average Value Number Average Value Number Average Value Number Average Value Number Average Value Number Average Value
LOANS ORIGINATED 489 $151,572 337 $154,610 1,279 $165,378 24 $70,591 81 $139,078 6 $54,973 APPLICATIONS APPROVED, NOT ACCEPTED 24 $145,810 16 $149,797 91 $160,359 0 $0 1 $64,560 3 $35,410 APPLICATIONS DENIED 89 $151,492 48 $162,765 374 $150,911 26 $58,040 27 $117,144 6 $60,143 APPLICATIONS WITHDRAWN 49 $159,910 42 $199,656 336 $156,131 6 $208,192 8 $125,045 3 $73,497 FILES CLOSED FOR INCOMPLETENESS 20 $161,844 8 $134,998 86 $171,289 4 $188,145 2 $108,625 1 $39,270
Aggregated Statistics For Year 2008(Based on 4 full and 4 partial tracts) A) FHA, FSA/RHS & VA B) Conventional C) Refinancings D) Home Improvement Loans F) Non-occupant Loans on G) Loans On Manufactured Number Average Value Number Average Value Number Average Value Number Average Value Number Average Value Number Average Value
LOANS ORIGINATED 357 $154,173 592 $156,939 767 $154,435 37 $71,315 164 $137,875 18 $65,728 APPLICATIONS APPROVED, NOT ACCEPTED 15 $181,679 53 $144,020 104 $136,594 7 $9,330 23 $122,890 3 $24,130 APPLICATIONS DENIED 85 $141,265 91 $145,810 563 $149,413 73 $50,015 41 $120,629 13 $63,571 APPLICATIONS WITHDRAWN 28 $150,683 72 $173,753 260 $160,250 11 $121,595 10 $151,151 3 $60,443 FILES CLOSED FOR INCOMPLETENESS 9 $119,714 17 $165,274 64 $174,903 7 $40,261 7 $198,987 1 $65,000
Aggregated Statistics For Year 2007(Based on 4 full and 4 partial tracts) A) FHA, FSA/RHS & VA B) Conventional C) Refinancings D) Home Improvement Loans E) Loans on Dwellings For 5+ Families F) Non-occupant Loans on G) Loans On Manufactured Number Average Value Number Average Value Number Average Value Number Average Value Number Average Value Number Average Value Number Average Value
LOANS ORIGINATED 139 $159,116 1,392 $146,416 791 $127,048 94 $60,198 1 $2,483,700 217 $130,693 28 $67,035 APPLICATIONS APPROVED, NOT ACCEPTED 11 $199,230 115 $163,501 176 $122,433 16 $46,799 0 $0 27 $116,636 5 $49,962 APPLICATIONS DENIED 24 $147,250 222 $151,325 673 $134,574 145 $41,121 0 $0 56 $177,253 32 $51,144 APPLICATIONS WITHDRAWN 10 $143,657 143 $140,585 399 $137,406 26 $82,870 0 $0 34 $136,378 1 $114,720 FILES CLOSED FOR INCOMPLETENESS 4 $137,735 46 $265,902 115 $151,911 2 $24,595 0 $0 6 $104,968 0 $0
Aggregated Statistics For Year 2006(Based on 4 full and 4 partial tracts) A) FHA, FSA/RHS & VA B) Conventional C) Refinancings D) Home Improvement Loans E) Loans on Dwellings For 5+ Families F) Non-occupant Loans on G) Loans On Manufactured Number Average Value Number Average Value Number Average Value Number Average Value Number Average Value Number Average Value Number Average Value
LOANS ORIGINATED 114 $140,346 1,888 $129,658 854 $107,665 92 $30,208 2 $10,368,750 389 $105,238 20 $63,745 APPLICATIONS APPROVED, NOT ACCEPTED 8 $146,608 223 $109,849 203 $109,621 18 $22,047 0 $0 41 $113,285 12 $56,986 APPLICATIONS DENIED 15 $134,899 315 $121,835 753 $117,652 92 $33,425 0 $0 83 $106,790 35 $55,194 APPLICATIONS WITHDRAWN 13 $160,190 199 $132,151 344 $123,437 21 $54,826 0 $0 50 $88,832 3 $90,177 FILES CLOSED FOR INCOMPLETENESS 0 $0 59 $114,165 141 $137,674 0 $0 0 $0 10 $105,126 0 $0
Aggregated Statistics For Year 2005(Based on 4 full and 4 partial tracts) A) FHA, FSA/RHS & VA B) Conventional C) Refinancings D) Home Improvement Loans E) Loans on Dwellings For 5+ Families F) Non-occupant Loans on G) Loans On Manufactured Number Average Value Number Average Value Number Average Value Number Average Value Number Average Value Number Average Value Number Average Value
LOANS ORIGINATED 137 $139,405 1,470 $121,771 815 $120,192 116 $36,395 4 $1,098,595 283 $92,922 35 $56,526 APPLICATIONS APPROVED, NOT ACCEPTED 6 $150,365 114 $120,762 153 $126,311 21 $29,324 0 $0 26 $93,950 12 $54,187 APPLICATIONS DENIED 15 $107,936 224 $105,868 665 $126,348 119 $40,754 0 $0 60 $99,810 51 $65,166 APPLICATIONS WITHDRAWN 18 $148,848 183 $113,863 400 $134,176 59 $162,215 0 $0 46 $111,555 3 $63,570 FILES CLOSED FOR INCOMPLETENESS 1 $115,520 42 $115,921 179 $139,000 6 $38,775 0 $0 0 $0 3 $70,990
Aggregated Statistics For Year 2004(Based on 4 full and 4 partial tracts) A) FHA, FSA/RHS & VA B) Conventional C) Refinancings D) Home Improvement Loans F) Non-occupant Loans on G) Loans On Manufactured Number Average Value Number Average Value Number Average Value Number Average Value Number Average Value Number Average Value
LOANS ORIGINATED 176 $132,902 1,180 $123,346 918 $112,448 89 $43,889 171 $96,417 18 $61,501 APPLICATIONS APPROVED, NOT ACCEPTED 10 $133,458 115 $113,771 116 $98,579 27 $31,055 22 $95,926 27 $59,551 APPLICATIONS DENIED 26 $129,862 206 $111,761 718 $113,484 85 $33,352 30 $116,025 63 $62,035 APPLICATIONS WITHDRAWN 36 $136,579 127 $125,698 339 $120,045 23 $34,851 24 $100,810 2 $47,430 FILES CLOSED FOR INCOMPLETENESS 3 $110,193 19 $103,911 116 $137,297 19 $47,421 2 $20,750 3 $63,260
Aggregated Statistics For Year 2003(Based on 4 full and 4 partial tracts) A) FHA, FSA/RHS & VA B) Conventional C) Refinancings D) Home Improvement Loans E) Loans on Dwellings For 5+ Families F) Non-occupant Loans on Number Average Value Number Average Value Number Average Value Number Average Value Number Average Value Number Average Value
LOANS ORIGINATED 199 $125,356 1,001 $125,980 2,480 $120,789 67 $35,827 2 $122,450 129 $78,830 APPLICATIONS APPROVED, NOT ACCEPTED 4 $194,852 68 $120,327 244 $118,120 12 $14,352 0 $0 10 $105,824 APPLICATIONS DENIED 29 $115,916 161 $90,420 634 $114,148 63 $19,573 0 $0 25 $74,328 APPLICATIONS WITHDRAWN 23 $135,934 108 $124,027 401 $116,101 12 $40,866 0 $0 26 $100,991 FILES CLOSED FOR INCOMPLETENESS 5 $129,388 26 $109,028 102 $123,871 2 $33,810 0 $0 6 $98,422
Aggregated Statistics For Year 2002(Based on 4 full and 2 partial tracts) A) FHA, FSA/RHS & VA B) Conventional C) Refinancings D) Home Improvement Loans F) Non-occupant Loans on Number Average Value Number Average Value Number Average Value Number Average Value Number Average Value
LOANS ORIGINATED 146 $116,210 757 $127,036 1,648 $115,106 53 $25,980 118 $111,526 APPLICATIONS APPROVED, NOT ACCEPTED 6 $171,405 60 $113,318 170 $105,844 10 $30,559 6 $67,450 APPLICATIONS DENIED 24 $114,750 106 $85,695 620 $99,630 46 $12,122 21 $73,295 APPLICATIONS WITHDRAWN 5 $123,998 79 $129,121 349 $107,450 10 $16,995 11 $91,876 FILES CLOSED FOR INCOMPLETENESS 3 $116,060 15 $108,885 114 $111,121 0 $0 4 $93,828
Aggregated Statistics For Year 2001(Based on 4 full and 2 partial tracts) A) FHA, FSA/RHS & VA B) Conventional C) Refinancings D) Home Improvement Loans F) Non-occupant Loans on Number Average Value Number Average Value Number Average Value Number Average Value Number Average Value
LOANS ORIGINATED 208 $112,404 831 $122,481 1,322 $110,500 67 $14,014 68 $101,051 APPLICATIONS APPROVED, NOT ACCEPTED 4 $99,932 71 $105,546 125 $88,710 9 $25,783 3 $85,777 APPLICATIONS DENIED 19 $111,721 148 $89,356 529 $86,670 55 $16,401 8 $75,840 APPLICATIONS WITHDRAWN 17 $103,961 84 $119,450 300 $90,939 8 $24,215 10 $90,062 FILES CLOSED FOR INCOMPLETENESS 1 $52,020 14 $131,313 52 $91,969 2 $44,440 0 $0
Aggregated Statistics For Year 2000(Based on 4 full and 2 partial tracts) A) FHA, FSA/RHS & VA B) Conventional C) Refinancings D) Home Improvement Loans F) Non-occupant Loans on Number Average Value Number Average Value Number Average Value Number Average Value Number Average Value
LOANS ORIGINATED 211 $104,529 876 $112,509 310 $80,419 58 $18,540 62 $89,383 APPLICATIONS APPROVED, NOT ACCEPTED 7 $64,639 80 $65,388 113 $84,012 21 $24,897 8 $32,976 APPLICATIONS DENIED 45 $106,804 212 $79,249 455 $63,990 79 $25,017 11 $87,952 APPLICATIONS WITHDRAWN 29 $101,961 60 $113,845 178 $65,094 9 $33,639 2 $33,100 FILES CLOSED FOR INCOMPLETENESS 4 $95,272 21 $102,413 39 $86,660 0 $0 4 $43,368
Aggregated Statistics For Year 1999(Based on 2 full and 2 partial tracts) A) FHA, FSA/RHS & VA B) Conventional C) Refinancings D) Home Improvement Loans E) Loans on Dwellings For 5+ Families F) Non-occupant Loans on Number Average Value Number Average Value Number Average Value Number Average Value Number Average Value Number Average Value
LOANS ORIGINATED 150 $107,216 502 $109,949 335 $85,229 42 $16,087 1 $195,960 22 $83,381 APPLICATIONS APPROVED, NOT ACCEPTED 8 $104,210 48 $72,549 107 $77,219 25 $20,995 0 $0 10 $63,534 APPLICATIONS DENIED 21 $108,372 175 $71,213 217 $72,068 52 $15,909 0 $0 8 $54,871 APPLICATIONS WITHDRAWN 15 $111,217 60 $108,974 120 $70,594 2 $17,830 0 $0 2 $105,295 FILES CLOSED FOR INCOMPLETENESS 1 $136,760 16 $95,101 34 $76,781 0 $0 0 $0 1 $62,320
Detailed HMDA statistics for the following Tracts:
0030.06
,
0030.07 ,
0031.02 ,
0033.02
Private Mortgage Insurance Companies Aggregated Statistics For Year 2009(Based on 4 full and 4 partial tracts) A) Conventional B) Refinancings C) Non-occupant Loans on Number Average Value Number Average Value Number Average Value
LOANS ORIGINATED 92 $170,247 82 $178,049 0 $0 APPLICATIONS APPROVED, NOT ACCEPTED 28 $190,424 23 $171,367 2 $83,940 APPLICATIONS DENIED 18 $205,024 11 $191,374 0 $0 APPLICATIONS WITHDRAWN 2 $209,260 8 $168,354 0 $0 FILES CLOSED FOR INCOMPLETENESS 4 $155,712 4 $136,420 0 $0
Aggregated Statistics For Year 2008(Based on 4 full and 4 partial tracts) A) Conventional B) Refinancings C) Non-occupant Loans on D) Loans On Manufactured Number Average Value Number Average Value Number Average Value Number Average Value
LOANS ORIGINATED 318 $164,456 135 $162,596 41 $140,014 1 $68,920 APPLICATIONS APPROVED, NOT ACCEPTED 87 $164,990 56 $183,008 14 $111,469 0 $0 APPLICATIONS DENIED 15 $160,339 3 $198,817 2 $85,530 0 $0 APPLICATIONS WITHDRAWN 8 $154,110 10 $192,917 2 $136,740 0 $0 FILES CLOSED FOR INCOMPLETENESS 8 $227,006 6 $157,915 4 $271,205 0 $0
Aggregated Statistics For Year 2007(Based on 4 full and 4 partial tracts) A) Conventional B) Refinancings C) Non-occupant Loans on D) Loans On Manufactured Number Average Value Number Average Value Number Average Value Number Average Value
LOANS ORIGINATED 546 $158,318 160 $153,274 61 $144,163 1 $67,700 APPLICATIONS APPROVED, NOT ACCEPTED 58 $177,237 35 $165,775 13 $147,905 1 $41,650 APPLICATIONS DENIED 15 $153,865 7 $93,464 7 $156,106 2 $69,825 APPLICATIONS WITHDRAWN 26 $232,274 14 $150,060 3 $130,320 2 $190,890 FILES CLOSED FOR INCOMPLETENESS 4 $162,145 0 $0 0 $0 0 $0
Aggregated Statistics For Year 2006(Based on 4 full and 4 partial tracts) A) Conventional B) Refinancings C) Non-occupant Loans on D) Loans On Manufactured Number Average Value Number Average Value Number Average Value Number Average Value
LOANS ORIGINATED 369 $148,708 89 $142,561 25 $133,478 1 $61,370 APPLICATIONS APPROVED, NOT ACCEPTED 35 $196,552 28 $153,460 5 $135,748 1 $50,420 APPLICATIONS DENIED 9 $138,736 5 $151,238 4 $107,845 0 $0 APPLICATIONS WITHDRAWN 15 $117,596 11 $137,590 0 $0 0 $0 FILES CLOSED FOR INCOMPLETENESS 2 $185,960 0 $0 0 $0 0 $0
Aggregated Statistics For Year 2005(Based on 4 full and 4 partial tracts) A) Conventional B) Refinancings C) Non-occupant Loans on D) Loans On Manufactured Number Average Value Number Average Value Number Average Value Number Average Value
LOANS ORIGINATED 326 $140,939 142 $129,874 34 $124,195 2 $57,895 APPLICATIONS APPROVED, NOT ACCEPTED 37 $116,216 24 $170,665 13 $109,446 1 $63,180 APPLICATIONS DENIED 2 $178,445 6 $151,737 0 $0 0 $0 APPLICATIONS WITHDRAWN 15 $167,996 12 $139,279 2 $205,600 0 $0 FILES CLOSED FOR INCOMPLETENESS 2 $156,860 2 $140,715 0 $0 0 $0
Aggregated Statistics For Year 2004(Based on 4 full and 4 partial tracts) A) Conventional B) Refinancings C) Non-occupant Loans on D) Loans On Manufactured Number Average Value Number Average Value Number Average Value Number Average Value
LOANS ORIGINATED 303 $130,582 152 $130,803 46 $102,224 2 $68,645 APPLICATIONS APPROVED, NOT ACCEPTED 42 $159,993 49 $134,608 4 $172,490 2 $79,615 APPLICATIONS DENIED 8 $141,499 8 $129,124 0 $0 0 $0 APPLICATIONS WITHDRAWN 14 $129,135 22 $138,840 4 $126,895 0 $0 FILES CLOSED FOR INCOMPLETENESS 8 $135,936 6 $124,820 0 $0 0 $0
Aggregated Statistics For Year 2003(Based on 4 full and 4 partial tracts) A) Conventional B) Refinancings C) Non-occupant Loans on Number Average Value Number Average Value Number Average Value
LOANS ORIGINATED 437 $133,275 623 $134,765 21 $77,737 APPLICATIONS APPROVED, NOT ACCEPTED 76 $134,762 223 $133,285 11 $91,244 APPLICATIONS DENIED 13 $107,010 8 $123,601 2 $92,040 APPLICATIONS WITHDRAWN 13 $129,166 36 $125,157 6 $78,562 FILES CLOSED FOR INCOMPLETENESS 0 $0 8 $98,281 0 $0
Aggregated Statistics For Year 2002(Based on 4 full and 2 partial tracts) A) Conventional B) Refinancings C) Non-occupant Loans on Number Average Value Number Average Value Number Average Value
LOANS ORIGINATED 386 $141,371 468 $130,572 21 $89,747 APPLICATIONS APPROVED, NOT ACCEPTED 51 $135,416 109 $135,636 4 $134,308 APPLICATIONS DENIED 6 $136,973 17 $105,555 0 $0 APPLICATIONS WITHDRAWN 10 $129,080 15 $140,127 4 $98,190 FILES CLOSED FOR INCOMPLETENESS 6 $101,712 12 $117,290 0 $0
Aggregated Statistics For Year 2001(Based on 4 full and 2 partial tracts) A) Conventional B) Refinancings C) Non-occupant Loans on Number Average Value Number Average Value Number Average Value
LOANS ORIGINATED 481 $131,111 408 $127,972 13 $93,177 APPLICATIONS APPROVED, NOT ACCEPTED 52 $131,294 41 $152,153 6 $74,988 APPLICATIONS DENIED 6 $106,800 29 $126,498 2 $321,135 APPLICATIONS WITHDRAWN 17 $115,425 23 $172,558 2 $82,895 FILES CLOSED FOR INCOMPLETENESS 2 $122,195 8 $147,614 0 $0
Aggregated Statistics For Year 2000(Based on 4 full and 2 partial tracts) A) Conventional B) Refinancings C) Non-occupant Loans on Number Average Value Number Average Value Number Average Value
LOANS ORIGINATED 488 $129,654 45 $115,285 10 $96,110 APPLICATIONS APPROVED, NOT ACCEPTED 57 $133,370 28 $127,421 0 $0 APPLICATIONS DENIED 9 $137,327 13 $124,644 0 $0 APPLICATIONS WITHDRAWN 21 $116,553 7 $112,656 0 $0 FILES CLOSED FOR INCOMPLETENESS 10 $113,592 0 $0 0 $0
Aggregated Statistics For Year 1999(Based on 2 full and 2 partial tracts) A) Conventional B) Refinancings Number Average Value Number Average Value
LOANS ORIGINATED 289 $127,286 63 $111,840 APPLICATIONS APPROVED, NOT ACCEPTED 22 $120,500 9 $107,548 APPLICATIONS DENIED 14 $118,899 7 $106,276 APPLICATIONS WITHDRAWN 7 $131,017 5 $112,372 FILES CLOSED FOR INCOMPLETENESS 3 $118,687 1 $152,230
Detailed PMIC statistics for the following Tracts:
0030.06
,
0030.07 ,
0031.02 ,
0033.02
2002 - 2018 National Fire Incident Reporting System (NFIRS) incidents See full 2006 National Fire Incident Reporting System statistics for zip code 29680, South Carolina
Most common first names in zip code 29680 among deceased individuals Name Count Lived (average)
James 35 66.3 years Mary 27 74.7 years William 23 70.5 years Robert 22 67.4 years John 17 72.2 years Charles 17 74.8 years Frances 12 82.5 years Paul 10 68.7 years Ruby 9 80.8 years Ruth 9 75.2 years
Most common last names in zip code 29680 among deceased individuals Last name Count Lived (average)
Sullivan 13 70.9 years Johnson 10 73.6 years Sweeney 9 68.2 years Smith 9 63.4 years Miller 7 76.3 years Moore 7 74.6 years Thomason 7 77.4 years Evans 6 69.0 years Jones 6 75.1 years Chandler 6 78.7 years
Businesses in zip code 29680
Name Count Name Count
AT&T 1 Motel 6 1 Applebee's 1 Nike 1 Arby's 1 Panera Bread 1 Blockbuster 1 Penske 1 Burger King 1 Pier 1 Imports 1 CVS 2 Pizza Hut 1 Chick-Fil-A 1 Publix Super Markets 1 Comfort Suites 1 Quality 1 Cracker Barrel 1 Quiznos 1 Days Inn 1 RadioShack 1 Decora Cabinetry 1 Ruby Tuesday 1 Dunkin Donuts 1 Ryan's Grill 1 FedEx 2 SONIC Drive-In 1 GNC 1 Sprint Nextel 2 GameStop 1 Starbucks 2 H&R Block 1 T-Mobile 3 Hilton 1 T.J.Maxx 1 Home Depot 1 Target 1 Jack In The Box 1 Tire Kingdom 1 Just Tires 1 UPS 4 KFC 1 Verizon Wireless 1 Lowe's 1 Waffle House 1 MasterBrand Cabinets 1 Walmart 1 McDonald's 1

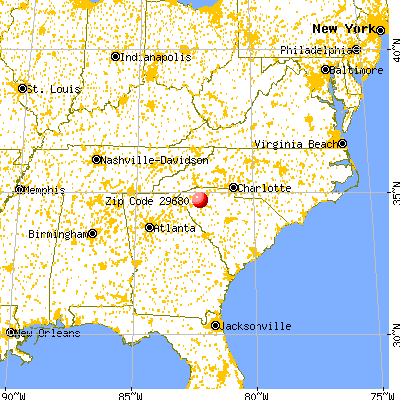


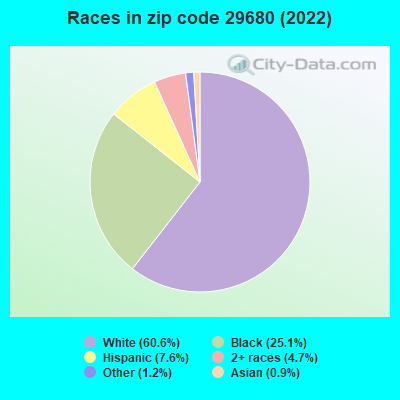


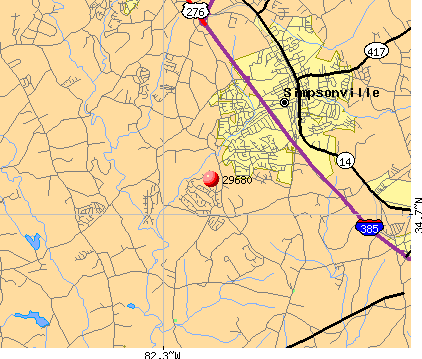 Nearest zip codes: 29662, 29644, 29681, 29605, 29669, 29607.
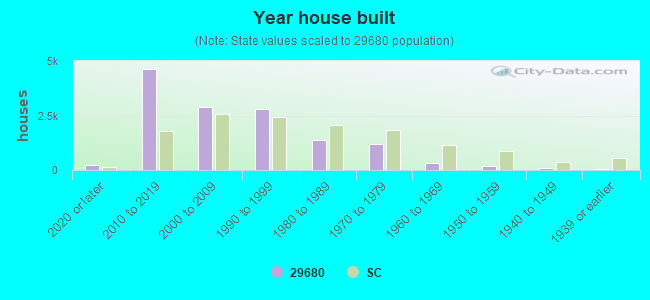

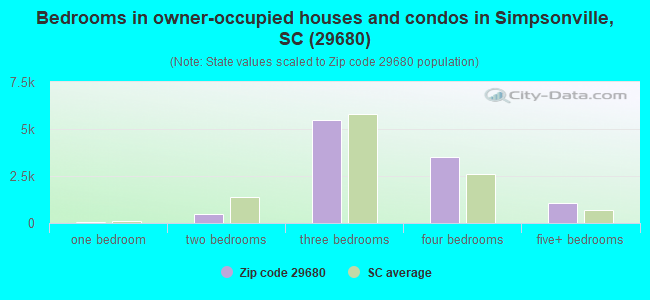
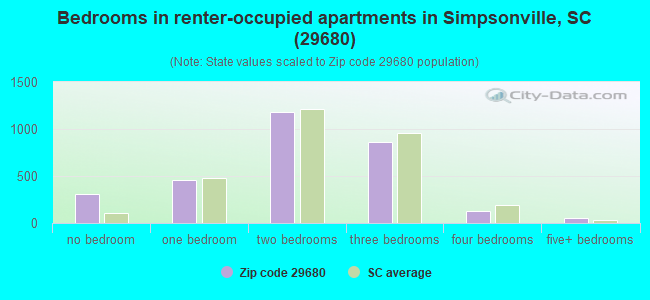
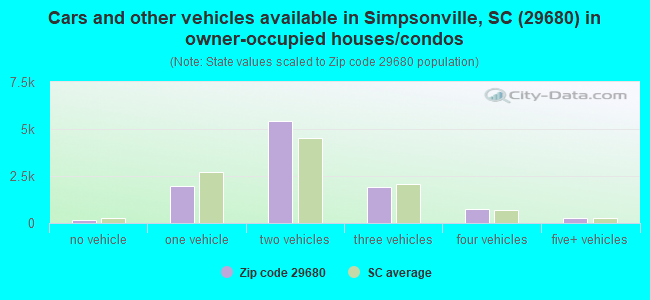
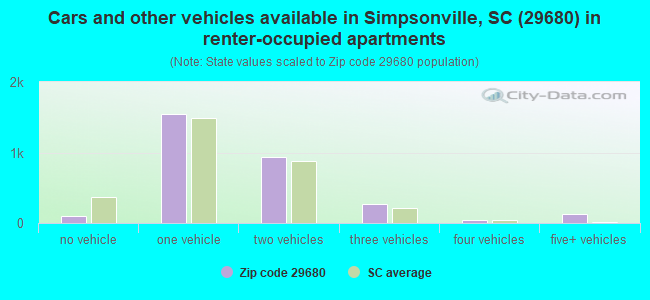


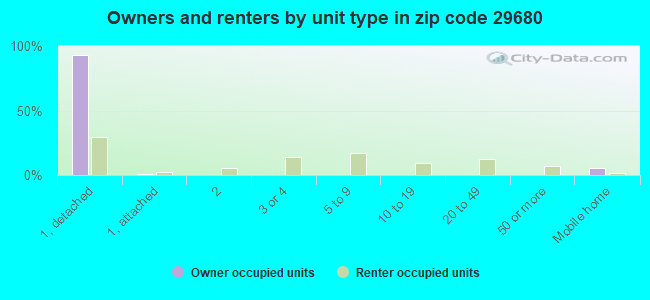
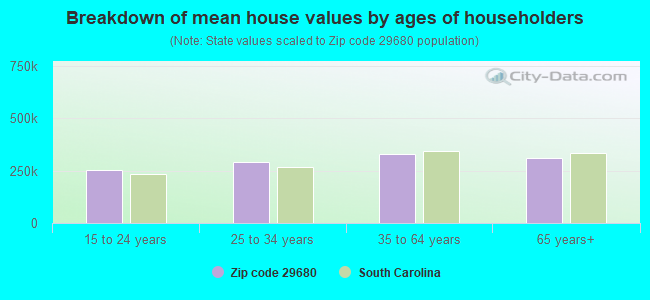


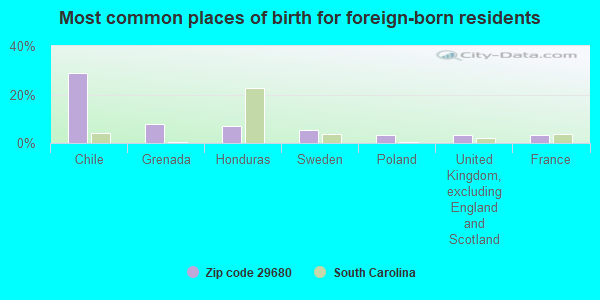
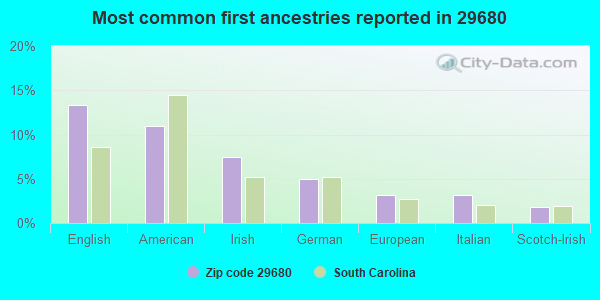
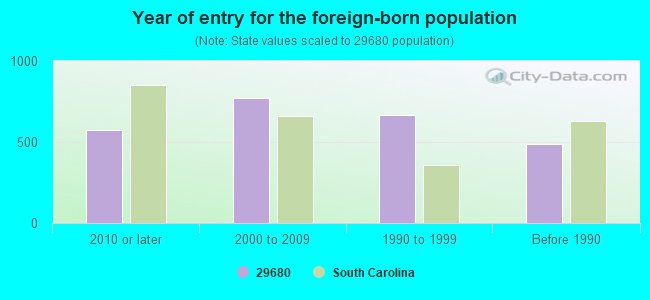


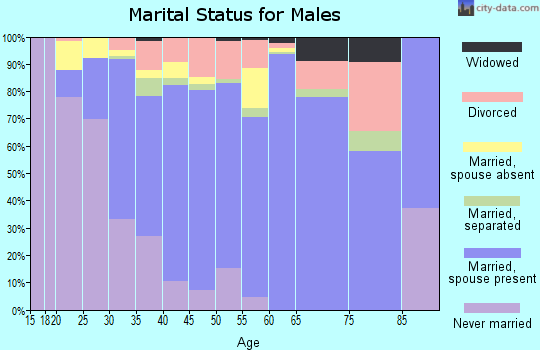

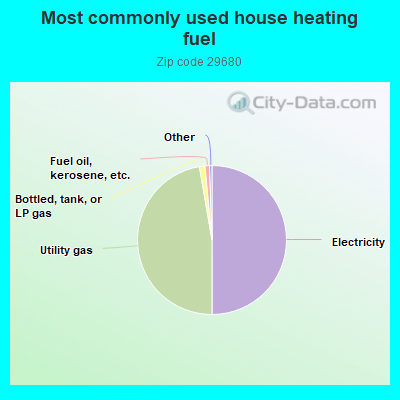
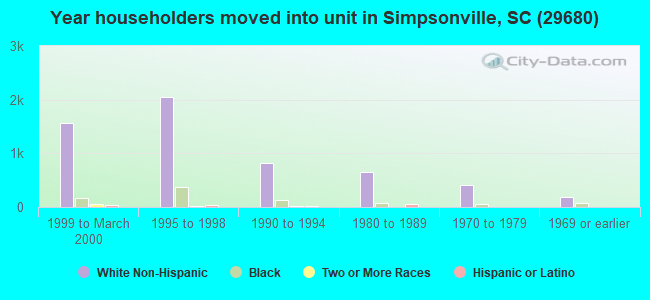
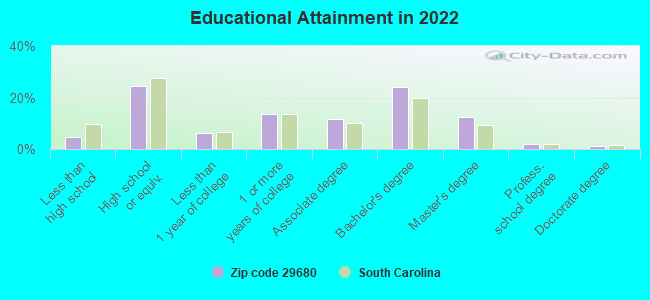
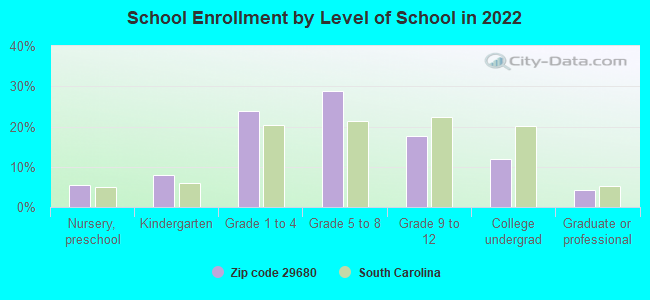
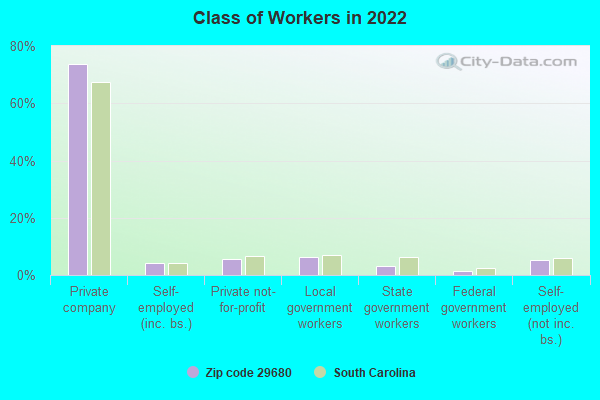
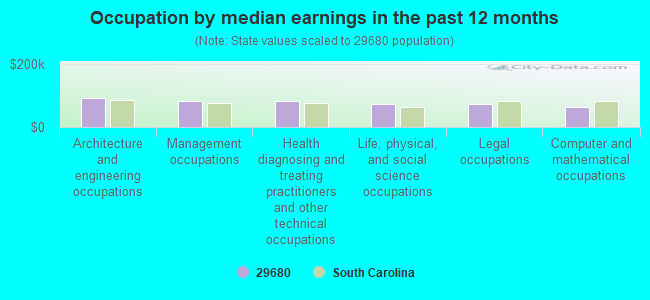
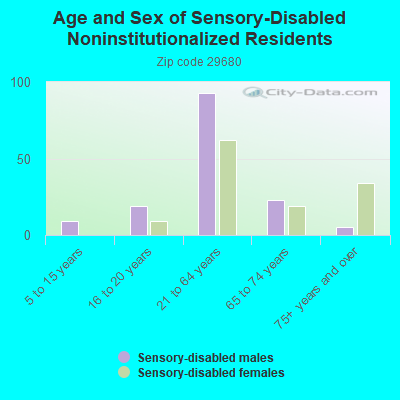
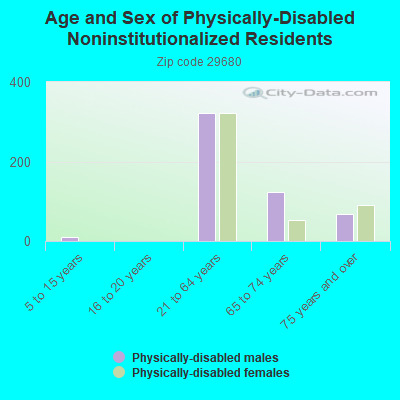
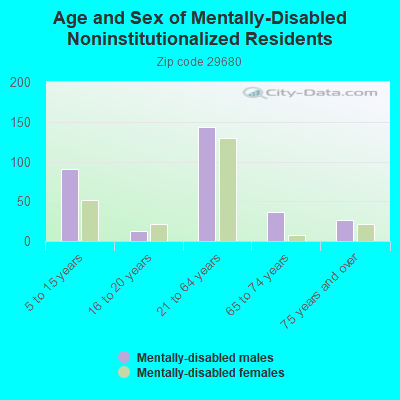
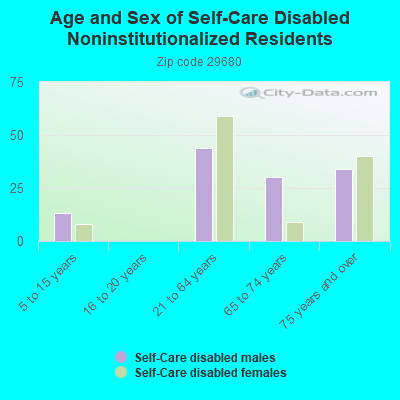
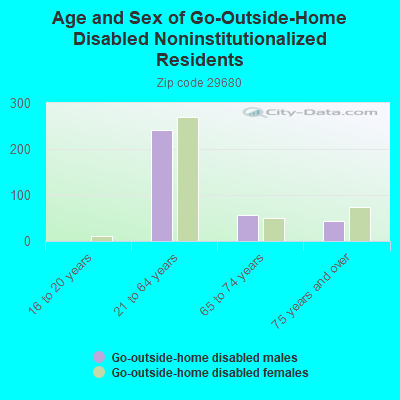
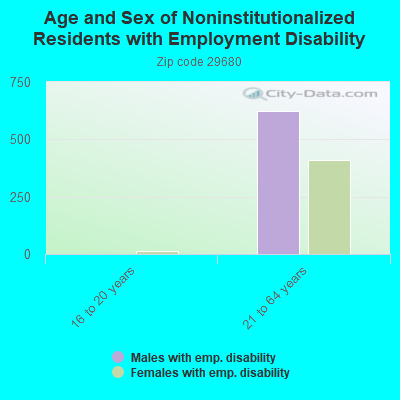
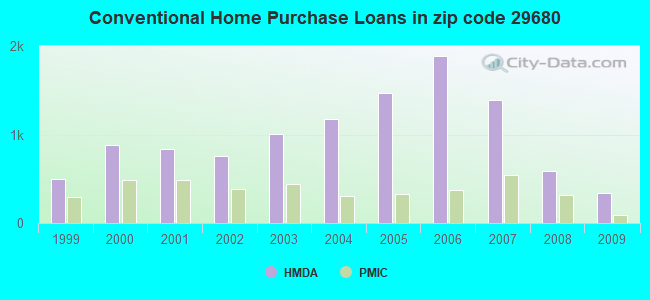
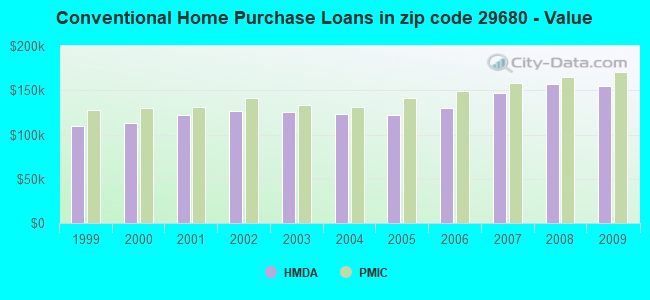
 According to the data from the years 2002 - 2018 the average number of fire incidents per year is 53. The highest number of fire incidents - 71 took place in 2010, and the least - 39 in 2006. The data has a dropping trend.
 When looking into fire subcategories, the most reports belonged to: Outside Fires (43.2%), and Structure Fires (31.1%).