Estimated zip code population in 2022: 43,171 Zip code population in 2010: 25,035 Zip code population in 2000: 10,645
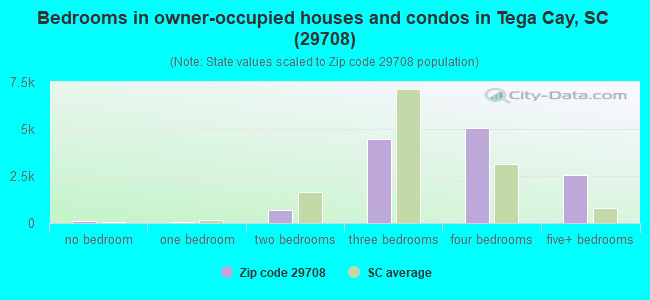
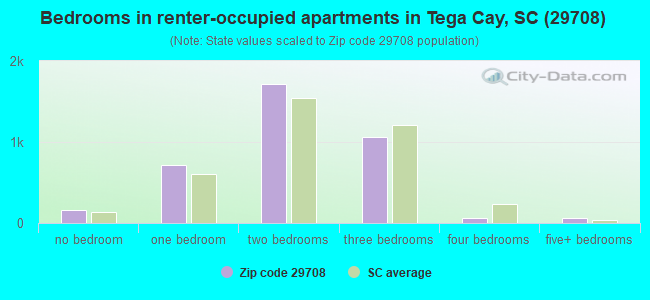
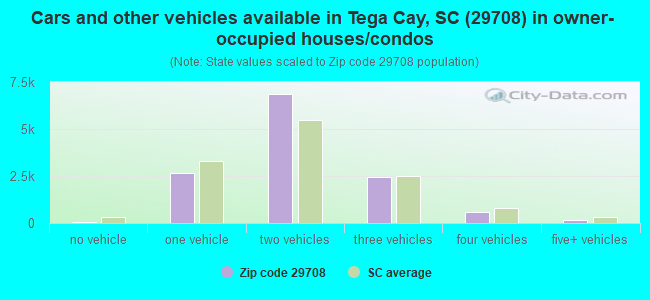
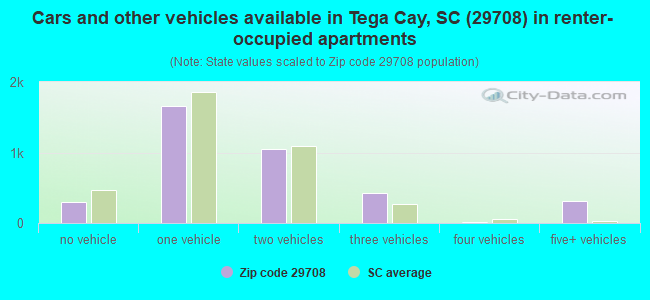
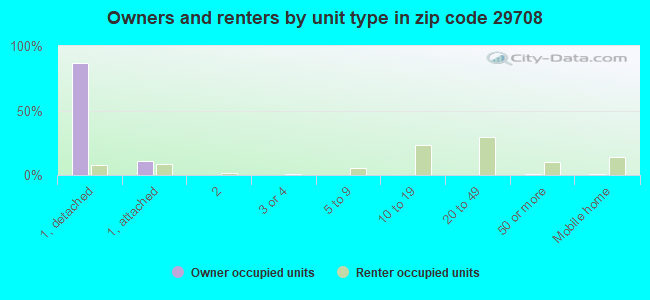
Houses and condos: 16,462 Renter-occupied apartments: 3,761
% of renters here:
23%
State:
28%
March 2022 cost of living index in zip code 29708: 93.1 (less than average, U.S. average is 100)
Land area: 19.0 sq. mi. Water area: 1.2 sq. mi.
Population density: 2,271 people per square mile
(low).
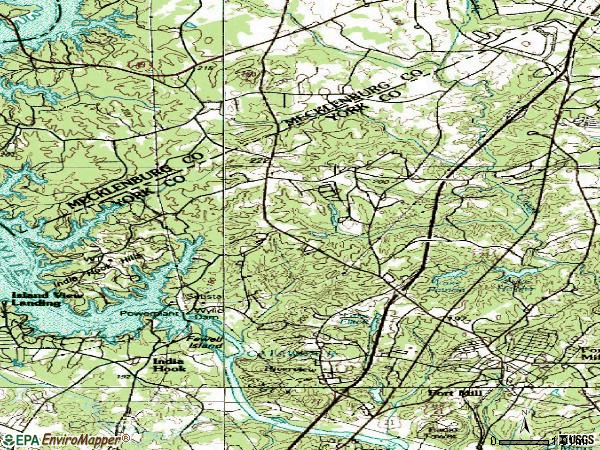
OSM Map
General Map
Google Map
MSN Map
OSM Map
General Map
Google Map
MSN Map
OSM Map
General Map
Google Map
MSN Map
OSM Map
General Map
Google Map
MSN Map
Please wait while loading the map...
Real estate property taxes paid for housing units in 2022:
This zip code:
0.6% ($2,961)
South Carolina:
0.5% ($1,185)
Median real estate property taxes paid for housing units with mortgages in 2022: $3,190 (0.6%) Median real estate property taxes paid for housing units with no mortgage in 2022: $2,175 (0.5%)
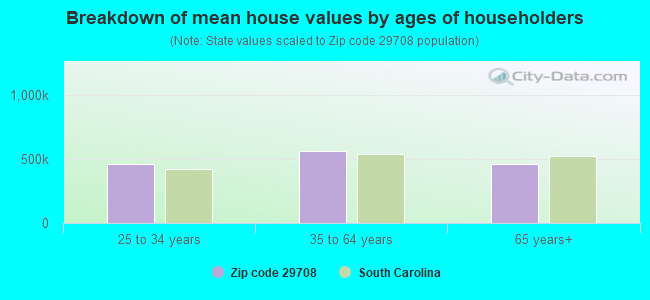
Estimated median house/condo value in 2022: $517,679
29708:
$517,679
South Carolina:
$254,600
According to our research of South Carolina and other state lists, there were 4 registered sex offenders living in 29708 zip code as of April 27, 2024. The ratio of all residents to sex offenders in zip code 29708 is 7,760 to 1. The ratio of registered sex offenders to all residents in this zip code is much lower than the state average.
Median resident age:
This zip code:
40.1 years
South Carolina median age:
40.5 years
Average household size:
This zip code:
2.6 people
South Carolina:
2.4 people
Averages for the 2020 tax year for zip code 29708, filed in 2021:
Average Adjusted Gross Income (AGI) in 2020: $113,485 (Individual Income Tax Returns)
Here:
$113,485
State:
$65,754
Salary/wage: $103,593 (reported on 85.2% of returns)
Here:
$103,593
State:
$52,566
(% of AGI for various income ranges: 1052.2% for AGIs below $25k, 3706.7% for AGIs $25k-50k, 6470.5% for AGIs $50k-75k, 9636.1% for AGIs $75k-100k, 19749.7% for AGIs $100k-200k, 68674.1% for AGIs over 200k)
Taxable interest for individuals: $1,304 (reported on 38.3% of returns)
This zip code:
$1,304
South Carolina:
$1,749
(% of AGI for various income ranges: 23.3% for AGIs below $25k, 30.4% for AGIs $25k-50k, 48.8% for AGIs $50k-75k, 64.7% for AGIs $75k-100k, 80.1% for AGIs $100k-200k, 381.7% for AGIs over 200k)
Ordinary dividends: $4,388 (reported on 33.0% of returns)
Here:
$4,388
State:
$8,783
(% of AGI for various income ranges: 40.8% for AGIs below $25k, 69.5% for AGIs $25k-50k, 140.9% for AGIs $50k-75k, 146.1% for AGIs $75k-100k, 255.5% for AGIs $100k-200k, 1193.7% for AGIs over 200k)
Net capital gain/loss in AGI: +$16,491 (reported on 30.3% of returns)
Here:
+$16,491
State:
+$24,194
(% of AGI for various income ranges: 16.6% for AGIs below $25k, 35.8% for AGIs $25k-50k, 131.6% for AGIs $50k-75k, 203.9% for AGIs $75k-100k, 438.2% for AGIs $100k-200k, 6845.1% for AGIs over 200k)
Profit/loss from business: +$13,758 (reported on 17.7% of returns)
Here:
+$13,758
State:
+$11,253
(% of AGI for various income ranges: 140.1% for AGIs below $25k, 171.1% for AGIs $25k-50k, 239.2% for AGIs $50k-75k, 220.2% for AGIs $75k-100k, 538.6% for AGIs $100k-200k, 1460.6% for AGIs over 200k)
Taxable individual retirement arrangement distribution: $22,479 (reported on 10.9% of returns)
29708:
$22,479
South Carolina:
$21,604
(% of AGI for various income ranges: 67.9% for AGIs below $25k, 179.6% for AGIs $25k-50k, 341.3% for AGIs $50k-75k, 525.7% for AGIs $75k-100k, 580.9% for AGIs $100k-200k, 1063.7% for AGIs over 200k)
Self-employed (Keogh) retirement plans: $19,843 (reported on 0.8% of returns)
29708:
$19,843
South Carolina:
$25,038
(% of AGI for various income ranges: 22.6% for AGIs $100k-200k, 194.6% for AGIs over 200k)
Total itemized deductions: $33,984 (reported on 17.7% of returns)
Here:
$33,984
State:
$35,199
(% of AGI for various income ranges: 76.4% for AGIs below $25k, 160.9% for AGIs $25k-50k, 408.4% for AGIs $50k-75k, 591.8% for AGIs $75k-100k, 1271.0% for AGIs $100k-200k, 5172.0% for AGIs over 200k)
Charity contributions: $11,992 (reported on 15.0% of returns)
Here:
$11,992
State:
$14,319
(% of AGI for various income ranges: 5.5% for AGIs below $25k, 24.3% for AGIs $25k-50k, 63.3% for AGIs $50k-75k, 89.1% for AGIs $75k-100k, 278.1% for AGIs $100k-200k, 2091.3% for AGIs over 200k)
Taxes paid: $8,703 (reported on 17.7% of returns)
29708:
$8,703
State:
$7,486
(% of AGI for various income ranges: 10.9% for AGIs below $25k, 30.0% for AGIs $25k-50k, 94.2% for AGIs $50k-75k, 165.8% for AGIs $75k-100k, 397.1% for AGIs $100k-200k, 1176.5% for AGIs over 200k)
Earned income credit: $2,050 (reported on 6.7% of returns)
Here:
$2,050
State:
$2,397
(% of AGI for various income ranges: 53.9% for AGIs below $25k, 49.6% for AGIs $25k-50k)
Percentage of individuals using paid preparers for their 2020 taxes: 94.6%
Here:
95%
State:
93%
(% for various income ranges: 92.5% for AGIs below $25k, 94.0% for AGIs $25k-50k, 94.5% for AGIs $50k-75k, 94.8% for AGIs $75k-100k, 95.5% for AGIs $100k-200k, 96.9% for AGIs over 200k)
Averages for the 2012 tax year for zip code 29708, filed in 2013:
Average Adjusted Gross Income (AGI) in 2012: $91,317 (Individual Income Tax Returns)
Here:
$91,317
State:
$51,133
Salary/wage: $82,254 (reported on 86.6% of returns)
Here:
$82,254
State:
$42,173
(% of AGI for various income ranges: 72.9% for AGIs below $25k, 74.6% for AGIs $25k-50k, 75.1% for AGIs $50k-75k, 79.6% for AGIs $75k-100k, 85.2% for AGIs $100k-200k, 70.4% for AGIs over 200k)
Taxable interest for individuals: $1,066 (reported on 44.9% of returns)
This zip code:
$1,066
South Carolina:
$1,468
(% of AGI for various income ranges: 1.5% for AGIs below $25k, 0.8% for AGIs $25k-50k, 0.6% for AGIs $50k-75k, 0.5% for AGIs $75k-100k, 0.4% for AGIs $100k-200k, 0.6% for AGIs over 200k)
Ordinary dividends: $4,371 (reported on 32.4% of returns)
Here:
$4,371
State:
$6,511
(% of AGI for various income ranges: 2.5% for AGIs below $25k, 1.5% for AGIs $25k-50k, 1.3% for AGIs $50k-75k, 1.2% for AGIs $75k-100k, 1.0% for AGIs $100k-200k, 2.4% for AGIs over 200k)
Net capital gain/loss in AGI: +$8,072 (reported on 26.4% of returns)
Here:
+$8,072
State:
+$13,061
(% of AGI for various income ranges: 0.2% for AGIs $25k-50k, 0.5% for AGIs $50k-75k, 0.2% for AGIs $75k-100k, 0.9% for AGIs $100k-200k, 6.2% for AGIs over 200k)
Profit/loss from business: +$14,122 (reported on 17.4% of returns)
Here:
+$14,122
State:
+$10,167
(% of AGI for various income ranges: 7.2% for AGIs below $25k, 4.3% for AGIs $25k-50k, 3.1% for AGIs $50k-75k, 1.5% for AGIs $75k-100k, 1.9% for AGIs $100k-200k, 3.3% for AGIs over 200k)
Taxable individual retirement arrangement distribution: $18,013 (reported on 13.0% of returns)
29708:
$18,013
South Carolina:
$17,019
(% of AGI for various income ranges: 5.4% for AGIs below $25k, 4.4% for AGIs $25k-50k, 3.7% for AGIs $50k-75k, 4.3% for AGIs $75k-100k, 2.2% for AGIs $100k-200k, 1.4% for AGIs over 200k)
Self-employment retirement plans: $15,020 (reported on 0.8% of returns)
29708:
$15,020
South Carolina:
$21,023
(% of AGI for various income ranges: 0.3% for AGIs $50k-75k, 0.3% for AGIs over 200k)
Total itemized deductions: $25,780 (19% of AGI, reported on 59.0% of returns)
Here:
$25,780
State:
$22,890
Here:
19.5% of AGI
State:
21.4% of AGI
(% of AGI for various income ranges: 18.2% for AGIs below $25k, 16.8% for AGIs $25k-50k, 18.5% for AGIs $50k-75k, 17.6% for AGIs $75k-100k, 17.9% for AGIs $100k-200k, 14.1% for AGIs over 200k)
Charity contributions: $4,080 (reported on 52.4% of returns)
Here:
$4,080
State:
$5,169
(% of AGI for various income ranges: 1.7% for AGIs below $25k, 2.3% for AGIs $25k-50k, 2.4% for AGIs $50k-75k, 2.3% for AGIs $75k-100k, 2.4% for AGIs $100k-200k, 2.4% for AGIs over 200k)
Taxes paid: $10,320 (reported on 59.0% of returns)
29708:
$10,320
State:
$7,644
(% of AGI for various income ranges: 2.9% for AGIs below $25k, 3.9% for AGIs $25k-50k, 5.2% for AGIs $50k-75k, 6.2% for AGIs $75k-100k, 7.5% for AGIs $100k-200k, 7.2% for AGIs over 200k)
Earned income credit: $1,874 (reported on 7.5% of returns)
Here:
$1,874
State:
$2,418
(% of AGI for various income ranges: 3.7% for AGIs below $25k, 0.8% for AGIs $25k-50k)
Percentage of individuals using paid preparers for their 2012 taxes: 54.0%
Here:
54%
State:
57%
(% for various income ranges: 46.7% for AGIs below $25k, 54.8% for AGIs $25k-50k, 56.2% for AGIs $50k-75k, 53.8% for AGIs $75k-100k, 55.5% for AGIs $100k-200k, 66.7% for AGIs over 200k)
Averages for the 2004 tax year for zip code 29708, filed in 2005:
Average Adjusted Gross Income (AGI) in 2004: $71,868 (Individual Income Tax Returns)
Here:
$71,868
State:
$41,965
Salary/wage: $65,361 (reported on 89.6% of returns)
Here:
$65,361
State:
$35,695
(% of AGI for various income ranges: 328.6% for AGIs below $10k, 75.1% for AGIs $10k-25k, 81.2% for AGIs $25k-50k, 83.1% for AGIs $50k-75k, 87.8% for AGIs $75k-100k, 77.9% for AGIs over 100k)
Taxable interest for individuals: $1,288 (reported on 55.7% of returns)
This zip code:
$1,288
South Carolina:
$1,623
(% of AGI for various income ranges: 11.5% for AGIs below $10k, 2.8% for AGIs $10k-25k, 1.3% for AGIs $25k-50k, 0.7% for AGIs $50k-75k, 0.6% for AGIs $75k-100k, 1.0% for AGIs over 100k)
Taxable dividends: $2,261 (reported on 35.4% of returns)
Here:
$2,261
State:
$3,999
(% of AGI for various income ranges: 13.6% for AGIs below $10k, 2.4% for AGIs $10k-25k, 1.2% for AGIs $25k-50k, 0.9% for AGIs $50k-75k, 0.9% for AGIs $75k-100k, 1.1% for AGIs over 100k)
Net capital gain/loss: +$11,293 (reported on 29.4% of returns)
Here:
+$11,293
State:
+$13,100
(% of AGI for various income ranges: -7.7% for AGIs below $10k, 0.6% for AGIs $10k-25k, -0.2% for AGIs $25k-50k, 0.6% for AGIs $50k-75k, 0.7% for AGIs $75k-100k, 8.0% for AGIs over 100k)
Profit/loss from business: +$12,429 (reported on 18.0% of returns)
Here:
+$12,429
State:
+$9,144
(% of AGI for various income ranges: 15.1% for AGIs below $10k, 5.3% for AGIs $10k-25k, 4.6% for AGIs $25k-50k, 3.1% for AGIs $50k-75k, 2.1% for AGIs $75k-100k, 3.0% for AGIs over 100k)
IRA payment deduction: $3,170 (reported on 3.6% of returns)
29708:
$3,170
South Carolina:
$2,972
(% of AGI for various income ranges: 0.6% for AGIs $10k-25k, 0.3% for AGIs $25k-50k, 0.2% for AGIs $50k-75k, 0.2% for AGIs $75k-100k, 0.1% for AGIs over 100k)
Self-employed pension: $13,022 (reported on 1.3% of returns)
Here:
$13,022
South Carolina:
$15,117
(% of AGI for various income ranges: 0.1% for AGIs $50k-75k, 0.1% for AGIs $75k-100k, 0.3% for AGIs over 100k)
Total itemized deductions: $22,276 (22% of AGI, reported on 64.6% of returns)
Here:
$22,276
State:
$19,039
Here:
22.3% of AGI
State:
22.8% of AGI
(% of AGI for various income ranges: 52.4% for AGIs below $10k, 22.4% for AGIs $10k-25k, 22.6% for AGIs $25k-50k, 23.3% for AGIs $50k-75k, 22.4% for AGIs $75k-100k, 17.7% for AGIs over 100k)
Charity contributions deductions: $3,625 (4% of AGI, reported on 58.9% of returns)
Here:
$3,625
State:
$4,305
Here:
3.5% of AGI
State:
5.0% of AGI
(% of AGI for various income ranges: 3.2% for AGIs below $10k, 2.5% for AGIs $10k-25k, 2.9% for AGIs $25k-50k, 2.8% for AGIs $50k-75k, 3.0% for AGIs $75k-100k, 3.0% for AGIs over 100k)
Total tax: $10,718 (reported on 83.0% of returns)
29708:
$10,718
State:
$6,497
(% of AGI for various income ranges: 8.9% for AGIs below $10k, 4.6% for AGIs $10k-25k, 6.8% for AGIs $25k-50k, 8.0% for AGIs $50k-75k, 9.0% for AGIs $75k-100k, 15.9% for AGIs over 100k)
Earned income credit: $1,460 (reported on 5.8% of returns)
Here:
$1,460
State:
$1,882
Percentage of individuals using paid preparers for their 2004 taxes: 61.0%
Here:
61%
State:
66%
(% for various income ranges: 49.9% for AGIs below $10k, 66.3% for AGIs $10k-25k, 64.8% for AGIs $25k-50k, 62.9% for AGIs $50k-75k, 60.7% for AGIs $75k-100k, 62.1% for AGIs over 100k)
Likely homosexual households (counted as self-reported same-sex unmarried-partner households)
Lesbian couples: 0.1% of all households
Gay men: 0.2% of all households
Household received Food Stamps/SNAP in the past 12 months: 468 Household did not receive Food Stamps/SNAP in the past 12 months: 15,942
Women who had a birth in the past 12 months: 449 (452 now married, 21 unmarried) Women who did not have a birth in the past 12 months: 10,091 (6,202 now married, 3,961 unmarried)
Housing units in zip code 29708 with a mortgage: 9,640 (870 second mortgage, 17 home equity loan, 774 both second mortgage and home equity loan) Houses without a mortgage: 248
Median monthly owner costs for units with a mortgage: $2,201 Median monthly owner costs for units without a mortgage: $535
Residents with income below the poverty level in 2022:
This zip code:
3.0%
Whole state:
14.0%
Residents with income below 50% of the poverty level in 2022:
This zip code:
1.5%
Whole state:
7.3%
Median number of rooms in houses and condos:
Here:
7.8
State:
6.4
Median number of rooms in apartments:
Here:
4.2
State:
4.5
Notable locations in this zip code not listed on our city pages
Notable locations in zip code 29708: Grey Rock Golf Course (A), Flint Hill Fire Department Station 2 (B), Tega Cay Fire Department (C), Riverview Fire Department (D). Display/hide their locations on the map
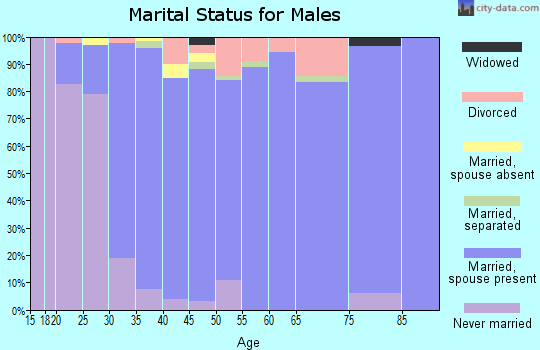
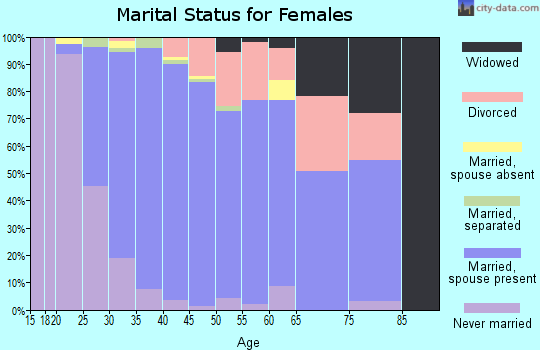
9,427 married couples with children.
1,442 single-parent households (410 men, 1,032 women).
85.6% of residents of 29708 zip code speak English at home.
5.7% of residents speak Spanish at home (60% very well, 34% well, 6% not well).
6.6% of residents speak other Indo-European language at home (87% very well, 7% well, 5% not well).
2.6% of residents speak Asian or Pacific Island language at home (77% very well, 12% well, 11% not well).
0.1% of residents speak other language at home (100% very well).
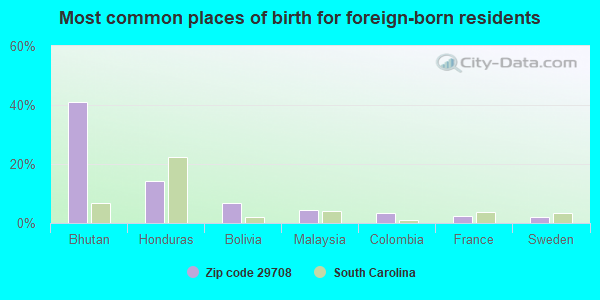
Foreign born population: 5,057 (11.7%) (50.1% of them are naturalized citizens)
This zip code:
11.7%
Whole state:
5.2%
41%Bhutan
14%Honduras
7%Bolivia
4%Malaysia
3%Colombia
2%France
2%Sweden
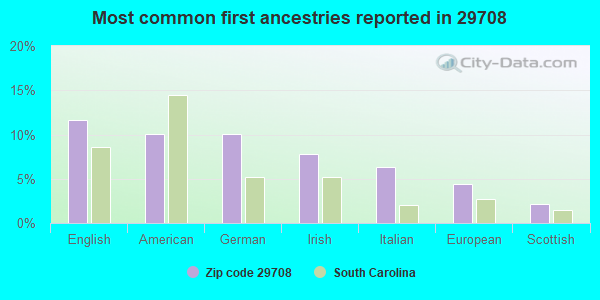
12%English
10%American
10%German
8%Irish
6%Italian
4%European
2%Scottish
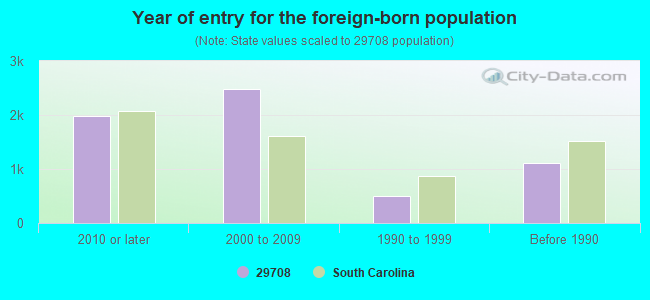
Year of entry for the foreign-born population
1,9752010 or later
2,4732000 to 2009
5081990 to 1999
1,108Before 1990
Facilities with environmental interests located in this zip code:
CROMPTON CORPORATION (600 GREENWAY INDUSTRIAL DRIVE in FORT MILL, SC)
Small Quantity Generators, between 100 kg and 1000 kg of hazardous waste/month (Resource Conservation and Recovery Act (tracking hazardous waste)) STATE MASTER (South Carolina database) - HAZARDOUS WASTE PROGRAM Organizations: USCO DISTRIBUTION SERVICES INC (CONTACT/OPERATOR)
, KUEHNE & NOGEL INVESTMENT INC (CONTACT/OWNER)
, LAGISCO WAREHOUSE (CONTACT/OWNER)
Alternative names: USCO DISTRIBUTION SERVICES INC
ASCO VALVE MANUFACTURING INC (460 GREENWAY INDUSTRIAL DR #J in FORT MILL, SC)
AIR MINOR (AIRS/AFS) STATE MASTER (South Carolina database) - AIR PROGRAM Business SIC classification: SERVICES
CELANESE ADVANCED MATERIALS INC (460 GREENWAY INDUSTRIAL DR STE E in FORT MILL, SC)
AIR MINOR (AIRS/AFS) STATE MASTER (South Carolina database) - AIR PROGRAM Business SIC classification: SERVICES Alternative names: CELANESE AMI
Housing units lacking complete plumbing facilities: 0.4% Housing units lacking complete kitchen facilities: 1.4%
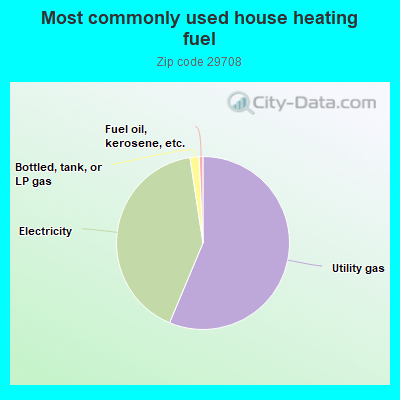
56.1%Utility gas
41.1%Electricity
1.7%Bottled, tank, or LP gas
0.7%Fuel oil, kerosene, etc.
Place of birth for U.S.-born residents:
This state: 5,484
Northeast: 10,601
Midwest: 4,747
South: 14,723
West: 2,671
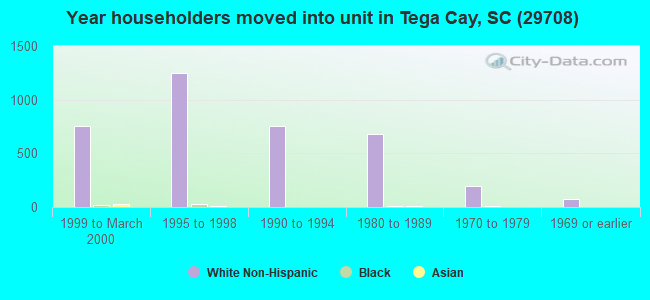
48% of the 29708 zip code residents lived in the same house 5 years ago. Out of people who lived in different houses, 30% lived in this county. Out of people who lived in different counties, 50% lived in South Carolina.
86% of the 29708 zip code residents lived in the same house 1 year ago. Out of people who lived in different houses, 26% moved from this county. Out of people who lived in different houses, 20% moved from different county within same state. Out of people who lived in different houses, 54% moved from different state. Out of people who lived in different houses, 5% moved from abroad.
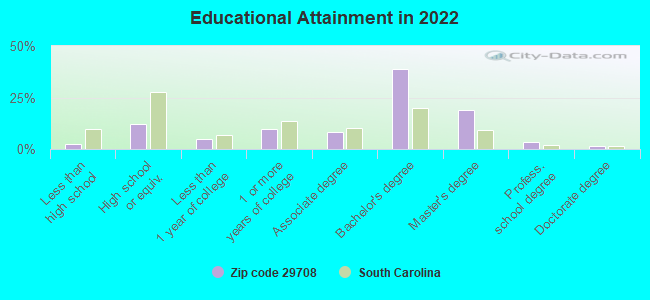
Private vs. public school enrollment:
Students in private schools in grades 1 to 8 (elementary and middle school): 564
Here:
10.3%
South Carolina:
14.4%
Students in private schools in grades 9 to 12 (high school): 132
Here:
6.1%
South Carolina:
11.1%
Students in private undergraduate colleges: 47
Here:
4.3%
South Carolina:
21.9%
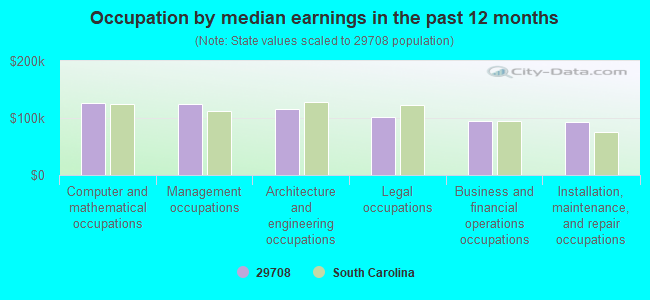
Occupation by median earnings in the past 12 months ($)
127,007Computer and mathematical occupations
125,161Management occupations
115,976Architecture and engineering occupations
101,149Legal occupations
95,105Business and financial operations occupations
93,435Installation, maintenance, and repair occupations
Companies with federal contracts located in this zip code:
MUZAK LLC (3318 LAKEMONT BLVD in FORT MILL, SC; small business) : $300,344 in 71 contractsfrom 2002 to 2006
Contracts for Maintenance, Repair or Alteration of Real Property -- Office Buildings, ADP Telecommunications and Transmission Services, Lease or Rental of Equipment -- Musical Instruments, Phonographs, and Home-Type Radios, Telephone and/or Communications Services (includes Telegraph, Telex, and Cablevision Services), and moreby Army, Centers for Disease Control and Prevention, Air Force, Internal Revenue Service, and others Signed by year:2000: $0; 2001: $0; 2002: $53,507; 2003: $47,855; 2004: $47,367; 2005: $132,317; 2006: $19,298.
Biggest contracts:
$43,108 with Army for Maintenance, Repair or Alteration of Real Property -- Office Buildings. Taking place in GA. Signed on 2002-05-17. Completion date: 2002-07-16.
$34,848 with Centers for Disease Control and Prevention for ADP Telecommunications and Transmission Services. Signed on 2005-11-17. Effective on 2005-10-01. Completion date: 2006-09-30.
$34,848 with Centers for Disease Control and Prevention for Lease or Rental of Equipment -- Musical Instruments, Phonographs, and Home-Type Radios. Taking place in GA. Signed on 2005-04-08. Completion date: 2005-09-30.
$26,608 with Air Force for Telephone and/or Communications Services (includes Telegraph, Telex, and Cablevision Services). Taking place in CO. Signed on 2003-10-01. Completion date: 2004-09-30.
SIGMA PRODUCTS AND MANUFACTURI (3324 BLUE JAY PASS in FORT MILL, SC; small business) : $289,091 in 13 contractsfrom 2003 to 2006
Contracts for Hazard-Detecting Instruments and Apparatus, Pressure, Temperature, and Humidity Measuring and Controlling Instruments, Laboratory Equipment and Supplies by Defense Logistics Agency, Army Signed by year:2000: $0; 2001: $0; 2002: $0; 2003: $23,630; 2004: $5,375; 2005: $181,889; 2006: $78,197.
Biggest contracts:
$109,750 with Defense Logistics Agency for Hazard-Detecting Instruments and Apparatus. Signed on 2005-07-02. Completion date: 2005-09-04.
$42,473, same as above.Signed on 2006-03-02. Completion date: 2006-04-30.
$30,181, same as above.Signed on 2005-08-11. Completion date: 2005-10-10.
$28,500 with Army for Pressure, Temperature, and Humidity Measuring and Controlling Instruments. Signed on 2005-08-31. Completion date: 2005-09-12.
Top industries in this zip code by the number of employees in 2005:
Management of Companies and Enterprises: Corporate, Subsidiary, and Regional Managing Offices (250-499 employees: 1 establishment, 10-19 employees: 2 establishments)
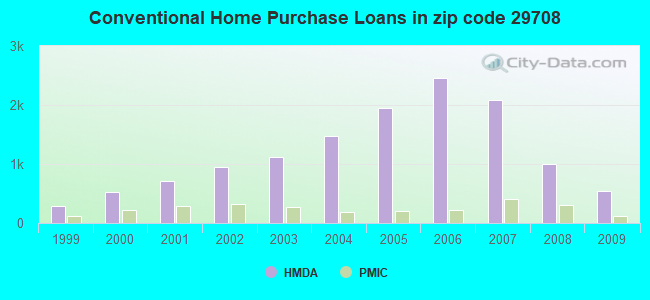
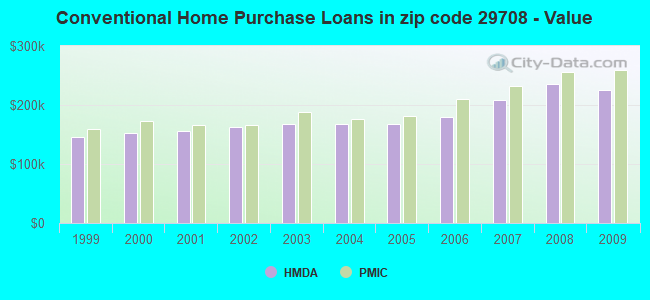
Detailed PMIC statistics for the following Tracts:0610.01
, 0610.02
2009 - 2018 National Fire Incident Reporting System (NFIRS) incidents
According to the data from the years 2009 - 2018 the average number of fires per year is 36. The highest number of reported fire incidents - 69 took place in 2017, and the least - 3 in 2009. The data has an increasing trend.
When looking into fire subcategories, the most reports belonged to: Structure Fires (40.1%), and Outside Fires (35.1%).
Fire incident types reported to NFIRS in Zip Code 29708


 Nearest zip codes: 29715, 28278, 28273, 28134, 29733, 29732.


 According to the data from the years 2009 - 2018 the average number of fires per year is 36. The highest number of reported fire incidents - 69 took place in 2017, and the least - 3 in 2009. The data has an increasing trend.
 When looking into fire subcategories, the most reports belonged to: Structure Fires (40.1%), and Outside Fires (35.1%).