Fort Mill, South Carolina Submit your own pictures of this town and show them to the world
OSM Map
General Map
Google Map
MSN Map
OSM Map
General Map
Google Map
MSN Map
OSM Map
General Map
Google Map
MSN Map
OSM Map
General Map
Google Map
MSN Map
Please wait while loading the map...
Population in 2022: 30,940 (99% urban, 1% rural). Population change since 2000: +307.8%Males: 14,959 Females: 15,981
March 2022 cost of living index in Fort Mill: 92.4 (less than average, U.S. average is 100) Percentage of residents living in poverty in 2022: 4.6%for White Non-Hispanic residents , 6.4% for Black residents , 14.8% for Hispanic or Latino residents , 29.2% for American Indian residents , 100.0% for Native Hawaiian and other Pacific Islander residents , 33.7% for other race residents )
Profiles of local businesses
Business Search - 14 Million verified businesses
Data:
Median household income ($)
Median household income (% change since 2000)
Household income diversity
Ratio of average income to average house value (%)
Ratio of average income to average rent
Median household income ($) - White
Median household income ($) - Black or African American
Median household income ($) - Asian
Median household income ($) - Hispanic or Latino
Median household income ($) - American Indian and Alaska Native
Median household income ($) - Multirace
Median household income ($) - Other Race
Median household income for houses/condos with a mortgage ($)
Median household income for apartments without a mortgage ($)
Races - White alone (%)
Races - White alone (% change since 2000)
Races - Black alone (%)
Races - Black alone (% change since 2000)
Races - American Indian alone (%)
Races - American Indian alone (% change since 2000)
Races - Asian alone (%)
Races - Asian alone (% change since 2000)
Races - Hispanic (%)
Races - Hispanic (% change since 2000)
Races - Native Hawaiian and Other Pacific Islander alone (%)
Races - Native Hawaiian and Other Pacific Islander alone (% change since 2000)
Races - Two or more races (%)
Races - Two or more races (% change since 2000)
Races - Other race alone (%)
Races - Other race alone (% change since 2000)
Racial diversity
Unemployment (%)
Unemployment (% change since 2000)
Unemployment (%) - White
Unemployment (%) - Black or African American
Unemployment (%) - Asian
Unemployment (%) - Hispanic or Latino
Unemployment (%) - American Indian and Alaska Native
Unemployment (%) - Multirace
Unemployment (%) - Other Race
Population density (people per square mile)
Population - Males (%)
Population - Females (%)
Population - Males (%) - White
Population - Males (%) - Black or African American
Population - Males (%) - Asian
Population - Males (%) - Hispanic or Latino
Population - Males (%) - American Indian and Alaska Native
Population - Males (%) - Multirace
Population - Males (%) - Other Race
Population - Females (%) - White
Population - Females (%) - Black or African American
Population - Females (%) - Asian
Population - Females (%) - Hispanic or Latino
Population - Females (%) - American Indian and Alaska Native
Population - Females (%) - Multirace
Population - Females (%) - Other Race
Coronavirus confirmed cases (Apr 27, 2024)
Deaths caused by coronavirus (Apr 27, 2024)
Coronavirus confirmed cases (per 100k population) (Apr 27, 2024)
Deaths caused by coronavirus (per 100k population) (Apr 27, 2024)
Daily increase in number of cases (Apr 27, 2024)
Weekly increase in number of cases (Apr 27, 2024)
Cases doubled (in days) (Apr 27, 2024)
Hospitalized patients (Apr 18, 2022)
Negative test results (Apr 18, 2022)
Total test results (Apr 18, 2022)
COVID Vaccine doses distributed (per 100k population) (Sep 19, 2023)
COVID Vaccine doses administered (per 100k population) (Sep 19, 2023)
COVID Vaccine doses distributed (Sep 19, 2023)
COVID Vaccine doses administered (Sep 19, 2023)
Likely homosexual households (%)
Likely homosexual households (% change since 2000)
Likely homosexual households - Lesbian couples (%)
Likely homosexual households - Lesbian couples (% change since 2000)
Likely homosexual households - Gay men (%)
Likely homosexual households - Gay men (% change since 2000)
Cost of living index
Median gross rent ($)
Median contract rent ($)
Median monthly housing costs ($)
Median house or condo value ($)
Median house or condo value ($ change since 2000)
Mean house or condo value by units in structure - 1, detached ($)
Mean house or condo value by units in structure - 1, attached ($)
Mean house or condo value by units in structure - 2 ($)
Mean house or condo value by units in structure by units in structure - 3 or 4 ($)
Mean house or condo value by units in structure - 5 or more ($)
Mean house or condo value by units in structure - Boat, RV, van, etc. ($)
Mean house or condo value by units in structure - Mobile home ($)
Median house or condo value ($) - White
Median house or condo value ($) - Black or African American
Median house or condo value ($) - Asian
Median house or condo value ($) - Hispanic or Latino
Median house or condo value ($) - American Indian and Alaska Native
Median house or condo value ($) - Multirace
Median house or condo value ($) - Other Race
Median resident age
Resident age diversity
Median resident age - Males
Median resident age - Females
Median resident age - White
Median resident age - Black or African American
Median resident age - Asian
Median resident age - Hispanic or Latino
Median resident age - American Indian and Alaska Native
Median resident age - Multirace
Median resident age - Other Race
Median resident age - Males - White
Median resident age - Males - Black or African American
Median resident age - Males - Asian
Median resident age - Males - Hispanic or Latino
Median resident age - Males - American Indian and Alaska Native
Median resident age - Males - Multirace
Median resident age - Males - Other Race
Median resident age - Females - White
Median resident age - Females - Black or African American
Median resident age - Females - Asian
Median resident age - Females - Hispanic or Latino
Median resident age - Females - American Indian and Alaska Native
Median resident age - Females - Multirace
Median resident age - Females - Other Race
Commute - mean travel time to work (minutes)
Travel time to work - Less than 5 minutes (%)
Travel time to work - Less than 5 minutes (% change since 2000)
Travel time to work - 5 to 9 minutes (%)
Travel time to work - 5 to 9 minutes (% change since 2000)
Travel time to work - 10 to 19 minutes (%)
Travel time to work - 10 to 19 minutes (% change since 2000)
Travel time to work - 20 to 29 minutes (%)
Travel time to work - 20 to 29 minutes (% change since 2000)
Travel time to work - 30 to 39 minutes (%)
Travel time to work - 30 to 39 minutes (% change since 2000)
Travel time to work - 40 to 59 minutes (%)
Travel time to work - 40 to 59 minutes (% change since 2000)
Travel time to work - 60 to 89 minutes (%)
Travel time to work - 60 to 89 minutes (% change since 2000)
Travel time to work - 90 or more minutes (%)
Travel time to work - 90 or more minutes (% change since 2000)
Marital status - Never married (%)
Marital status - Now married (%)
Marital status - Separated (%)
Marital status - Widowed (%)
Marital status - Divorced (%)
Median family income ($)
Median family income (% change since 2000)
Median non-family income ($)
Median non-family income (% change since 2000)
Median per capita income ($)
Median per capita income (% change since 2000)
Median family income ($) - White
Median family income ($) - Black or African American
Median family income ($) - Asian
Median family income ($) - Hispanic or Latino
Median family income ($) - American Indian and Alaska Native
Median family income ($) - Multirace
Median family income ($) - Other Race
Median year house/condo built
Median year apartment built
Year house built - Built 2005 or later (%)
Year house built - Built 2000 to 2004 (%)
Year house built - Built 1990 to 1999 (%)
Year house built - Built 1980 to 1989 (%)
Year house built - Built 1970 to 1979 (%)
Year house built - Built 1960 to 1969 (%)
Year house built - Built 1950 to 1959 (%)
Year house built - Built 1940 to 1949 (%)
Year house built - Built 1939 or earlier (%)
Average household size
Household density (households per square mile)
Average household size - White
Average household size - Black or African American
Average household size - Asian
Average household size - Hispanic or Latino
Average household size - American Indian and Alaska Native
Average household size - Multirace
Average household size - Other Race
Occupied housing units (%)
Vacant housing units (%)
Owner occupied housing units (%)
Renter occupied housing units (%)
Vacancy status - For rent (%)
Vacancy status - For sale only (%)
Vacancy status - Rented or sold, not occupied (%)
Vacancy status - For seasonal, recreational, or occasional use (%)
Vacancy status - For migrant workers (%)
Vacancy status - Other vacant (%)
Residents with income below the poverty level (%)
Residents with income below 50% of the poverty level (%)
Children below poverty level (%)
Poor families by family type - Married-couple family (%)
Poor families by family type - Male, no wife present (%)
Poor families by family type - Female, no husband present (%)
Poverty status for native-born residents (%)
Poverty status for foreign-born residents (%)
Poverty among high school graduates not in families (%)
Poverty among people who did not graduate high school not in families (%)
Residents with income below the poverty level (%) - White
Residents with income below the poverty level (%) - Black or African American
Residents with income below the poverty level (%) - Asian
Residents with income below the poverty level (%) - Hispanic or Latino
Residents with income below the poverty level (%) - American Indian and Alaska Native
Residents with income below the poverty level (%) - Multirace
Residents with income below the poverty level (%) - Other Race
Air pollution - Air Quality Index (AQI)
Air pollution - CO
Air pollution - NO2
Air pollution - SO2
Air pollution - Ozone
Air pollution - PM10
Air pollution - PM25
Air pollution - Pb
Crime - Murders per 100,000 population
Crime - Rapes per 100,000 population
Crime - Robberies per 100,000 population
Crime - Assaults per 100,000 population
Crime - Burglaries per 100,000 population
Crime - Thefts per 100,000 population
Crime - Auto thefts per 100,000 population
Crime - Arson per 100,000 population
Crime - City-data.com crime index
Crime - Violent crime index
Crime - Property crime index
Crime - Murders per 100,000 population (5 year average)
Crime - Rapes per 100,000 population (5 year average)
Crime - Robberies per 100,000 population (5 year average)
Crime - Assaults per 100,000 population (5 year average)
Crime - Burglaries per 100,000 population (5 year average)
Crime - Thefts per 100,000 population (5 year average)
Crime - Auto thefts per 100,000 population (5 year average)
Crime - Arson per 100,000 population (5 year average)
Crime - City-data.com crime index (5 year average)
Crime - Violent crime index (5 year average)
Crime - Property crime index (5 year average)
1996 Presidential Elections Results (%) - Democratic Party (Clinton)
1996 Presidential Elections Results (%) - Republican Party (Dole)
1996 Presidential Elections Results (%) - Other
2000 Presidential Elections Results (%) - Democratic Party (Gore)
2000 Presidential Elections Results (%) - Republican Party (Bush)
2000 Presidential Elections Results (%) - Other
2004 Presidential Elections Results (%) - Democratic Party (Kerry)
2004 Presidential Elections Results (%) - Republican Party (Bush)
2004 Presidential Elections Results (%) - Other
2008 Presidential Elections Results (%) - Democratic Party (Obama)
2008 Presidential Elections Results (%) - Republican Party (McCain)
2008 Presidential Elections Results (%) - Other
2012 Presidential Elections Results (%) - Democratic Party (Obama)
2012 Presidential Elections Results (%) - Republican Party (Romney)
2012 Presidential Elections Results (%) - Other
2016 Presidential Elections Results (%) - Democratic Party (Clinton)
2016 Presidential Elections Results (%) - Republican Party (Trump)
2016 Presidential Elections Results (%) - Other
2020 Presidential Elections Results (%) - Democratic Party (Biden)
2020 Presidential Elections Results (%) - Republican Party (Trump)
2020 Presidential Elections Results (%) - Other
Ancestries Reported - Arab (%)
Ancestries Reported - Czech (%)
Ancestries Reported - Danish (%)
Ancestries Reported - Dutch (%)
Ancestries Reported - English (%)
Ancestries Reported - French (%)
Ancestries Reported - French Canadian (%)
Ancestries Reported - German (%)
Ancestries Reported - Greek (%)
Ancestries Reported - Hungarian (%)
Ancestries Reported - Irish (%)
Ancestries Reported - Italian (%)
Ancestries Reported - Lithuanian (%)
Ancestries Reported - Norwegian (%)
Ancestries Reported - Polish (%)
Ancestries Reported - Portuguese (%)
Ancestries Reported - Russian (%)
Ancestries Reported - Scotch-Irish (%)
Ancestries Reported - Scottish (%)
Ancestries Reported - Slovak (%)
Ancestries Reported - Subsaharan African (%)
Ancestries Reported - Swedish (%)
Ancestries Reported - Swiss (%)
Ancestries Reported - Ukrainian (%)
Ancestries Reported - United States (%)
Ancestries Reported - Welsh (%)
Ancestries Reported - West Indian (%)
Ancestries Reported - Other (%)
Educational Attainment - No schooling completed (%)
Educational Attainment - Less than high school (%)
Educational Attainment - High school or equivalent (%)
Educational Attainment - Less than 1 year of college (%)
Educational Attainment - 1 or more years of college (%)
Educational Attainment - Associate degree (%)
Educational Attainment - Bachelor's degree (%)
Educational Attainment - Master's degree (%)
Educational Attainment - Professional school degree (%)
Educational Attainment - Doctorate degree (%)
School Enrollment - Nursery, preschool (%)
School Enrollment - Kindergarten (%)
School Enrollment - Grade 1 to 4 (%)
School Enrollment - Grade 5 to 8 (%)
School Enrollment - Grade 9 to 12 (%)
School Enrollment - College undergrad (%)
School Enrollment - Graduate or professional (%)
School Enrollment - Not enrolled in school (%)
School enrollment - Public schools (%)
School enrollment - Private schools (%)
School enrollment - Not enrolled (%)
Median number of rooms in houses and condos
Median number of rooms in apartments
Housing units lacking complete plumbing facilities (%)
Housing units lacking complete kitchen facilities (%)
Density of houses
Urban houses (%)
Rural houses (%)
Households with people 60 years and over (%)
Households with people 65 years and over (%)
Households with people 75 years and over (%)
Households with one or more nonrelatives (%)
Households with no nonrelatives (%)
Population in households (%)
Family households (%)
Nonfamily households (%)
Population in families (%)
Family households with own children (%)
Median number of bedrooms in owner occupied houses
Mean number of bedrooms in owner occupied houses
Median number of bedrooms in renter occupied houses
Mean number of bedrooms in renter occupied houses
Median number of vehichles in owner occupied houses
Mean number of vehichles in owner occupied houses
Median number of vehichles in renter occupied houses
Mean number of vehichles in renter occupied houses
Mortgage status - with mortgage (%)
Mortgage status - with second mortgage (%)
Mortgage status - with home equity loan (%)
Mortgage status - with both second mortgage and home equity loan (%)
Mortgage status - without a mortgage (%)
Average family size
Average family size - White
Average family size - Black or African American
Average family size - Asian
Average family size - Hispanic or Latino
Average family size - American Indian and Alaska Native
Average family size - Multirace
Average family size - Other Race
Geographical mobility - Same house 1 year ago (%)
Geographical mobility - Moved within same county (%)
Geographical mobility - Moved from different county within same state (%)
Geographical mobility - Moved from different state (%)
Geographical mobility - Moved from abroad (%)
Place of birth - Born in state of residence (%)
Place of birth - Born in other state (%)
Place of birth - Native, outside of US (%)
Place of birth - Foreign born (%)
Housing units in structures - 1, detached (%)
Housing units in structures - 1, attached (%)
Housing units in structures - 2 (%)
Housing units in structures - 3 or 4 (%)
Housing units in structures - 5 to 9 (%)
Housing units in structures - 10 to 19 (%)
Housing units in structures - 20 to 49 (%)
Housing units in structures - 50 or more (%)
Housing units in structures - Mobile home (%)
Housing units in structures - Boat, RV, van, etc. (%)
House/condo owner moved in on average (years ago)
Renter moved in on average (years ago)
Year householder moved into unit - Moved in 1999 to March 2000 (%)
Year householder moved into unit - Moved in 1995 to 1998 (%)
Year householder moved into unit - Moved in 1990 to 1994 (%)
Year householder moved into unit - Moved in 1980 to 1989 (%)
Year householder moved into unit - Moved in 1970 to 1979 (%)
Year householder moved into unit - Moved in 1969 or earlier (%)
Means of transportation to work - Drove car alone (%)
Means of transportation to work - Carpooled (%)
Means of transportation to work - Public transportation (%)
Means of transportation to work - Bus or trolley bus (%)
Means of transportation to work - Streetcar or trolley car (%)
Means of transportation to work - Subway or elevated (%)
Means of transportation to work - Railroad (%)
Means of transportation to work - Ferryboat (%)
Means of transportation to work - Taxicab (%)
Means of transportation to work - Motorcycle (%)
Means of transportation to work - Bicycle (%)
Means of transportation to work - Walked (%)
Means of transportation to work - Other means (%)
Working at home (%)
Industry diversity
Most Common Industries - Agriculture, forestry, fishing and hunting, and mining (%)
Most Common Industries - Agriculture, forestry, fishing and hunting (%)
Most Common Industries - Mining, quarrying, and oil and gas extraction (%)
Most Common Industries - Construction (%)
Most Common Industries - Manufacturing (%)
Most Common Industries - Wholesale trade (%)
Most Common Industries - Retail trade (%)
Most Common Industries - Transportation and warehousing, and utilities (%)
Most Common Industries - Transportation and warehousing (%)
Most Common Industries - Utilities (%)
Most Common Industries - Information (%)
Most Common Industries - Finance and insurance, and real estate and rental and leasing (%)
Most Common Industries - Finance and insurance (%)
Most Common Industries - Real estate and rental and leasing (%)
Most Common Industries - Professional, scientific, and management, and administrative and waste management services (%)
Most Common Industries - Professional, scientific, and technical services (%)
Most Common Industries - Management of companies and enterprises (%)
Most Common Industries - Administrative and support and waste management services (%)
Most Common Industries - Educational services, and health care and social assistance (%)
Most Common Industries - Educational services (%)
Most Common Industries - Health care and social assistance (%)
Most Common Industries - Arts, entertainment, and recreation, and accommodation and food services (%)
Most Common Industries - Arts, entertainment, and recreation (%)
Most Common Industries - Accommodation and food services (%)
Most Common Industries - Other services, except public administration (%)
Most Common Industries - Public administration (%)
Occupation diversity
Most Common Occupations - Management, business, science, and arts occupations (%)
Most Common Occupations - Management, business, and financial occupations (%)
Most Common Occupations - Management occupations (%)
Most Common Occupations - Business and financial operations occupations (%)
Most Common Occupations - Computer, engineering, and science occupations (%)
Most Common Occupations - Computer and mathematical occupations (%)
Most Common Occupations - Architecture and engineering occupations (%)
Most Common Occupations - Life, physical, and social science occupations (%)
Most Common Occupations - Education, legal, community service, arts, and media occupations (%)
Most Common Occupations - Community and social service occupations (%)
Most Common Occupations - Legal occupations (%)
Most Common Occupations - Education, training, and library occupations (%)
Most Common Occupations - Arts, design, entertainment, sports, and media occupations (%)
Most Common Occupations - Healthcare practitioners and technical occupations (%)
Most Common Occupations - Health diagnosing and treating practitioners and other technical occupations (%)
Most Common Occupations - Health technologists and technicians (%)
Most Common Occupations - Service occupations (%)
Most Common Occupations - Healthcare support occupations (%)
Most Common Occupations - Protective service occupations (%)
Most Common Occupations - Fire fighting and prevention, and other protective service workers including supervisors (%)
Most Common Occupations - Law enforcement workers including supervisors (%)
Most Common Occupations - Food preparation and serving related occupations (%)
Most Common Occupations - Building and grounds cleaning and maintenance occupations (%)
Most Common Occupations - Personal care and service occupations (%)
Most Common Occupations - Sales and office occupations (%)
Most Common Occupations - Sales and related occupations (%)
Most Common Occupations - Office and administrative support occupations (%)
Most Common Occupations - Natural resources, construction, and maintenance occupations (%)
Most Common Occupations - Farming, fishing, and forestry occupations (%)
Most Common Occupations - Construction and extraction occupations (%)
Most Common Occupations - Installation, maintenance, and repair occupations (%)
Most Common Occupations - Production, transportation, and material moving occupations (%)
Most Common Occupations - Production occupations (%)
Most Common Occupations - Transportation occupations (%)
Most Common Occupations - Material moving occupations (%)
People in Group quarters - Institutionalized population (%)
People in Group quarters - Correctional institutions (%)
People in Group quarters - Federal prisons and detention centers (%)
People in Group quarters - Halfway houses (%)
People in Group quarters - Local jails and other confinement facilities (including police lockups) (%)
People in Group quarters - Military disciplinary barracks (%)
People in Group quarters - State prisons (%)
People in Group quarters - Other types of correctional institutions (%)
People in Group quarters - Nursing homes (%)
People in Group quarters - Hospitals/wards, hospices, and schools for the handicapped (%)
People in Group quarters - Hospitals/wards and hospices for chronically ill (%)
People in Group quarters - Hospices or homes for chronically ill (%)
People in Group quarters - Military hospitals or wards for chronically ill (%)
People in Group quarters - Other hospitals or wards for chronically ill (%)
People in Group quarters - Hospitals or wards for drug/alcohol abuse (%)
People in Group quarters - Mental (Psychiatric) hospitals or wards (%)
People in Group quarters - Schools, hospitals, or wards for the mentally retarded (%)
People in Group quarters - Schools, hospitals, or wards for the physically handicapped (%)
People in Group quarters - Institutions for the deaf (%)
People in Group quarters - Institutions for the blind (%)
People in Group quarters - Orthopedic wards and institutions for the physically handicapped (%)
People in Group quarters - Wards in general hospitals for patients who have no usual home elsewhere (%)
People in Group quarters - Wards in military hospitals for patients who have no usual home elsewhere (%)
People in Group quarters - Juvenile institutions (%)
People in Group quarters - Long-term care (%)
People in Group quarters - Homes for abused, dependent, and neglected children (%)
People in Group quarters - Residential treatment centers for emotionally disturbed children (%)
People in Group quarters - Training schools for juvenile delinquents (%)
People in Group quarters - Short-term care, detention or diagnostic centers for delinquent children (%)
People in Group quarters - Type of juvenile institution unknown (%)
People in Group quarters - Noninstitutionalized population (%)
People in Group quarters - College dormitories (includes college quarters off campus) (%)
People in Group quarters - Military quarters (%)
People in Group quarters - On base (%)
People in Group quarters - Barracks, unaccompanied personnel housing (UPH), (Enlisted/Officer), ;and similar group living quarters for military personnel (%)
People in Group quarters - Transient quarters for temporary residents (%)
People in Group quarters - Military ships (%)
People in Group quarters - Group homes (%)
People in Group quarters - Homes or halfway houses for drug/alcohol abuse (%)
People in Group quarters - Homes for the mentally ill (%)
People in Group quarters - Homes for the mentally retarded (%)
People in Group quarters - Homes for the physically handicapped (%)
People in Group quarters - Other group homes (%)
People in Group quarters - Religious group quarters (%)
People in Group quarters - Dormitories (%)
People in Group quarters - Agriculture workers' dormitories on farms (%)
People in Group quarters - Job Corps and vocational training facilities (%)
People in Group quarters - Other workers' dormitories (%)
People in Group quarters - Crews of maritime vessels (%)
People in Group quarters - Other nonhousehold living situations (%)
People in Group quarters - Other noninstitutional group quarters (%)
Residents speaking English at home (%)
Residents speaking English at home - Born in the United States (%)
Residents speaking English at home - Native, born elsewhere (%)
Residents speaking English at home - Foreign born (%)
Residents speaking Spanish at home (%)
Residents speaking Spanish at home - Born in the United States (%)
Residents speaking Spanish at home - Native, born elsewhere (%)
Residents speaking Spanish at home - Foreign born (%)
Residents speaking other language at home (%)
Residents speaking other language at home - Born in the United States (%)
Residents speaking other language at home - Native, born elsewhere (%)
Residents speaking other language at home - Foreign born (%)
Class of Workers - Employee of private company (%)
Class of Workers - Self-employed in own incorporated business (%)
Class of Workers - Private not-for-profit wage and salary workers (%)
Class of Workers - Local government workers (%)
Class of Workers - State government workers (%)
Class of Workers - Federal government workers (%)
Class of Workers - Self-employed workers in own not incorporated business and Unpaid family workers (%)
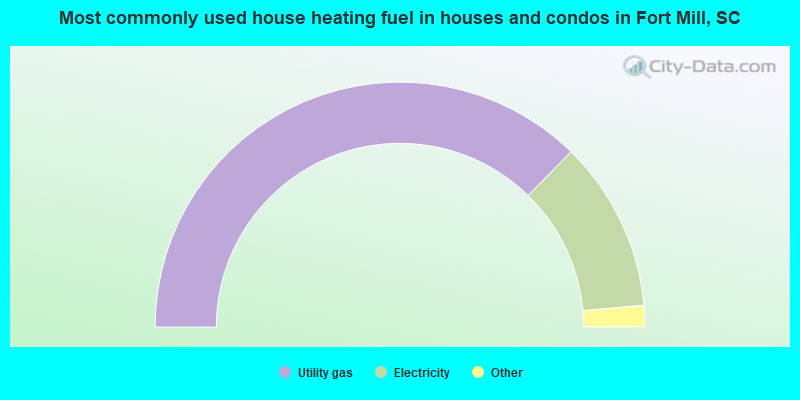
House heating fuel used in houses and condos - Utility gas (%)
House heating fuel used in houses and condos - Bottled, tank, or LP gas (%)
House heating fuel used in houses and condos - Electricity (%)
House heating fuel used in houses and condos - Fuel oil, kerosene, etc. (%)
House heating fuel used in houses and condos - Coal or coke (%)
House heating fuel used in houses and condos - Wood (%)
House heating fuel used in houses and condos - Solar energy (%)
House heating fuel used in houses and condos - Other fuel (%)
House heating fuel used in houses and condos - No fuel used (%)
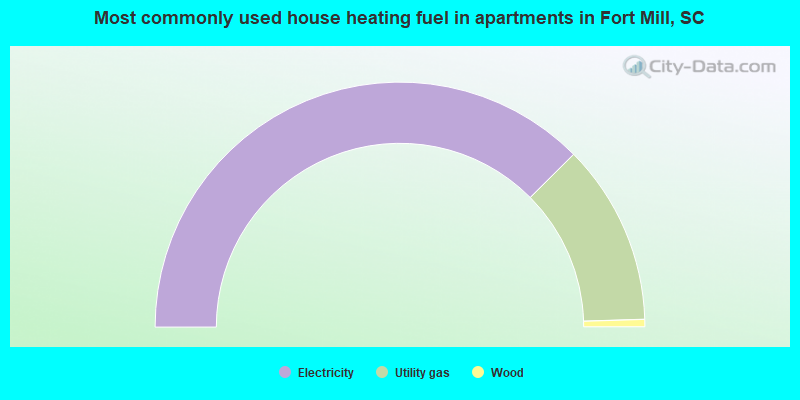
House heating fuel used in apartments - Utility gas (%)
House heating fuel used in apartments - Bottled, tank, or LP gas (%)
House heating fuel used in apartments - Electricity (%)
House heating fuel used in apartments - Fuel oil, kerosene, etc. (%)
House heating fuel used in apartments - Coal or coke (%)
House heating fuel used in apartments - Wood (%)
House heating fuel used in apartments - Solar energy (%)
House heating fuel used in apartments - Other fuel (%)
House heating fuel used in apartments - No fuel used (%)
Armed forces status - In Armed Forces (%)
Armed forces status - Civilian (%)
Armed forces status - Civilian - Veteran (%)
Armed forces status - Civilian - Nonveteran (%)
Fatal accidents locations in years 2005-2021
Fatal accidents locations in 2005
Fatal accidents locations in 2006
Fatal accidents locations in 2007
Fatal accidents locations in 2008
Fatal accidents locations in 2009
Fatal accidents locations in 2010
Fatal accidents locations in 2011
Fatal accidents locations in 2012
Fatal accidents locations in 2013
Fatal accidents locations in 2014
Fatal accidents locations in 2015
Fatal accidents locations in 2016
Fatal accidents locations in 2017
Fatal accidents locations in 2018
Fatal accidents locations in 2019
Fatal accidents locations in 2020
Fatal accidents locations in 2021
Alcohol use - People drinking some alcohol every month (%)
Alcohol use - People not drinking at all (%)
Alcohol use - Average days/month drinking alcohol
Alcohol use - Average drinks/week
Alcohol use - Average days/year people drink much
Audiometry - Average condition of hearing (%)
Audiometry - People that can hear a whisper from across a quiet room (%)
Audiometry - People that can hear normal voice from across a quiet room (%)
Audiometry - Ears ringing, roaring, buzzing (%)
Audiometry - Had a job exposure to loud noise (%)
Audiometry - Had off-work exposure to loud noise (%)
Blood Pressure & Cholesterol - Has high blood pressure (%)
Blood Pressure & Cholesterol - Checking blood pressure at home (%)
Blood Pressure & Cholesterol - Frequently checking blood cholesterol (%)
Blood Pressure & Cholesterol - Has high cholesterol level (%)
Consumer Behavior - Money monthly spent on food at supermarket/grocery store
Consumer Behavior - Money monthly spent on food at other stores
Consumer Behavior - Money monthly spent on eating out
Consumer Behavior - Money monthly spent on carryout/delivered foods
Consumer Behavior - Income spent on food at supermarket/grocery store (%)
Consumer Behavior - Income spent on food at other stores (%)
Consumer Behavior - Income spent on eating out (%)
Consumer Behavior - Income spent on carryout/delivered foods (%)
Current Health Status - General health condition (%)
Current Health Status - Blood donors (%)
Current Health Status - Has blood ever tested for HIV virus (%)
Current Health Status - Left-handed people (%)
Dermatology - People using sunscreen (%)
Diabetes - Diabetics (%)
Diabetes - Had a blood test for high blood sugar (%)
Diabetes - People taking insulin (%)
Diet Behavior & Nutrition - Diet health (%)
Diet Behavior & Nutrition - Milk product consumption (# of products/month)
Diet Behavior & Nutrition - Meals not home prepared (#/week)
Diet Behavior & Nutrition - Meals from fast food or pizza place (#/week)
Diet Behavior & Nutrition - Ready-to-eat foods (#/month)
Diet Behavior & Nutrition - Frozen meals/pizza (#/month)
Drug Use - People that ever used marijuana or hashish (%)
Drug Use - Ever used hard drugs (%)
Drug Use - Ever used any form of cocaine (%)
Drug Use - Ever used heroin (%)
Drug Use - Ever used methamphetamine (%)
Health Insurance - People covered by health insurance (%)
Kidney Conditions-Urology - Avg. # of times urinating at night
Medical Conditions - People with asthma (%)
Medical Conditions - People with anemia (%)
Medical Conditions - People with psoriasis (%)
Medical Conditions - People with overweight (%)
Medical Conditions - Elderly people having difficulties in thinking or remembering (%)
Medical Conditions - People who ever received blood transfusion (%)
Medical Conditions - People having trouble seeing even with glass/contacts (%)
Medical Conditions - People with arthritis (%)
Medical Conditions - People with gout (%)
Medical Conditions - People with congestive heart failure (%)
Medical Conditions - People with coronary heart disease (%)
Medical Conditions - People with angina pectoris (%)
Medical Conditions - People who ever had heart attack (%)
Medical Conditions - People who ever had stroke (%)
Medical Conditions - People with emphysema (%)
Medical Conditions - People with thyroid problem (%)
Medical Conditions - People with chronic bronchitis (%)
Medical Conditions - People with any liver condition (%)
Medical Conditions - People who ever had cancer or malignancy (%)
Mental Health - People who have little interest in doing things (%)
Mental Health - People feeling down, depressed, or hopeless (%)
Mental Health - People who have trouble sleeping or sleeping too much (%)
Mental Health - People feeling tired or having little energy (%)
Mental Health - People with poor appetite or overeating (%)
Mental Health - People feeling bad about themself (%)
Mental Health - People who have trouble concentrating on things (%)
Mental Health - People moving or speaking slowly or too fast (%)
Mental Health - People having thoughts they would be better off dead (%)
Oral Health - Average years since last visit a dentist
Oral Health - People embarrassed because of mouth (%)
Oral Health - People with gum disease (%)
Oral Health - General health of teeth and gums (%)
Oral Health - Average days a week using dental floss/device
Oral Health - Average days a week using mouthwash for dental problem
Oral Health - Average number of teeth
Pesticide Use - Households using pesticides to control insects (%)
Pesticide Use - Households using pesticides to kill weeds (%)
Physical Activity - People doing vigorous-intensity work activities (%)
Physical Activity - People doing moderate-intensity work activities (%)
Physical Activity - People walking or bicycling (%)
Physical Activity - People doing vigorous-intensity recreational activities (%)
Physical Activity - People doing moderate-intensity recreational activities (%)
Physical Activity - Average hours a day doing sedentary activities
Physical Activity - Average hours a day watching TV or videos
Physical Activity - Average hours a day using computer
Physical Functioning - People having limitations keeping them from working (%)
Physical Functioning - People limited in amount of work they can do (%)
Physical Functioning - People that need special equipment to walk (%)
Physical Functioning - People experiencing confusion/memory problems (%)
Physical Functioning - People requiring special healthcare equipment (%)
Prescription Medications - Average number of prescription medicines taking
Preventive Aspirin Use - Adults 40+ taking low-dose aspirin (%)
Reproductive Health - Vaginal deliveries (%)
Reproductive Health - Cesarean deliveries (%)
Reproductive Health - Deliveries resulted in a live birth (%)
Reproductive Health - Pregnancies resulted in a delivery (%)
Reproductive Health - Women breastfeeding newborns (%)
Reproductive Health - Women that had a hysterectomy (%)
Reproductive Health - Women that had both ovaries removed (%)
Reproductive Health - Women that have ever taken birth control pills (%)
Reproductive Health - Women taking birth control pills (%)
Reproductive Health - Women that have ever used Depo-Provera or injectables (%)
Reproductive Health - Women that have ever used female hormones (%)
Sexual Behavior - People 18+ that ever had sex (vaginal, anal, or oral) (%)
Sexual Behavior - Males 18+ that ever had vaginal sex with a woman (%)
Sexual Behavior - Males 18+ that ever performed oral sex on a woman (%)
Sexual Behavior - Males 18+ that ever had anal sex with a woman (%)
Sexual Behavior - Males 18+ that ever had any sex with a man (%)
Sexual Behavior - Females 18+ that ever had vaginal sex with a man (%)
Sexual Behavior - Females 18+ that ever performed oral sex on a man (%)
Sexual Behavior - Females 18+ that ever had anal sex with a man (%)
Sexual Behavior - Females 18+ that ever had any kind of sex with a woman (%)
Sexual Behavior - Average age people first had sex
Sexual Behavior - Average number of female sex partners in lifetime (males 18+)
Sexual Behavior - Average number of female vaginal sex partners in lifetime (males 18+)
Sexual Behavior - Average age people first performed oral sex on a woman (18+)
Sexual Behavior - Average number of woman performed oral sex on in lifetime (18+)
Sexual Behavior - Average number of male sex partners in lifetime (males 18+)
Sexual Behavior - Average number of male anal sex partners in lifetime (males 18+)
Sexual Behavior - Average age people first performed oral sex on a man (18+)
Sexual Behavior - Average number of male oral sex partners in lifetime (18+)
Sexual Behavior - People using protection when performing oral sex (%)
Sexual Behavior - Average number of times people have vaginal or anal sex a year
Sexual Behavior - People having sex without condom (%)
Sexual Behavior - Average number of male sex partners in lifetime (females 18+)
Sexual Behavior - Average number of male vaginal sex partners in lifetime (females 18+)
Sexual Behavior - Average number of female sex partners in lifetime (females 18+)
Sexual Behavior - Circumcised males 18+ (%)
Sleep Disorders - Average hours sleeping at night
Sleep Disorders - People that has trouble sleeping (%)
Smoking-Cigarette Use - People smoking cigarettes (%)
Taste & Smell - People 40+ having problems with smell (%)
Taste & Smell - People 40+ having problems with taste (%)
Taste & Smell - People 40+ that ever had wisdom teeth removed (%)
Taste & Smell - People 40+ that ever had tonsils teeth removed (%)
Taste & Smell - People 40+ that ever had a loss of consciousness because of a head injury (%)
Taste & Smell - People 40+ that ever had a broken nose or other serious injury to face or skull (%)
Taste & Smell - People 40+ that ever had two or more sinus infections (%)
Weight - Average height (inches)
Weight - Average weight (pounds)
Weight - Average BMI
Weight - People that are obese (%)
Weight - People that ever were obese (%)
Weight - People trying to lose weight (%)
Officers per 1,000 residents here:
1.93South Carolina average:
2.21
Latest news from Fort Mill, SC collected exclusively by city-data.com from local newspapers, TV, and radio stations
Fort Mill, SC City Guides: Ancestries: American (12.0%), English (10.2%), Irish (7.7%), German (7.3%), European (4.2%), Scotch-Irish (3.6%).
Current Local Time:
Land area: 4.56 square miles.
Population density: 6,780 people per square mile (high).
1,464 residents are foreign born (2.3% Asia , 1.2% Latin America , 0.9% North America , 0.9% Europe ).
This town:
5.4%South Carolina:
5.3%
Median real estate property taxes paid for housing units with mortgages in 2022: $3,562 (0.7%)Median real estate property taxes paid for housing units with no mortgage in 2022: $3,536 (0.7%)
Nearest city with pop. 50,000+: Charlotte, NC
Nearest city with pop. 1,000,000+: Philadelphia, PA
Nearest cities:
Latitude: 35.01 N, Longitude: 80.95 W
Daytime population change due to commuting: +2,198 (+8.1%)Workers who live and work in this town: 6,007 (42.8%)
Property values in Fort Mill, SC
Fort Mill tourist attractions:
Single-family new house construction building permits:
2022: 929 buildings , average cost: $375,0002021: 1074 buildings , average cost: $375,0002020: 944 buildings , average cost: $375,0002019: 815 buildings , average cost: $375,1002018: 797 buildings , average cost: $374,9002017: 756 buildings , average cost: $375,4002016: 680 buildings , average cost: $373,3002015: 549 buildings , average cost: $385,4002014: 253 buildings , average cost: $421,0002013: 264 buildings , average cost: $418,5002012: 146 buildings , average cost: $377,3002011: 76 buildings , average cost: $354,1002010: 40 buildings , average cost: $329,7002009: 57 buildings , average cost: $285,9002008: 125 buildings , average cost: $289,8002007: 255 buildings , average cost: $230,5002006: 211 buildings , average cost: $222,8002005: 84 buildings , average cost: $151,8002004: 79 buildings , average cost: $220,1002003: 71 buildings , average cost: $147,4002002: 71 buildings , average cost: $132,3002001: 87 buildings , average cost: $104,9002000: 55 buildings , average cost: $193,7001999: 106 buildings , average cost: $156,7001998: 107 buildings , average cost: $148,0001997: 54 buildings , average cost: $127,300Unemployment in December 2023: Here:
2.6%South Carolina:
3.1%
Population change in the 1990s: +2,304 (+43.6%).
Most common occupations in Fort Mill, SC (%)
Both Males Females
Other management occupations, except farmers and farm managers (5.3%)
Sales representatives, services, wholesale and manufacturing (4.6%)
Other production occupations, including supervisors (4.4%)
Preschool, kindergarten, elementary, and middle school teachers (4.0%)
Other sales and related occupations, including supervisors (4.0%)
Engineers (2.9%)
Operations specialties managers, except financial managers (2.8%)
Sales representatives, services, wholesale and manufacturing (7.4%)
Other management occupations, except farmers and farm managers (7.3%)
Engineers (5.1%)
Electrical equipment mechanics and other installation, maintenance, and repair workers, including supervisors (5.1%)
Other production occupations, including supervisors (4.3%)
Other sales and related occupations, including supervisors (4.2%)
Operations specialties managers, except financial managers (3.9%)
Preschool, kindergarten, elementary, and middle school teachers (7.4%)
Secretaries and administrative assistants (5.3%)
Cashiers (5.1%)
Other production occupations, including supervisors (4.5%)
Other office and administrative support workers, including supervisors (3.9%)
Accountants and auditors (3.9%)
Other sales and related occupations, including supervisors (3.7%)
Tornado activity:
Fort Mill-area historical tornado activity is slightly above South Carolina state average. It is 19% greater than the overall U.S. average.
On 5/5/1989, a category F4 (max. wind speeds 207-260 mph) tornado 12.4 miles away from the Fort Mill town center killed one person and injured 6 people and caused between $5,000,000 and $50,000,000 in damages.
On 4/8/1957, a category F4 tornado 33.3 miles away from the town center killed 4 people and injured 70 people .
Earthquake activity:
Fort Mill-area historical earthquake activity is significantly above South Carolina state average. It is 20% smaller than the overall U.S. average. On 8/9/2020 at 12:07:37, a magnitude 5.1 (5.1 MW, Depth: 4.7 mi, Class: Moderate, Intensity: VI - VII) earthquake occurred 102.0 miles away from Fort Mill center On 8/23/2011 at 17:51:04, a magnitude 5.8 (5.8 MW, Depth: 3.7 mi) earthquake occurred 261.5 miles away from Fort Mill center On 8/2/1974 at 08:52:09, a magnitude 4.9 (4.3 MB, 4.9 LG, Class: Light, Intensity: IV - V) earthquake occurred 117.8 miles away from Fort Mill center On 11/22/1974 at 05:25:55, a magnitude 4.7 (4.7 MB) earthquake occurred 152.7 miles away from the city center On 11/30/1973 at 07:48:41, a magnitude 4.7 (4.7 MB, 4.6 ML) earthquake occurred 178.6 miles away from the city center On 7/27/1980 at 18:52:21, a magnitude 5.2 (5.1 MB, 4.7 MS, 5.0 UK, 5.2 UK) earthquake occurred 276.8 miles away from Fort Mill center Magnitude types: regional Lg-wave magnitude (LG), body-wave magnitude (MB), local magnitude (ML), surface-wave magnitude (MS), moment magnitude (MW) Natural disasters: The number of natural disasters in York County (11) is smaller than the US average (15).Major Disasters (Presidential) Declared: 4Emergencies Declared: 5Hurricanes: 4, Winter Storms: 2, Drought: 1, Flood: 1, Ice Storm: 1, Storm: 1, Tropical Storm: 1, Other: 1 (Note: some incidents may be assigned to more than one category). Main business address for: MUZAK HOLDINGS LLC SERVICES-BUSINESS SERVICES, NEC ), MUZAK HOLDINGS FINANCE CORP SERVICES-BUSINESS SERVICES, NEC ).
Hospitals and medical centers in Fort Mill: FMC OF FORT MILL (535 RIVER CROSSING DRIVE)
FORT MILL DIALYSIS (1975 CAROLINA PLACE DR)
Other hospitals and medical centers near Fort Mill: HOSPICE AND COMMUNITY CARE (Hospital, about 5 miles away; ROCK HILL, SC)
PINEVILLE REHABILITATION AND LIVING CTR (Nursing Home, about 6 miles away; PINEVILLE, NC)
WESTMINSTER HEALTH AND REHAB CENTER (Nursing Home, about 6 miles away; ROCK HILL, SC)
AGAPE REHABILITATION OF ROCK HILL (Nursing Home, about 7 miles away; ROCK HILL, SC)
WHITE OAK MANOR - ROCK HILL (Nursing Home, about 7 miles away; ROCK HILL, SC)
DOWDY GARDNER NSG CARE CTR - ROCK HILL (Nursing Home, about 7 miles away; ROCK HILL, SC)
MAGNOLIA MANOR - ROCK HILL (Nursing Home, about 7 miles away; ROCK HILL, SC)
Amtrak station near Fort Mill: 18 miles: CHARLOTTE (1914 N. TYRON ST.) Services: ticket office, partially wheelchair accessible, enclosed waiting area, public restrooms, public payphones, vending machines, free short-term parking, free long-term parking, call for car rental service, taxi stand, public transit connection.
Operable nuclear power plants near Fort Mill:
18 miles: Catawba 1 and 2 in Clover, SC.
Colleges/universities with over 2000 students nearest to Fort Mill:
York Technical College (about 6 miles; Rock Hill, SC ; Full-time enrollment: 3,572)
Winthrop University (about 7 miles; Rock Hill, SC ; FT enrollment: 5,575)
Queens University of Charlotte (about 15 miles; Charlotte, NC ; FT enrollment: 2,083)
Central Piedmont Community College (about 17 miles; Charlotte, NC ; FT enrollment: 15,371)
Johnson & Wales University-Charlotte (about 17 miles; Charlotte, NC ; FT enrollment: 2,518)
University of North Carolina at Charlotte (about 25 miles; Charlotte, NC ; FT enrollment: 22,807)
Gaston College (about 26 miles; Dallas, NC ; FT enrollment: 4,385)
Public high schools in Fort Mill: FORT MILL HIGH Students: 1,511, Location: 225 MUNN ROAD, Grades: 9-12)NATION FORD HIGH Students: 1,491, Location: 1400 A.O. JONES BOULEVARD, Grades: 9-12)Private high school in Fort Mill: ULTIMATE LIFE CHRISTIAN ACADEMY Students: 10, Location: 377 ARUBINS CENTER DR, Grades: 1-12)
Biggest public elementary/middle schools in Fort Mill: SPRINGFIELD MIDDLE Students: 807, Location: 1711 SPRINGFIELD PARKWAY, Grades: 6-8)GOLD HILL MIDDLE Students: 806, Location: 1025 DAVE GIBSON BOULEVARD, Grades: 6-8)ORCHARD PARK ELEMENTARY Students: 781, Location: 474 THIRD BAXTER STREET, Grades: KG-5)PLEASANT KNOLL ELEMENTARY Students: 776, Location: 2346 PLEASANT ROAD, Grades: KG-5)FORT MILL ELEMENTARY Students: 766, Location: 192 SPRINGFIELD PARKWAY, Grades: PK-5)FORT MILL MIDDLE Students: 756, Location: 200 SPRINGFIELD PARKWAY, Grades: 6-8)SUGAR CREEK ELEMENTARY Students: 714, Location: 1599 FARM HOUSE ROAD, Grades: PK-5)RIVERVIEW ELEMENTARY Students: 486, Location: 1434 HARRIS ROAD, Grades: PK-5)GOLD HILL ELEMENTARY Location: 1000 DAVE GIBSON BOULEVARD, Grades: KG-5)
SPRINGFIELD ELEMENTARY Location: 1691 SPRINGFIELD PARKWAY, Grades: KG-5)
See full list of schools located in Fort Mill
Notable locations in Fort Mill: (A) , Fort Mill Fire Department (B) , Fort Mill Public Library (C) . Display/hide their locations on the map
Shopping Center: (1) . Display/hide its location on the map
Church in Fort Mill: (A) . Display/hide its location on the map
Reservoirs: (A) , Stalling Pond (B) , McCorkle Pond (C) . Display/hide their locations on the map
Tourist attractions:
Hotels:
Court:
Birthplace of: James E. Williams - Navy Medal of Honor recipient, Thomas L. Hall - Army Medal of Honor recipient.
York County has a predicted average indoor radon screening level between 2 and 4 pCi/L (pico curies per liter) - Moderate Potential Drinking water stations with addresses in Fort Mill and their reported violations in the past:
RIVERVIEW RURAL CWS (4620001) (Population served: 2,391, Purch surface water):
Past monitoring violations:
Failure Submit IDSE/Subpart V Plan Rpt - In JUL-02-2009, Contaminant: DBP STAGE 2. Follow-up actions: St Compliance achieved (APR-01-2011)
One routine major monitoring violation
Address: SUITE 400-250 Serves NC, Population served: 80, Groundwater):
Past health violations:
MCL, Single Sample - Between JAN-2010 and DEC-2010, Contaminant: Nitrate. Follow-up actions: St Public Notif requested (AUG-27-2010), St Formal NOV issued (AUG-27-2010), St Tech Assistance Visit (AUG-27-2010), St AO (w/o penalty) issued (AUG-27-2010), St Public Notif received (SEP-21-2010), St Compliance achieved (MAR-30-2012)
Past monitoring violations:
Monitoring and Reporting (DBP) - Between APR-2014 and JUN-2014, Contaminant: Chlorine. Follow-up actions: St AO (w/o penalty) issued (JUL-30-2014), St Formal NOV issued (JUL-30-2014), St Public Notif requested (JUL-30-2014), St Compliance achieved (SEP-01-2014)
Monitoring and Reporting (DBP) - Between OCT-2012 and DEC-2012, Contaminant: Chlorine. Follow-up actions: St Compliance achieved (MAR-01-2013), St Public Notif requested (APR-17-2013), St Formal NOV issued (APR-17-2013), St AO (w/o penalty) issued (APR-17-2013), St Public Notif received (JUN-20-2014)
Follow-up Or Routine LCR Tap M/R - In OCT-01-2006, Contaminant: Lead and Copper Rule. Follow-up actions: St Public Notif requested (JAN-18-2007), St Formal NOV issued (JAN-18-2007), St Compliance achieved (SEP-02-2009), St Public Notif received (JUN-20-2014)
2 routine major monitoring violations
3 regular monitoring violations
Population served: 25, Groundwater):
Past monitoring violations:
Monitoring, Repeat Major (TCR) - Between OCT-2012 and DEC-2012, Contaminant: Coliform (TCR). Follow-up actions: St Violation/Reminder Notice (FEB-05-2013), St Compliance achieved (FEB-14-2013)
Drinking water stations with addresses in Fort Mill that have no violations reported:
FORT MILL TOWN OF (4610003) (Population served: 10,200, Primary Water Source Type: Purch surface water)
QUAIL MEADOWS PARK LLC (4660063) (Population served: 219, Primary Water Source Type: Groundwater)
FERN FOREST MHP (4660001) (Population served: 106, Primary Water Source Type: Groundwater)
BRENTWOOD MHP (Address: SUITE 400-250 Serves NC, Population served: 99, Primary Water Source Type: Groundwater)
Average household size: This town:
2.6 peopleSouth Carolina:
2.5 people
Percentage of family households: This town:
71.0%Whole state:
67.5%
Percentage of households with unmarried partners: This town:
4.8%Whole state:
6.0%
Likely homosexual households (counted as self-reported same-sex unmarried-partner households)
Lesbian couples: 0.5% of all households Gay men: 0.2% of all households
Banks with branches in Fort Mill (2011 data):
Branch Banking and Trust Company: Plaza Fiesta Branch at 3700 Avenue Of The Carolinas Ste 108, branch established on 2008/12/22; Fort Mill Branch at 1782 Highway 160 West, branch established on 2005/12/05. Info updated 2010/03/29: Bank assets: $168,867.6 mil, Deposits: $127,549.5 mil, headquarters in Winston Salem, NC, positive income , Commercial Lending Specialization, 1793 total offices , Holding Company: Bb&T Corporation
TD Bank, National Association: Tega Cay Branch at 100 Stone Village Drive, branch established on 1999/09/21; Highway 521 Branch at 8179 Charlotte Highway, branch established on 2006/12/04. Info updated 2010/10/04: Bank assets: $188,912.6 mil, Deposits: $153,149.8 mil, headquarters in Wilmington, DE, positive income , 1314 total offices , Holding Company: Toronto-Dominion Bank, The
SCBT National Association: Highway 160 at 817 Dave Gibson Boulevard, branch established on 2004/09/24; Fort Mill Branch at 808 East Tom Hall Street, branch established on 1996/09/18. Info updated 2011/08/01: Bank assets: $3,893.8 mil, Deposits: $3,257.7 mil, headquarters in Orangeburg, SC, positive income , Commercial Lending Specialization, 79 total offices , Holding Company: Scbt Financial Corporation
Wells Fargo Bank, National Association: Tega Cay Branch at 2890 Highway 160 West, branch established on 1903/01/01; Fort Mill Branch at 403 Tom Hall Street, branch established on 1989/06/30. Info updated 2011/04/05: Bank assets: $1,161,490.0 mil, Deposits: $905,653.0 mil, headquarters in Sioux Falls, SD, positive income , 6395 total offices , Holding Company: Wells Fargo & Company
Bank of America, National Association: Fort Mill Branch at 115 Tom Hall Street, branch established on 1935/06/08. Info updated 2009/11/18: Bank assets: $1,451,969.3 mil, Deposits: $1,077,176.8 mil, headquarters in Charlotte, NC, positive income , 5782 total offices , Holding Company: Bank Of America Corporation
First Citizens Bank and Trust Company, Inc.: Fort Mill Branch at 1401 Highway 160, branch established on 1996/05/20. Info updated 2011/08/24: Bank assets: $8,104.0 mil, Deposits: $6,880.8 mil, headquarters in Columbia, SC, positive income , 197 total offices , Holding Company: First Citizens Bancorporation, Inc.
For population 15 years and over in Fort Mill:
Never married: 26.8%Now married: 60.8%Separated: 0.6%Widowed: 1.9%Divorced: 9.9% For population 25 years and over in Fort Mill:
High school or higher: 96.7%Bachelor's degree or higher: 55.5%Graduate or professional degree: 21.5%Unemployed: 6.8%Mean travel time to work (commute): 19.7 minutes
Education Gini index (Inequality in education) Here:
9.1South Carolina average:
11.1
Religion statistics for Fort Mill, SC (based on York County data)
Religion Adherents Congregations Evangelical Protestant 67,634 215 Mainline Protestant 20,901 60 Catholic 14,030 5 Black Protestant 5,605 34 Other 4,121 11 Orthodox 15 1 None 113,767 -
Source: Clifford Grammich, Kirk Hadaway, Richard Houseal, Dale E.Jones, Alexei Krindatch, Richie Stanley and Richard H.Taylor. 2012. 2010 U.S.Religion Census: Religious Congregations & Membership Study. Association of Statisticians of American Religious Bodies. Jones, Dale E., et al. 2002. Congregations and Membership in the United States 2000. Nashville, TN: Glenmary Research Center. Graphs represent county-level data
Food Environment Statistics: Number of grocery stores : 40Here :
1.92 / 10,000 pop.State :
1.99 / 10,000 pop.
Number of supercenters and club stores : 2York County :
0.10 / 10,000 pop.South Carolina :
0.15 / 10,000 pop.
Number of convenience stores (no gas) : 16This county :
0.77 / 10,000 pop.South Carolina :
0.85 / 10,000 pop.
Number of convenience stores (with gas) : 97This county :
4.65 / 10,000 pop.South Carolina :
5.38 / 10,000 pop.
Number of full-service restaurants : 117This county :
5.61 / 10,000 pop.South Carolina :
7.75 / 10,000 pop.
Adult diabetes rate : This county :
8.8%South Carolina :
10.6%
Adult obesity rate : This county :
28.0%South Carolina :
29.4%
Low-income preschool obesity rate : York County :
14.0%South Carolina :
13.4%
Health and Nutrition: Healthy diet rate : Fort Mill:
51.9%South Carolina:
49.2%
Average overall health of teeth and gums : Fort Mill:
50.5%State:
46.2%
Average BMI : Fort Mill:
28.6South Carolina:
29.0
People feeling badly about themselves : Fort Mill:
20.4%South Carolina:
20.4%
People not drinking alcohol at all : This city:
9.3%State:
11.0%
Average hours sleeping at night : This city:
6.9South Carolina:
6.8
Overweight people : This city:
34.6%South Carolina:
34.4%
General health condition : Fort Mill:
58.5%South Carolina:
55.6%
Average condition of hearing : Fort Mill:
80.6%South Carolina:
79.9%
More about Health and Nutrition of Fort Mill, SC Residents
Local government employment and payroll (March 2022)
Function
Full-time employees
Monthly full-time payroll
Average yearly full-time wage
Part-time employees
Monthly part-time payroll
Police Protection - Officers
54 $276,480 $61,440 0 $0 Firefighters
41 $191,795 $56,135 3 $3,007 Other and Unallocable
28 $116,142 $49,775 1 $1,676 Sewerage
26 $109,592 $50,581 0 $0 Financial Administration
12 $55,415 $55,415 1 $89 Solid Waste Management
11 $40,039 $43,679 0 $0 Other Government Administration
10 $62,773 $75,328 7 $1,489 Parks and Recreation
9 $36,387 $48,516 9 $3,691 Police - Other
9 $33,314 $44,419 0 $0 Water Supply
8 $30,210 $45,315 0 $0 Judicial and Legal
3 $11,308 $45,232 2 $1,973 Fire - Other
1 $3,319 $39,828 0 $0
Totals for Government
212 $966,773 $54,723 23 $11,925
Fort Mill government finances - Expenditure in 2021 (per resident):
Construction - Regular Highways: $13,775,000 ($445.22)
Sewerage: $4,509,000 ($145.73)Parks and Recreation: $295,000 ($9.53)Solid Waste Management: $162,000 ($5.24)Current Operations - Water Utilities: $6,916,000 ($223.53)
Police Protection: $6,176,000 ($199.61)Local Fire Protection: $3,670,000 ($118.62)Central Staff Services: $3,458,000 ($111.76)Financial Administration: $2,074,000 ($67.03)Parks and Recreation: $1,499,000 ($48.45)Solid Waste Management: $1,094,000 ($35.36)General Public Buildings: $996,000 ($32.19)Regular Highways: $991,000 ($32.03)Miscellaneous Commercial Activities - Other: $848,000 ($27.41)Judicial and Legal Services: $206,000 ($6.66)Sewerage: $190,000 ($6.14)General - Other: $100,000 ($3.23)General - Interest on Debt: $304,000 ($9.83)
Other Capital Outlay - Water Utilities: $3,507,000 ($113.35)
Natural Resources - Other: $1,949,000 ($62.99)Police Protection: $1,461,000 ($47.22)Solid Waste Management: $685,000 ($22.14)Sewerage: $681,000 ($22.01)General - Other: $491,000 ($15.87)Miscellaneous Commercial Activities - Other: $467,000 ($15.09)Regular Highways: $267,000 ($8.63)Parks and Recreation: $122,000 ($3.94)Local Fire Protection: $118,000 ($3.81)Central Staff Services: $52,000 ($1.68)General Public Building: $34,000 ($1.10)Judicial and Legal Services: $22,000 ($0.71)Water Utilities - Interest on Debt: $1,158,000 ($37.43)
Fort Mill government finances - Revenue in 2021 (per resident):
Charges - Sewerage: $6,930,000 ($223.98)
Other: $2,674,000 ($86.43)Parks and Recreation: $1,263,000 ($40.82)Solid Waste Management: $704,000 ($22.75)Miscellaneous Commercial Activities: $29,000 ($0.94)Federal Intergovernmental - Other: $178,000 ($5.75)
Local Intergovernmental - Highways: $969,000 ($31.32)
Other: $61,000 ($1.97)Miscellaneous - Fines and Forfeits: $7,658,000 ($247.51)
Donations From Private Sources: $4,927,000 ($159.24)General Revenue - Other: $1,594,000 ($51.52)Special Assessments: $1,429,000 ($46.19)Rents: $414,000 ($13.38)Sale of Property: $79,000 ($2.55)Interest Earnings: $76,000 ($2.46)Revenue - Water Utilities: $8,403,000 ($271.59)
State Intergovernmental - Other: $6,082,000 ($196.57)
Highways: $1,683,000 ($54.40)General Local Government Support: $1,344,000 ($43.44)Tax - Property: $12,356,000 ($399.35)
Other: $7,624,000 ($246.41)Occupation and Business License - Other: $4,585,000 ($148.19)Public Utility License: $3,039,000 ($98.22)Other License: $1,996,000 ($64.51)Other Selective Sales: $1,678,000 ($54.23)
Fort Mill government finances - Debt in 2021 (per resident):
Long Term Debt - Beginning Outstanding - Unspecified Public Purpose: $34,369,000 ($1110.83)
Outstanding Unspecified Public Purpose: $33,478,000 ($1082.03)Beginning Outstanding - Public Debt for Private Purpose: $2,196,000 ($70.98)Retired Nonguaranteed - Public Debt for Private Purpose: $1,768,000 ($57.14)Retired Unspecified Public Purpose: $891,000 ($28.80)Outstanding Nonguaranteed - Industrial Revenue: $428,000 ($13.83)
Fort Mill government finances - Cash and Securities in 2021 (per resident):
Bond Funds - Cash and Securities: $13,449,000 ($434.68)
Other Funds - Cash and Securities: $59,148,000 ($1911.70)
Sinking Funds - Cash and Securities: $2,240,000 ($72.40)
Businesses in Fort Mill, SC
Name Count Name Count
ALDI 1 Just Tires 2 Advance Auto Parts 1 KFC 1 AutoZone 1 Lane Furniture 1 Baskin-Robbins 1 Long John Silver's 1 Best Western 1 Lowe's 1 Blockbuster 1 MasterBrand Cabinets 4 CVS 2 McDonald's 3 Chick-Fil-A 1 Motel 6 1 Circle K 3 Papa John's Pizza 1 Comfort Inn 1 Pizza Hut 1 Cracker Barrel 1 Quality 1 Curves 1 Quiznos 1 Decora Cabinetry 1 Rite Aid 1 Discount Tire 1 Sleep Inn 1 Dunkin Donuts 1 Sprint Nextel 1 FedEx 13 Starbucks 2 Firestone Complete Auto Care 1 Subway 6 Ford 1 Taco Bell 1 GNC 1 U-Haul 4 GameStop 1 UPS 14 H&R Block 3 Walgreens 1 Hardee's 1 Wendy's 1 Hyundai 1 YMCA 2
Strongest AM radio stations in Fort Mill:
WBT (1110 AM; 50 kW; CHARLOTTE, NC; Owner: JEFFERSON-PILOT COMMUNICATNS CO. OF NORTH CAROLINA)
WAGL (1560 AM; daytime; 50 kW; LANCASTER, SC; Owner: PALMETTO BROADCASTING SYSTEM, INC.)
WRHI (1340 AM; 1 kW; ROCK HILL, SC; Owner: OUR THREE SONS BROADCASTING, LLP)
WAVO (1150 AM; 1 kW; ROCK HILL, SC; Owner: WHVN, INC.)
WLTC (1370 AM; 20 kW; GASTONIA, NC)
WBZK (980 AM; 3 kW; YORK, SC; Owner: CAROLINA METRO RADIO, LLC)
WCGC (1270 AM; 10 kW; BELMONT, NC; Owner: WHVN, INC.)
WNOW (1030 AM; daytime; 9 kW; MINT HILL, NC; Owner: CHARLOTTE METRO RADIO, INC.)
WCEO (840 AM; daytime; 50 kW; COLUMBIA, SC; Owner: EASTERN BROADCASTING GROUP, INC.)
WFNZ (610 AM; 5 kW; CHARLOTTE, NC; Owner: INFINITY RADIO SUBSIDIARY OPERATIONS INC.)
WGFY (1480 AM; 10 kW; CHARLOTTE, NC; Owner: ABC, INC.)
WBCU (1460 AM; 50 kW; UNION, SC)
WYFQ (930 AM; 5 kW; CHARLOTTE, NC; Owner: BIBLE BROADCASTING NETWORK, INC.)
Strongest FM radio stations in Fort Mill:
WWMG (96.1 FM; SHELBY, NC; Owner: CLEAR CHANNEL BROADCASTING LICENSES, INC.)
WKKT (96.9 FM; STATESVILLE, NC; Owner: CAPSTAR TX LIMITED PARTNERSHIP)
WRFX-FM (99.7 FM; KANNAPOLIS, NC; Owner: CAPSTAR TX LIMITED PARTNERSHIP)
WLNK (107.9 FM; CHARLOTTE, NC; Owner: JEFFERSON-PILOT COMMUNICATIONS COMPANY OF NORTH CAROLINA)
WSOC-FM (103.7 FM; CHARLOTTE, NC; Owner: INFINITY RADIO SUBSIDIARY OPERATIONS INC.)
WNSC-FM (88.9 FM; ROCK HILL, SC; Owner: SOUTH CAROLINA EDUCATIONAL TV COMMISSION)
WBAV-FM (101.9 FM; GASTONIA, NC; Owner: INFINITY RADIO SUBSIDIARY OPERATIONS INC.)
WPEG (97.9 FM; CONCORD, NC; Owner: INFINITY RADIO SUBSIDIARY OPERATIONS INC.)
WSSS (104.7 FM; CHARLOTTE, NC; Owner: INFINITY RADIO SUBSIDIARY OPERATIONS INC.)
WNKS (95.1 FM; CHARLOTTE, NC; Owner: INFINITY RADIO SUBSIDIARY OPERATIONS INC.)
WLYT (102.9 FM; HICKORY, NC; Owner: CAPSTAR TX LIMITED PARTNERSHIP)
W232AX (94.3 FM; ROCK HILL, SC; Owner: OUR THREE SONS BROADCASTING, LLP)
WRCM (91.9 FM; WINGATE, NC; Owner: COLUMBIA BIBLE COLLEGE BROADCASTING CO)
WFAE (90.7 FM; CHARLOTTE, NC; Owner: UNIVERSITY RADIO FOUNDATION, INC.)
WSGE (91.7 FM; DALLAS, NC; Owner: GASTON COLLEGE)
WRHM (107.1 FM; LANCASTER, SC; Owner: OUR THREE SONS BROADCASTING, LLP)
WXRC (95.7 FM; HICKORY, NC; Owner: PACIFIC BROADCASTING GROUP, INC.)
W219CH (91.7 FM; LOWRYS, SC; Owner: RICHBURG EDUCATIONAL BROADCASTERS, INC.)
WBT-FM (99.3 FM; CHESTER, SC; Owner: JEFFERSON-PILOT COMMUNICATIONS COMPANY OF NORTH CAROLINA)
WRBK (90.3 FM; RICHBURG, SC; Owner: RICHBURG EDUCATIONAL BROADCASTERS, INC.)
TV broadcast stations around Fort Mill:
WBTV (Channel 3; CHARLOTTE, NC; Owner: JEFFERSON-PILOT COMMUNICATIONS/WBTV, INC.)
WAFF (Channel 48; HUNTSVILLE, AL; Owner: RAYCOM AMERICA, INC.)
WCNC-TV (Channel 36; CHARLOTTE, NC; Owner: WCNC-TV, INC.)
WJZY (Channel 46; BELMONT, NC; Owner: WJZY-TV, INC.)
WWWB (Channel 55; ROCK HILL, SC; Owner: WWWB-TV, INC.)
WSOC-TV (Channel 9; CHARLOTTE, NC; Owner: WSOC-TV HOLDINGS, INC.)
WNSC-TV (Channel 30; ROCK HILL, SC; Owner: SOUTH CAROLINA EDUCATIONAL TV COMMISSION)
WGTB-LP (Channel 28; CHARLOTTE, NC; Owner: VICTORY CHRISTIAN CENTER, INC.)
WCCB (Channel 18; CHARLOTTE, NC; Owner: NORTH CAROLINA BROADCASTING PARTNERS)
WTVI (Channel 42; CHARLOTTE, NC; Owner: CHARLOTTE-MECKLENBURG PUBLIC BROADCASTING AUTHORITY)
WUNG-TV (Channel 58; CONCORD, NC; Owner: UNIVERSITY OF NORTH CAROLINA)
W25BR (Channel 25; CHARLOTTE, NC; Owner: WORD OF GOD FELLOWSHIP, INC.)
WAXN (Channel 64; KANNAPOLIS, NC; Owner: WSOC-TV HOLDINGS, INC.)
W52CW (Channel 52; CHARLOTTE, NC; Owner: TRINITY BROADCASTING NETWORK)
W34BN (Channel 34; CHARLOTTE, NC; Owner: THREE ANGELS BROADCASTING NETWORK)
W38CN (Channel 38; CHARLOTTE, NC; Owner: NATIONAL MINORITY T.V., INC.)
National Bridge Inventory (NBI) Statistics 31 Number of bridges433ft / 132m Total length $5,301,000 Total costs847,700 Total average daily traffic82,033 Total average daily truck traffic
New bridges - historical statistics
2 1940-1949 1 1950-1959 14 1970-1979 2 1980-1989 5 1990-1999 2 2000-2009 4 2010-2019 1 2020-2022
See full National Bridge Inventory statistics for Fort Mill, SC
Home Mortgage Disclosure Act Aggregated Statistics For Year 2009(Based on 2 partial tracts) A) FHA, FSA/RHS & VA B) Conventional C) Refinancings D) Home Improvement Loans F) Non-occupant Loans on Number Average Value Number Average Value Number Average Value Number Average Value Number Average Value
LOANS ORIGINATED 27 $163,963 27 $230,800 109 $193,237 3 $84,653 6 $124,548 APPLICATIONS APPROVED, NOT ACCEPTED 1 $124,420 4 $261,740 9 $207,913 0 $0 0 $0 APPLICATIONS DENIED 2 $151,075 4 $182,718 30 $190,577 2 $114,695 2 $145,580 APPLICATIONS WITHDRAWN 6 $169,963 6 $208,852 28 $193,518 1 $123,790 2 $114,305 FILES CLOSED FOR INCOMPLETENESS 1 $136,260 1 $221,120 7 $201,363 0 $0 0 $0
Aggregated Statistics For Year 2008(Based on 2 partial tracts) A) FHA, FSA/RHS & VA B) Conventional C) Refinancings D) Home Improvement Loans F) Non-occupant Loans on Number Average Value Number Average Value Number Average Value Number Average Value Number Average Value
LOANS ORIGINATED 18 $172,967 49 $231,028 57 $166,309 2 $52,840 10 $116,099 APPLICATIONS APPROVED, NOT ACCEPTED 1 $145,600 6 $243,795 8 $142,444 3 $48,030 1 $257,690 APPLICATIONS DENIED 3 $189,653 11 $216,393 32 $159,647 5 $40,908 2 $230,215 APPLICATIONS WITHDRAWN 3 $219,297 11 $215,655 12 $160,221 1 $100,110 2 $158,065 FILES CLOSED FOR INCOMPLETENESS 0 $0 1 $180,380 3 $234,593 1 $66,750 1 $96,030
Aggregated Statistics For Year 2007(Based on 2 partial tracts) A) FHA, FSA/RHS & VA B) Conventional C) Refinancings D) Home Improvement Loans F) Non-occupant Loans on G) Loans On Manufactured Number Average Value Number Average Value Number Average Value Number Average Value Number Average Value Number Average Value
LOANS ORIGINATED 10 $178,687 209 $172,791 74 $144,902 11 $36,839 33 $133,568 1 $23,640 APPLICATIONS APPROVED, NOT ACCEPTED 0 $0 21 $197,363 12 $156,061 1 $59,780 2 $116,445 0 $0 APPLICATIONS DENIED 2 $123,445 26 $171,520 38 $152,042 10 $61,769 7 $130,496 0 $0 APPLICATIONS WITHDRAWN 2 $103,255 29 $176,170 20 $149,439 2 $130,475 5 $144,266 0 $0 FILES CLOSED FOR INCOMPLETENESS 1 $86,660 3 $121,107 3 $237,660 0 $0 1 $78,770 0 $0
Aggregated Statistics For Year 2006(Based on 2 partial tracts) A) FHA, FSA/RHS & VA B) Conventional C) Refinancings D) Home Improvement Loans E) Loans on Dwellings For 5+ Families F) Non-occupant Loans on G) Loans On Manufactured Number Average Value Number Average Value Number Average Value Number Average Value Number Average Value Number Average Value Number Average Value
LOANS ORIGINATED 18 $147,666 194 $138,226 77 $118,256 4 $66,795 1 $68,670 27 $108,582 1 $30,170 APPLICATIONS APPROVED, NOT ACCEPTED 1 $131,490 18 $146,152 12 $132,294 3 $27,267 0 $0 3 $105,150 0 $0 APPLICATIONS DENIED 1 $134,540 21 $121,557 41 $149,730 6 $31,677 0 $0 5 $132,492 2 $67,795 APPLICATIONS WITHDRAWN 3 $170,473 25 $154,330 23 $135,052 1 $116,580 0 $0 2 $121,510 0 $0 FILES CLOSED FOR INCOMPLETENESS 0 $0 4 $114,918 9 $143,864 0 $0 0 $0 0 $0 0 $0
Aggregated Statistics For Year 2005(Based on 2 partial tracts) A) FHA, FSA/RHS & VA B) Conventional C) Refinancings D) Home Improvement Loans F) Non-occupant Loans on G) Loans On Manufactured Number Average Value Number Average Value Number Average Value Number Average Value Number Average Value Number Average Value
LOANS ORIGINATED 19 $133,433 155 $131,297 66 $120,446 7 $43,377 23 $90,606 3 $41,440 APPLICATIONS APPROVED, NOT ACCEPTED 1 $45,030 13 $170,515 15 $107,995 2 $32,085 3 $112,283 0 $0 APPLICATIONS DENIED 2 $136,960 12 $113,593 44 $131,552 5 $37,616 2 $122,885 1 $44,790 APPLICATIONS WITHDRAWN 3 $165,930 19 $142,462 22 $126,935 2 $87,735 3 $131,850 1 $35,030 FILES CLOSED FOR INCOMPLETENESS 1 $57,720 3 $98,077 14 $128,779 0 $0 0 $0 0 $0
Aggregated Statistics For Year 2004(Based on 2 partial tracts) A) FHA, FSA/RHS & VA B) Conventional C) Refinancings D) Home Improvement Loans F) Non-occupant Loans on G) Loans On Manufactured Number Average Value Number Average Value Number Average Value Number Average Value Number Average Value Number Average Value
LOANS ORIGINATED 31 $123,867 114 $126,827 61 $125,666 3 $30,270 21 $90,293 0 $0 APPLICATIONS APPROVED, NOT ACCEPTED 1 $130,280 13 $121,149 10 $105,438 0 $0 3 $69,983 0 $0 APPLICATIONS DENIED 8 $129,574 14 $104,102 30 $113,232 6 $34,570 3 $66,363 1 $17,200 APPLICATIONS WITHDRAWN 4 $124,992 21 $111,793 20 $132,931 0 $0 2 $66,865 0 $0 FILES CLOSED FOR INCOMPLETENESS 2 $126,445 5 $93,216 9 $125,299 1 $28,870 0 $0 0 $0
Aggregated Statistics For Year 2003(Based on 2 partial tracts) A) FHA, FSA/RHS & VA B) Conventional C) Refinancings D) Home Improvement Loans F) Non-occupant Loans on Number Average Value Number Average Value Number Average Value Number Average Value Number Average Value
LOANS ORIGINATED 36 $132,040 87 $141,276 132 $122,953 3 $18,160 10 $76,596 APPLICATIONS APPROVED, NOT ACCEPTED 0 $0 9 $123,371 15 $121,722 0 $0 1 $86,520 APPLICATIONS DENIED 4 $140,672 13 $108,914 28 $113,982 2 $36,905 1 $184,840 APPLICATIONS WITHDRAWN 5 $127,202 16 $118,023 28 $121,089 0 $0 3 $88,047 FILES CLOSED FOR INCOMPLETENESS 0 $0 3 $119,820 4 $104,598 0 $0 1 $107,190
Aggregated Statistics For Year 2002(Based on 2 partial tracts) A) FHA, FSA/RHS & VA B) Conventional C) Refinancings D) Home Improvement Loans F) Non-occupant Loans on Number Average Value Number Average Value Number Average Value Number Average Value Number Average Value
LOANS ORIGINATED 8 $103,066 55 $145,987 101 $110,909 5 $8,172 21 $73,019 APPLICATIONS APPROVED, NOT ACCEPTED 0 $0 4 $175,985 10 $98,712 1 $12,110 1 $79,280 APPLICATIONS DENIED 2 $92,500 6 $96,782 18 $105,357 1 $23,060 1 $57,120 APPLICATIONS WITHDRAWN 0 $0 7 $104,839 14 $95,307 1 $11,580 1 $53,590 FILES CLOSED FOR INCOMPLETENESS 0 $0 3 $85,760 2 $122,230 0 $0 0 $0
Aggregated Statistics For Year 2001(Based on 2 partial tracts) A) FHA, FSA/RHS & VA B) Conventional C) Refinancings D) Home Improvement Loans F) Non-occupant Loans on Number Average Value Number Average Value Number Average Value Number Average Value Number Average Value
LOANS ORIGINATED 10 $113,801 44 $135,238 61 $116,825 5 $14,142 8 $87,672 APPLICATIONS APPROVED, NOT ACCEPTED 1 $63,020 6 $114,015 7 $87,016 2 $44,685 1 $36,840 APPLICATIONS DENIED 0 $0 13 $84,738 24 $78,071 7 $13,359 3 $51,613 APPLICATIONS WITHDRAWN 0 $0 3 $136,760 19 $88,704 1 $16,130 2 $64,630 FILES CLOSED FOR INCOMPLETENESS 0 $0 1 $143,430 2 $118,845 0 $0 0 $0
Aggregated Statistics For Year 2000(Based on 2 partial tracts) A) FHA, FSA/RHS & VA B) Conventional C) Refinancings D) Home Improvement Loans F) Non-occupant Loans on Number Average Value Number Average Value Number Average Value Number Average Value Number Average Value
LOANS ORIGINATED 6 $95,008 40 $118,288 23 $75,568 7 $15,587 4 $55,435 APPLICATIONS APPROVED, NOT ACCEPTED 0 $0 6 $92,782 7 $69,610 4 $17,748 1 $54,220 APPLICATIONS DENIED 1 $94,300 24 $48,344 26 $64,914 3 $22,387 1 $60,990 APPLICATIONS WITHDRAWN 1 $51,380 5 $104,648 11 $80,364 1 $75,180 0 $0 FILES CLOSED FOR INCOMPLETENESS 0 $0 1 $105,760 2 $83,375 0 $0 0 $0
Aggregated Statistics For Year 1999(Based on 2 partial tracts) A) FHA, FSA/RHS & VA B) Conventional C) Refinancings D) Home Improvement Loans F) Non-occupant Loans on Number Average Value Number Average Value Number Average Value Number Average Value Number Average Value
LOANS ORIGINATED 6 $105,292 53 $104,706 45 $81,754 7 $15,141 7 $65,081 APPLICATIONS APPROVED, NOT ACCEPTED 0 $0 11 $80,816 11 $86,836 2 $11,875 1 $38,460 APPLICATIONS DENIED 1 $44,440 50 $51,780 20 $75,854 3 $7,523 2 $70,925 APPLICATIONS WITHDRAWN 0 $0 6 $118,717 12 $71,205 0 $0 1 $99,670 FILES CLOSED FOR INCOMPLETENESS 1 $77,640 2 $166,180 5 $74,978 0 $0 0 $0
Detailed HMDA statistics for the following Tracts:
0611.01
, 0611.02
Private Mortgage Insurance Companies Aggregated Statistics For Year 2009(Based on 2 partial tracts) A) Conventional B) Refinancings Number Average Value Number Average Value
LOANS ORIGINATED 5 $197,796 3 $215,477 APPLICATIONS APPROVED, NOT ACCEPTED 2 $239,905 1 $134,590 APPLICATIONS DENIED 1 $139,670 1 $146,630 APPLICATIONS WITHDRAWN 1 $187,160 0 $0 FILES CLOSED FOR INCOMPLETENESS 0 $0 0 $0
Aggregated Statistics For Year 2008(Based on 2 partial tracts) A) Conventional B) Refinancings C) Non-occupant Loans on Number Average Value Number Average Value Number Average Value
LOANS ORIGINATED 14 $208,880 7 $186,329 1 $159,370 APPLICATIONS APPROVED, NOT ACCEPTED 3 $198,087 3 $208,543 1 $90,060 APPLICATIONS DENIED 1 $186,360 2 $150,015 0 $0 APPLICATIONS WITHDRAWN 0 $0 0 $0 0 $0 FILES CLOSED FOR INCOMPLETENESS 0 $0 0 $0 0 $0
Aggregated Statistics For Year 2007(Based on 2 partial tracts) A) Conventional B) Refinancings C) Non-occupant Loans on Number Average Value Number Average Value Number Average Value
LOANS ORIGINATED 24 $181,168 7 $167,910 2 $137,625 APPLICATIONS APPROVED, NOT ACCEPTED 2 $169,665 0 $0 0 $0 APPLICATIONS DENIED 0 $0 0 $0 0 $0 APPLICATIONS WITHDRAWN 0 $0 0 $0 0 $0 FILES CLOSED FOR INCOMPLETENESS 0 $0 0 $0 0 $0
Aggregated Statistics For Year 2006(Based on 2 partial tracts) A) Conventional B) Refinancings C) Non-occupant Loans on Number Average Value Number Average Value Number Average Value
LOANS ORIGINATED 24 $169,523 3 $194,023 2 $154,870 APPLICATIONS APPROVED, NOT ACCEPTED 5 $183,780 2 $112,265 0 $0 APPLICATIONS DENIED 0 $0 1 $54,290 0 $0 APPLICATIONS WITHDRAWN 1 $175,800 0 $0 0 $0 FILES CLOSED FOR INCOMPLETENESS 0 $0 0 $0 0 $0
Aggregated Statistics For Year 2005(Based on 2 partial tracts) A) Conventional B) Refinancings C) Non-occupant Loans on Number Average Value Number Average Value Number Average Value
LOANS ORIGINATED 14 $138,579 5 $157,206 3 $82,340 APPLICATIONS APPROVED, NOT ACCEPTED 2 $184,915 3 $126,657 0 $0 APPLICATIONS DENIED 0 $0 0 $0 0 $0 APPLICATIONS WITHDRAWN 1 $183,320 1 $49,190 0 $0 FILES CLOSED FOR INCOMPLETENESS 0 $0 0 $0 0 $0
Aggregated Statistics For Year 2004(Based on 2 partial tracts) A) Conventional B) Refinancings C) Non-occupant Loans on Number Average Value Number Average Value Number Average Value
LOANS ORIGINATED 12 $119,156 7 $129,883 4 $80,035 APPLICATIONS APPROVED, NOT ACCEPTED 5 $134,936 2 $143,245 1 $88,300 APPLICATIONS DENIED 0 $0 0 $0 0 $0 APPLICATIONS WITHDRAWN 2 $118,405 0 $0 0 $0 FILES CLOSED FOR INCOMPLETENESS 0 $0 0 $0 0 $0
Aggregated Statistics For Year 2003(Based on 2 partial tracts) A) Conventional B) Refinancings C) Non-occupant Loans on Number Average Value Number Average Value Number Average Value
LOANS ORIGINATED 17 $141,164 19 $144,331 1 $129,180 APPLICATIONS APPROVED, NOT ACCEPTED 2 $204,450 5 $123,832 0 $0 APPLICATIONS DENIED 1 $171,260 0 $0 0 $0 APPLICATIONS WITHDRAWN 3 $112,597 2 $90,365 0 $0 FILES CLOSED FOR INCOMPLETENESS 0 $0 0 $0 0 $0
Aggregated Statistics For Year 2002(Based on 2 partial tracts) A) Conventional B) Refinancings C) Non-occupant Loans on Number Average Value Number Average Value Number Average Value
LOANS ORIGINATED 9 $145,506 12 $129,896 1 $94,610 APPLICATIONS APPROVED, NOT ACCEPTED 3 $118,840 2 $123,655 0 $0 APPLICATIONS DENIED 1 $116,700 0 $0 0 $0 APPLICATIONS WITHDRAWN 1 $101,710 1 $116,860 0 $0 FILES CLOSED FOR INCOMPLETENESS 0 $0 0 $0 0 $0
Aggregated Statistics For Year 2001(Based on 2 partial tracts) A) Conventional B) Refinancings C) Non-occupant Loans on Number Average Value Number Average Value Number Average Value
LOANS ORIGINATED 15 $114,704 9 $138,291 1 $71,180 APPLICATIONS APPROVED, NOT ACCEPTED 1 $134,370 2 $112,415 0 $0 APPLICATIONS DENIED 1 $223,130 1 $60,990 0 $0 APPLICATIONS WITHDRAWN 0 $0 0 $0 0 $0 FILES CLOSED FOR INCOMPLETENESS 0 $0 0 $0 0 $0
Aggregated Statistics For Year 2000(Based on 2 partial tracts) A) Conventional B) Refinancings Number Average Value Number Average Value
LOANS ORIGINATED 13 $127,470 1 $112,220 APPLICATIONS APPROVED, NOT ACCEPTED 1 $157,900 0 $0 APPLICATIONS DENIED 1 $49,150 0 $0 APPLICATIONS WITHDRAWN 0 $0 0 $0 FILES CLOSED FOR INCOMPLETENESS 0 $0 0 $0
Aggregated Statistics For Year 1999(Based on 2 partial tracts) A) Conventional B) Refinancings Number Average Value Number Average Value
LOANS ORIGINATED 15 $114,545 5 $113,632 APPLICATIONS APPROVED, NOT ACCEPTED 2 $102,510 2 $109,145 APPLICATIONS DENIED 1 $69,750 0 $0 APPLICATIONS WITHDRAWN 0 $0 0 $0 FILES CLOSED FOR INCOMPLETENESS 0 $0 0 $0
Detailed PMIC statistics for the following Tracts:
0611.01
, 0611.02 Fire-safe hotels and motels in Fort Mill, South Carolina:
Quality Inn, 3560 Lakemont Blvd, Fort Mill, South Carolina 29708 Phone: (803) 548-0100, Fax: (803) 548-5305
Sleep Inn Carowinds, 3540 Lakemont Blvd, Fort Mill, South Carolina 29715 Phone: (803) 547-2300, Fax: (803) 247-2444
Best Western Carowinds, 3675 Foothills Way, Fort Mill, South Carolina 29708 Phone: (803) 548-8400, Fax: (803) 548-6572
Hampton Inn & Suites Fort Mill, 1520 Carolina Place Dr, Fort mill, South Carolina 29708 Phone: (803) 578-2600, Fax: (803) 578-2608
Comfort Inn Carowinds, 3725 Ave Of The Carolinas, Fort mill, South Carolina 29708 Phone: (803) 548-5200, Fax: (803) 548-6692
Courtyard Charlotte Fort Mill, SC, 1385 Broadcloth St, Fort mill, South Carolina 29715 Phone: (888) 236-2427, Fax: (803) 548-0157
Holiday Inn Express and Suites, 1655 Carolina Place Dr, Fort Mill, South Carolina 29708 Phone: (803) 802-0300
All 7 fire-safe hotels and motels in Fort Mill, South Carolina
Most common first names in Fort Mill, SC among deceased individuals Name Count Lived (average)
James 168 71.9 years John 152 70.8 years William 151 73.6 years Mary 121 76.4 years Robert 115 70.5 years Charles 71 68.8 years Thomas 64 68.7 years George 54 73.5 years Margaret 53 78.5 years Betty 39 67.5 years
Most common last names in Fort Mill, SC among deceased individuals Last name Count Lived (average)
Wilson 60 70.9 years Patterson 47 76.9 years Smith 45 73.6 years Moore 43 69.7 years Williams 43 71.2 years Griffin 39 73.2 years Helms 38 70.9 years White 36 76.8 years Johnson 36 75.8 years Miller 33 73.5 years
Fort Mill compared to South Carolina state average:
Median household income above state average. Median house value above state average. Unemployed percentage below state average. Hispanic race population percentage significantly above state average. Foreign-born population percentage significantly above state average. House age significantly below state average. Number of college students above state average. Percentage of population with a bachelor's degree or higher significantly above state average.
#25 on the list of "Top 101 cities with largest percentage of females in industries: management of companies and enterprises (population 5,000+)"
#53 on the list of "Top 101 cities with largest percentage of females in industries: administrative and support and waste management services (population 5,000+)"
#81 on the list of "Top 101 cities with the largest city-data.com crime index decrease from 2011 to 2012 (population 5,000+)"
#88 on the list of "Top 101 cities with the largest city-data.com crime index decrease from 2002 to 2012 (population 5,000+)"
#13 on the list of "Top 101 counties with the lowest percentage of residents that drank alcohol in the past 30 days"
#15 on the list of "Top 101 counties with the highest average weight of females"
#26 on the list of "Top 101 counties with the lowest Sulfur Oxides Annual air pollution readings in 2012 (µg/m3 )"
#45 on the list of "Top 101 counties with the highest percentage of residents that keep firearms around their homes"
#56 on the list of "Top 101 counties with the largest number of people moving in compared to moving out (pop. 50,000+)"
Top Patent Applicants
Alicia C. Jones (64)
Gary A. Taylor (27)
Tammy L. Brunswig (25)
Michael Gerald Smith (18)
Alicia C. Jones-Mcfadden (17)
David T. Frew (15)
Stanley Benjamin Smith (13)
Jonathon D. Phillips (13)
Donn J. Costanzo, Jr. (12)
Kevin Ahearn (12)
Total of 689 patent applications in 2008-2024.
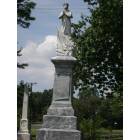
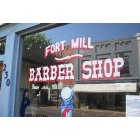
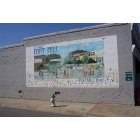
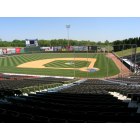
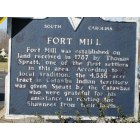
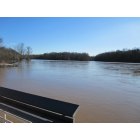
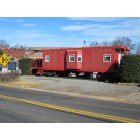
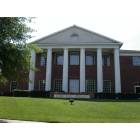
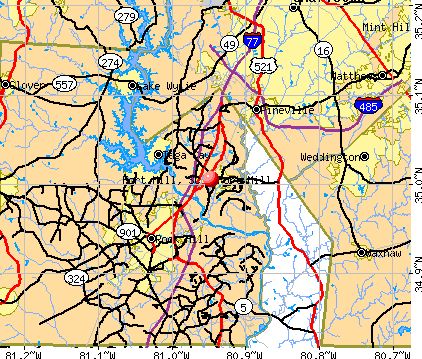


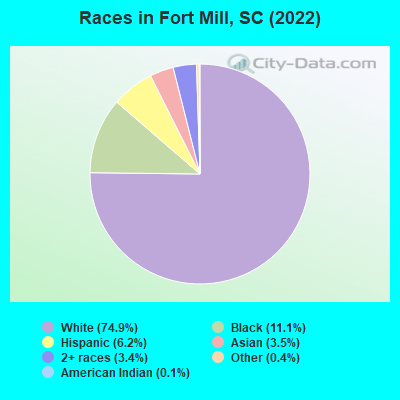
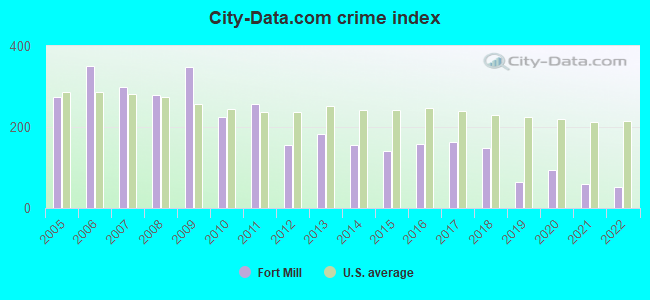
 Recent articles from our blog. Our writers, many of them Ph.D. graduates or candidates, create easy-to-read articles on a wide variety of topics.

 (15.4 miles
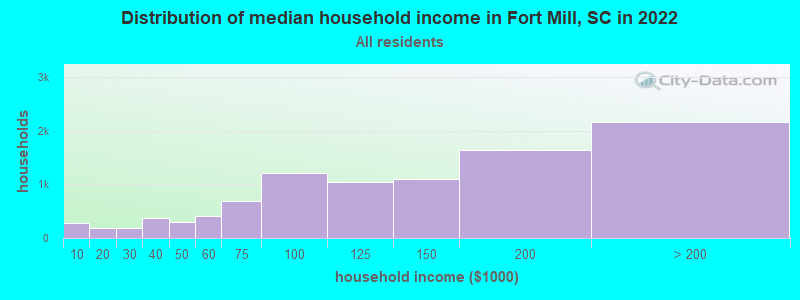
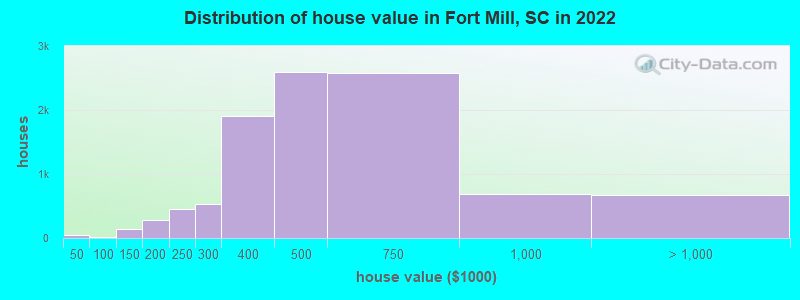

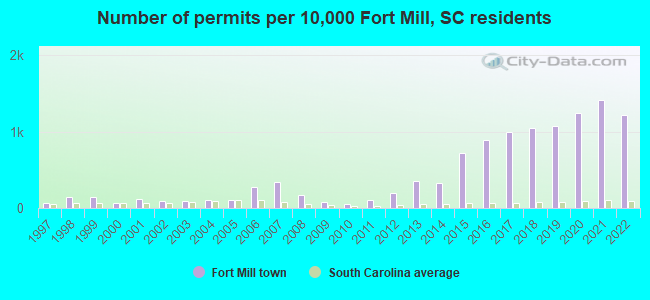
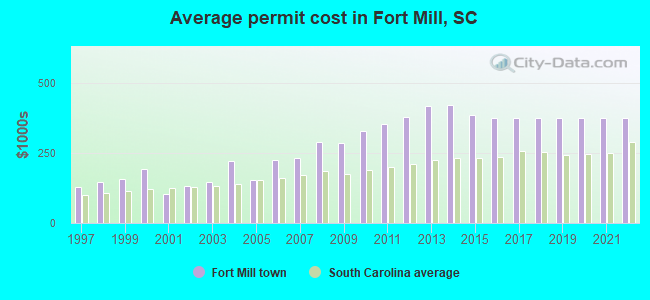
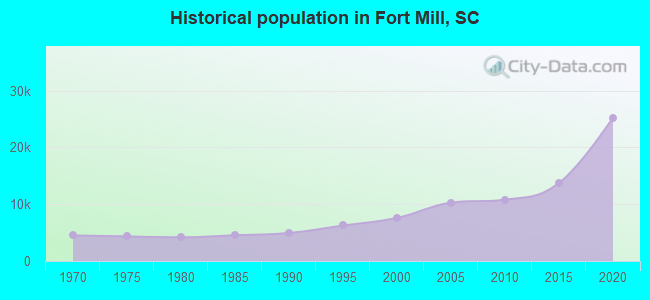
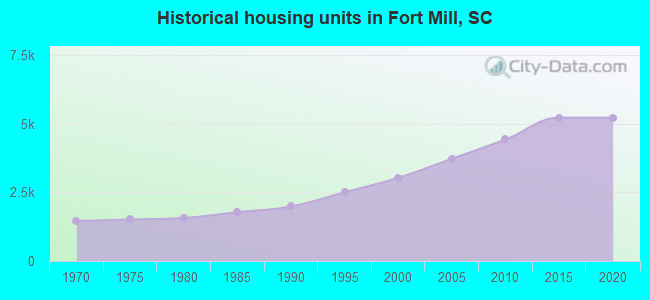
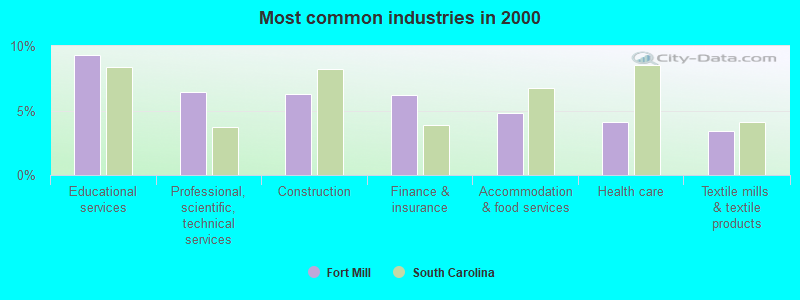
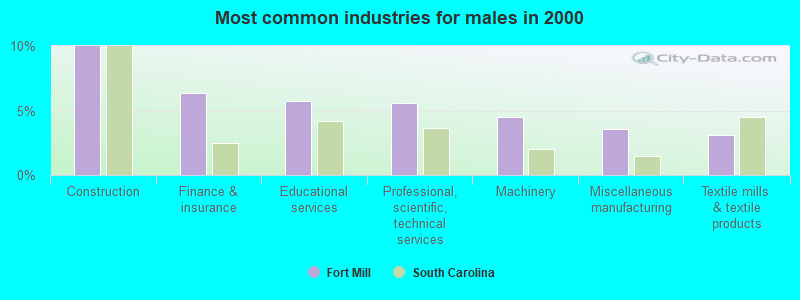
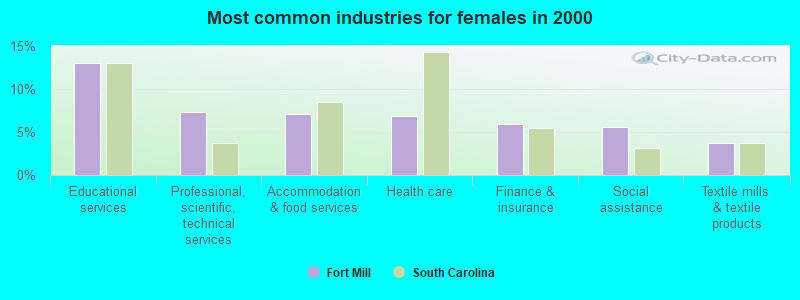
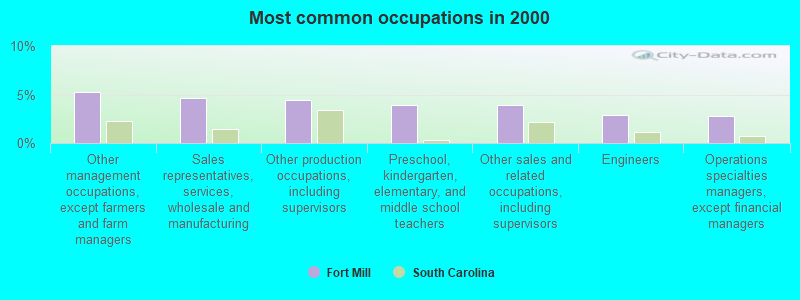
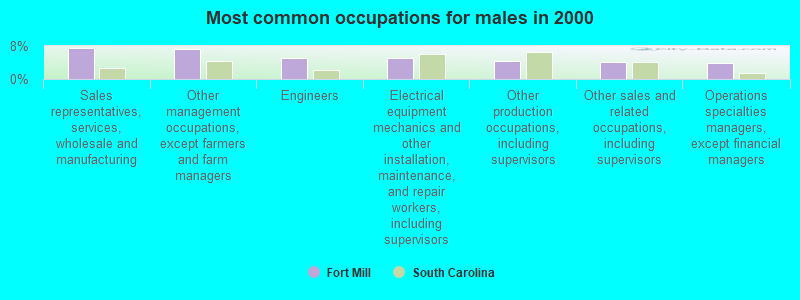
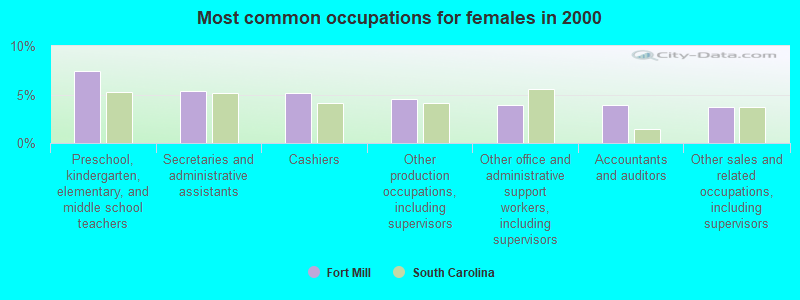
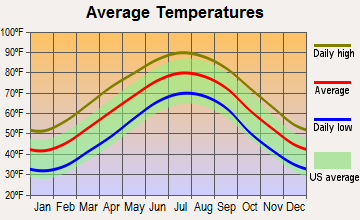
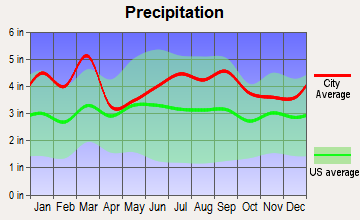
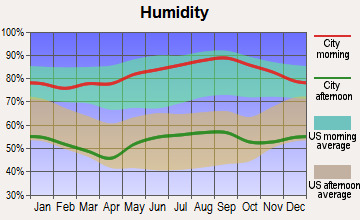
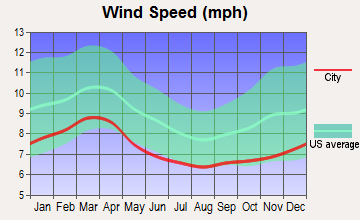
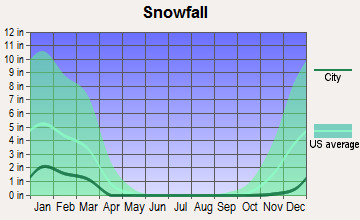
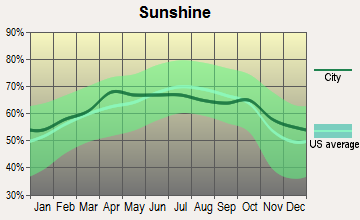
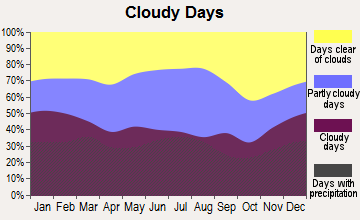
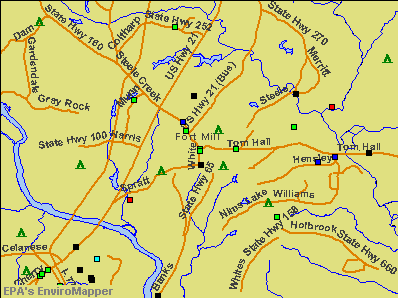

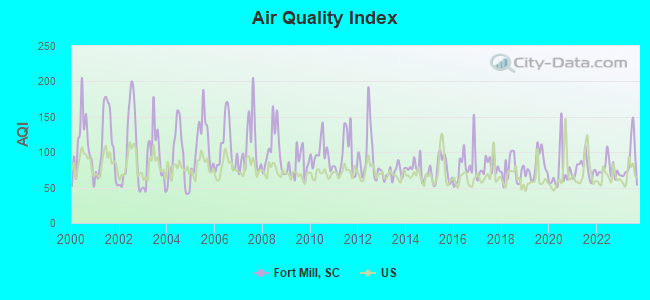
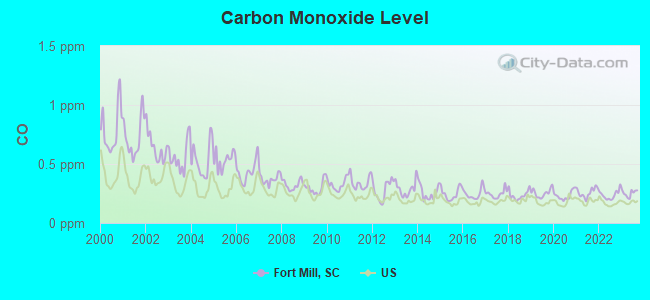
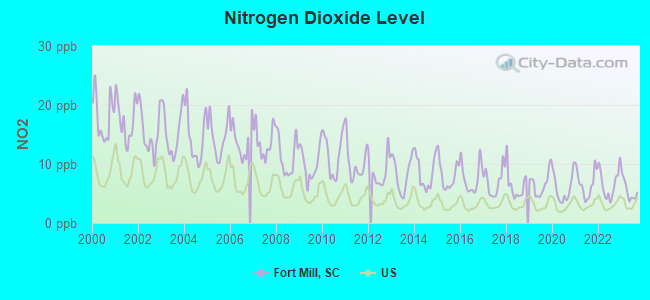
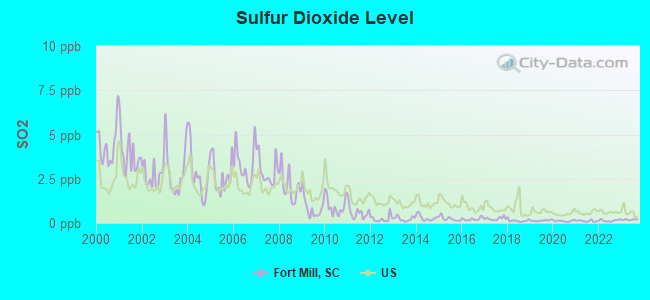
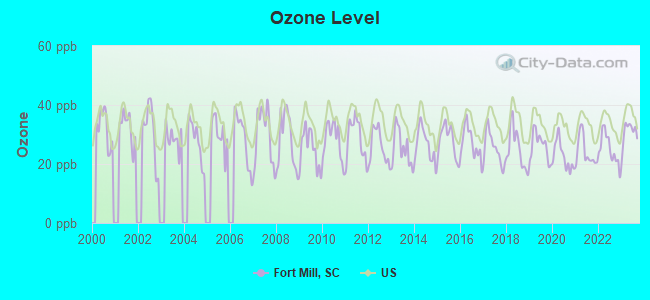
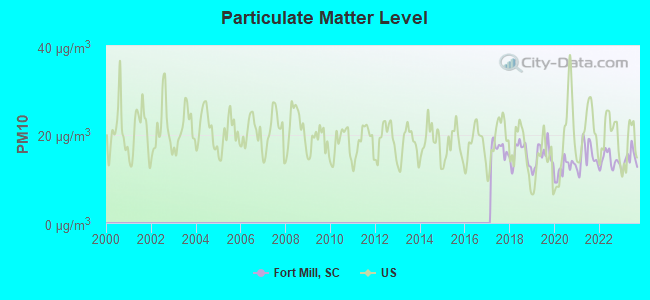
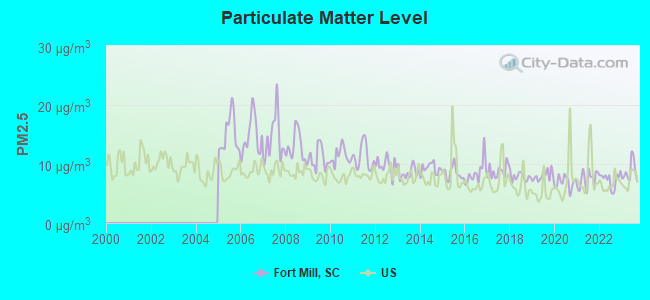
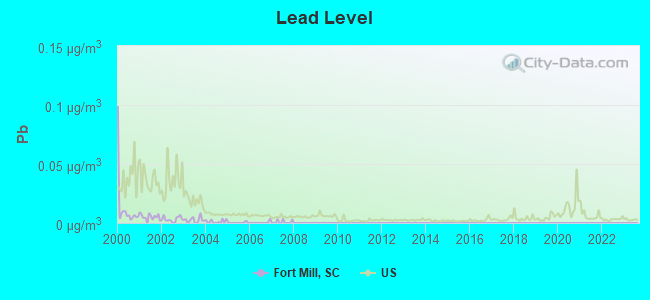
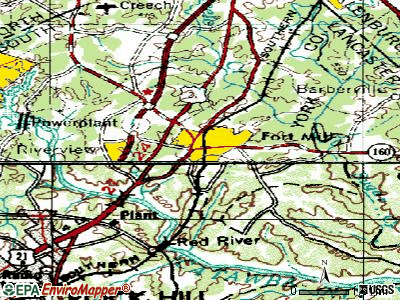
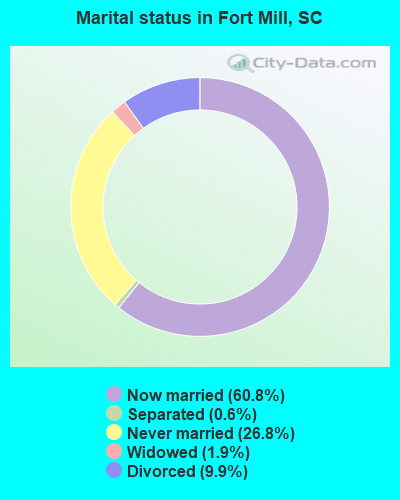
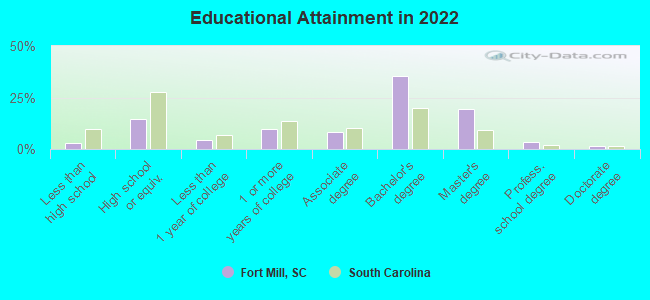

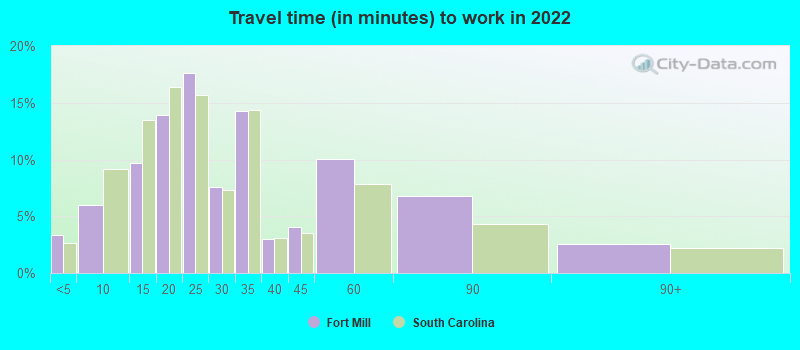
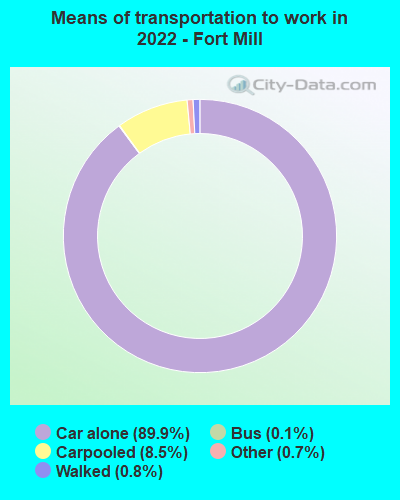
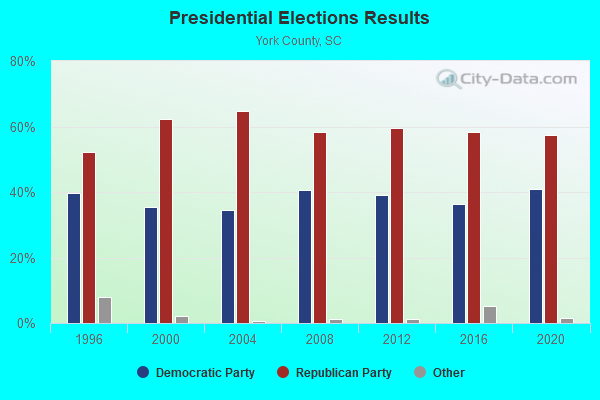
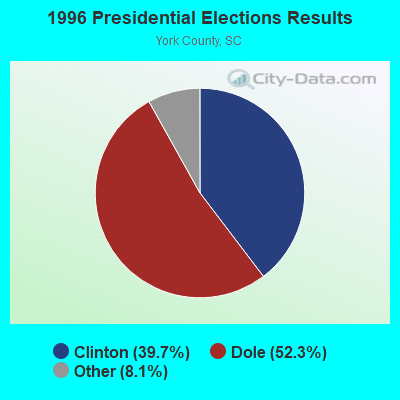
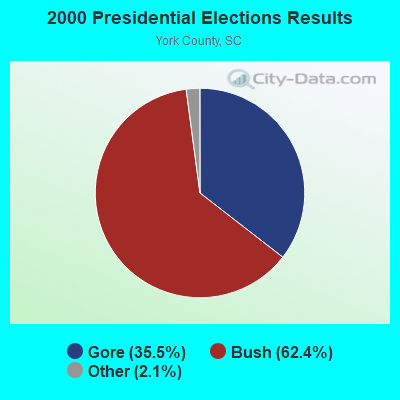
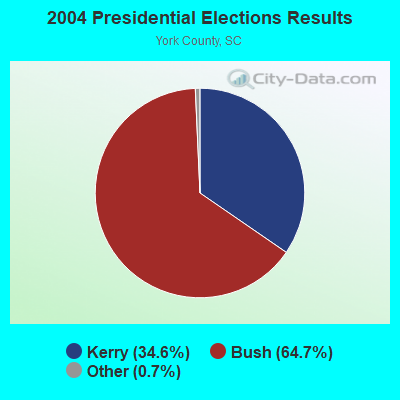
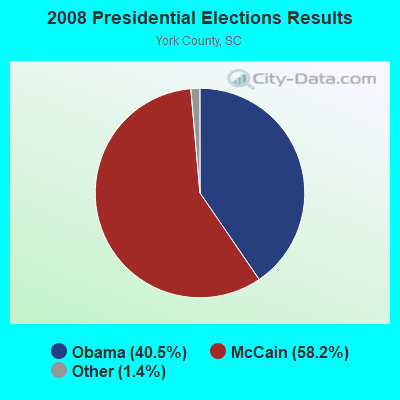
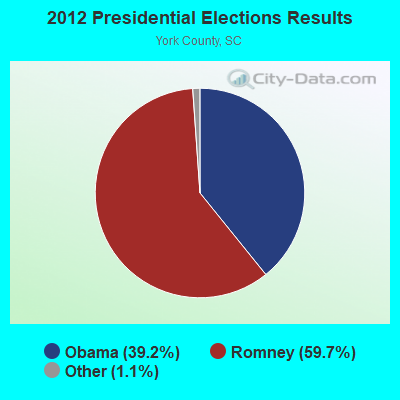
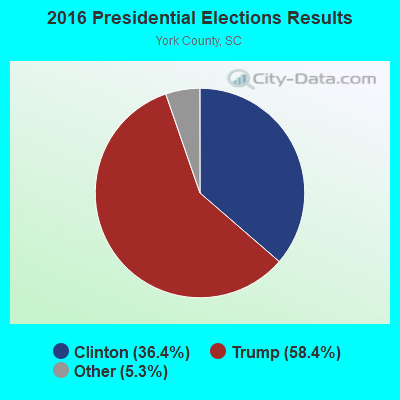
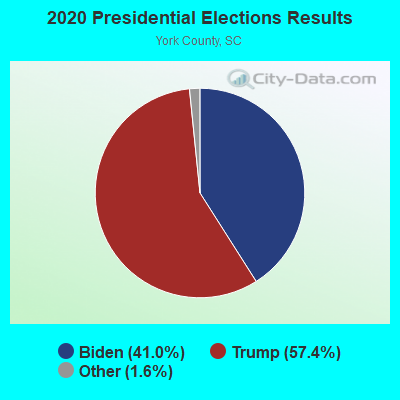
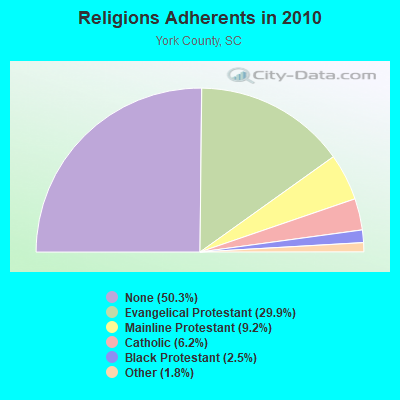
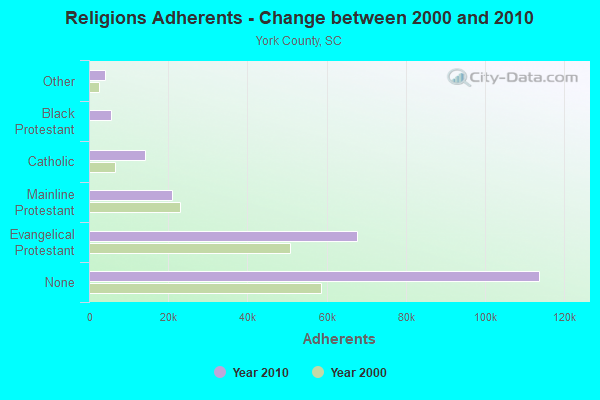
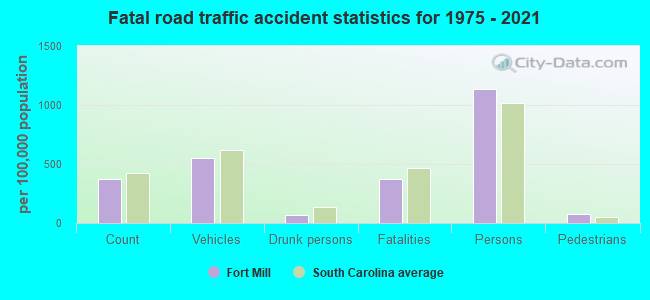
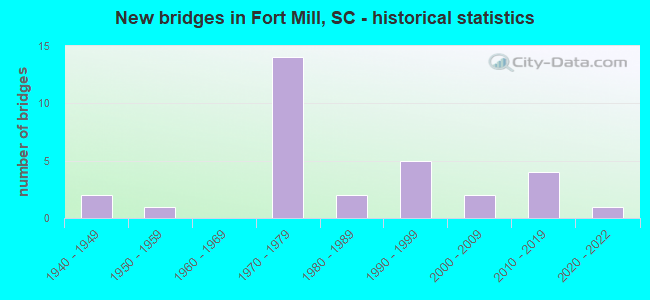
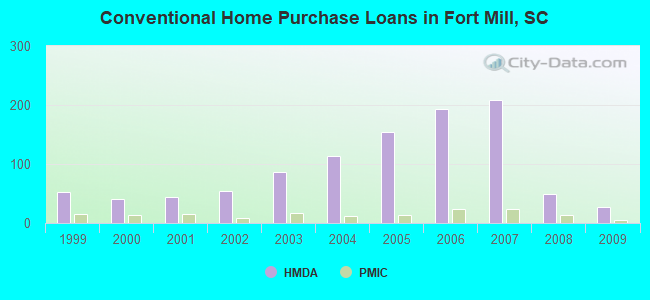
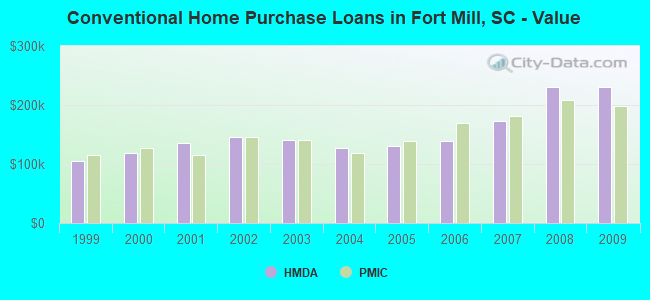
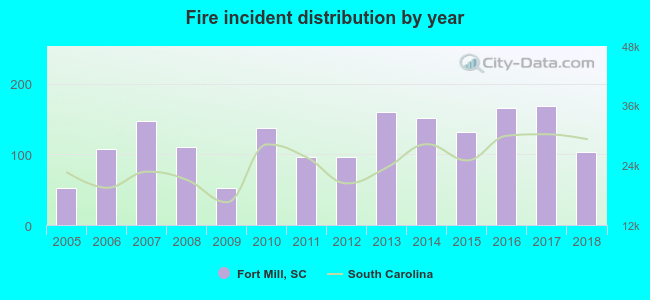 Based on the data from the years 2005 - 2018 the average number of fire incidents per year is 120. The highest number of reported fire incidents - 169 took place in 2017, and the least - 52 in 2005. The data has an increasing trend.
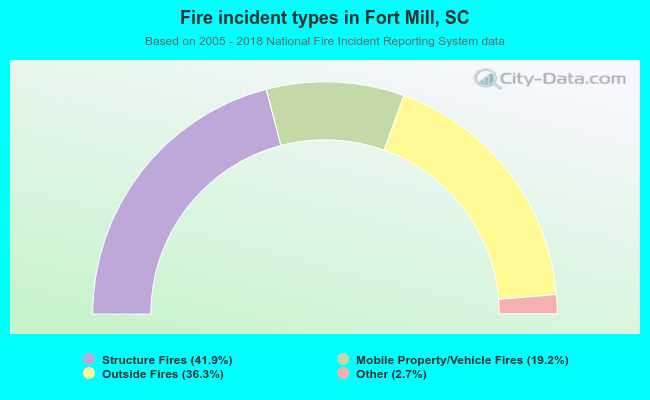 When looking into fire subcategories, the most incidents belonged to: Structure Fires (41.9%), and Outside Fires (36.3%).