Estimated zip code population in 2022: 49,128 Zip code population in 2010: 41,428 Zip code population in 2000: 18,602
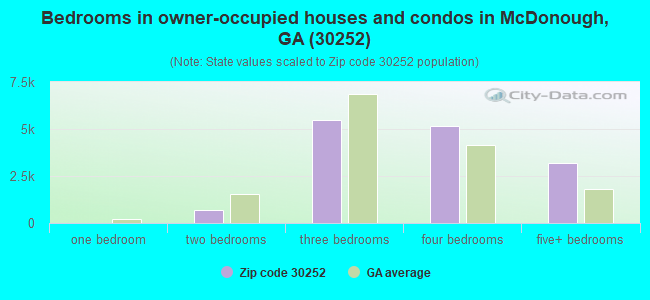
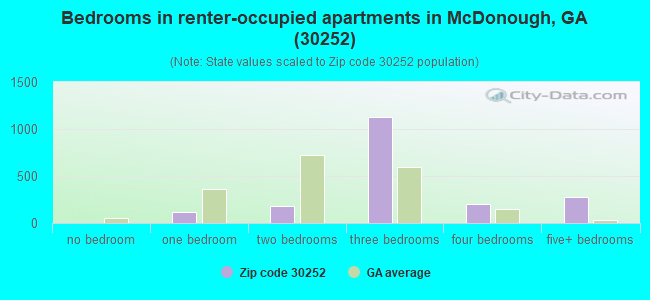
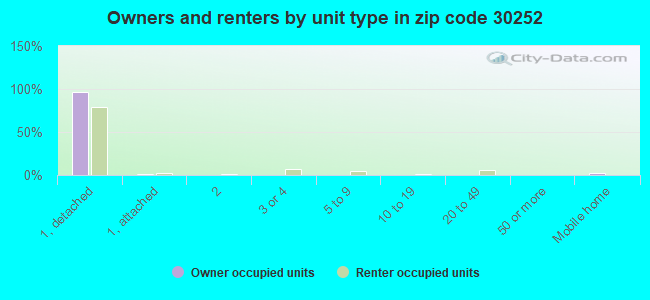
Houses and condos: 16,742 Renter-occupied apartments: 1,945
% of renters here:
12%
State:
34%
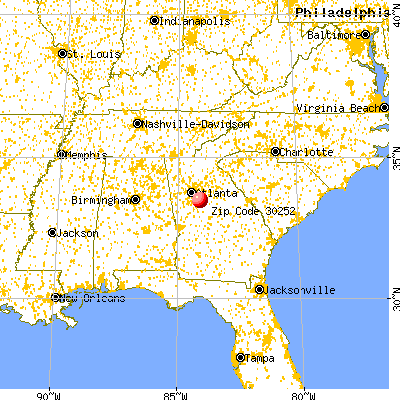
March 2022 cost of living index in zip code 30252: 102.2 (near average, U.S. average is 100)
Land area: 91.2 sq. mi. Water area: 1.3 sq. mi.
Population density: 539 people per square mile
(low).
OSM Map
General Map
Google Map
MSN Map
OSM Map
General Map
Google Map
MSN Map
OSM Map
General Map
Google Map
MSN Map
OSM Map
General Map
Google Map
MSN Map
Please wait while loading the map...
Real estate property taxes paid for housing units in 2022:
This zip code:
0.9% ($3,140)
Georgia:
0.7% ($2,160)
Median real estate property taxes paid for housing units with mortgages in 2022: $3,454 (1.0%) Median real estate property taxes paid for housing units with no mortgage in 2022: $1,628 (0.5%)
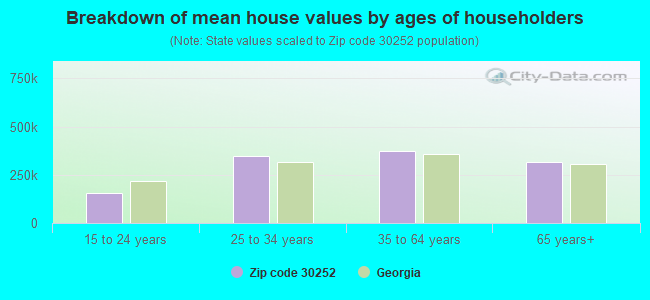
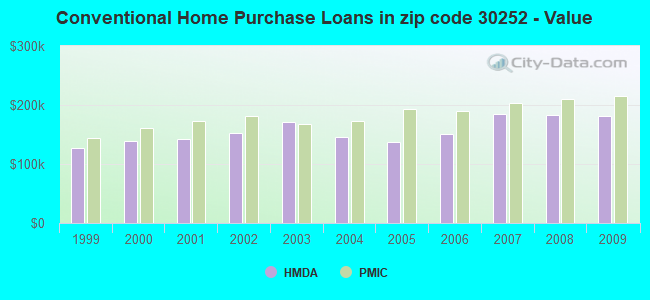
Estimated median house/condo value in 2022: $358,114
30252:
$358,114
Georgia:
$297,400
According to our research of Georgia and other state lists, there were 37 registered sex offenders living in 30252 zip code as of May 07, 2024. The ratio of all residents to sex offenders in zip code 30252 is 1,186 to 1. The ratio of registered sex offenders to all residents in this zip code is much lower than the state average.
Median resident age:
This zip code:
37.9 years
Georgia median age:
37.6 years
Average household size:
This zip code:
3.0 people
Georgia:
2.6 people
Averages for the 2020 tax year for zip code 30252, filed in 2021:
Average Adjusted Gross Income (AGI) in 2020: $69,043 (Individual Income Tax Returns)
Here:
$69,043
State:
$70,847
Salary/wage: $62,733 (reported on 83.5% of returns)
Here:
$62,733
State:
$59,126
(% of AGI for various income ranges: 1177.4% for AGIs below $25k, 3686.4% for AGIs $25k-50k, 6844.8% for AGIs $50k-75k, 10213.2% for AGIs $75k-100k, 19921.2% for AGIs $100k-200k, 71622.1% for AGIs over 200k)
Taxable interest for individuals: $1,051 (reported on 23.5% of returns)
This zip code:
$1,051
Georgia:
$2,011
(% of AGI for various income ranges: 9.5% for AGIs below $25k, 15.4% for AGIs $25k-50k, 23.8% for AGIs $50k-75k, 33.4% for AGIs $75k-100k, 68.4% for AGIs $100k-200k, 665.7% for AGIs over 200k)
Ordinary dividends: $4,032 (reported on 13.0% of returns)
Here:
$4,032
State:
$8,996
(% of AGI for various income ranges: 12.7% for AGIs below $25k, 19.3% for AGIs $25k-50k, 43.3% for AGIs $50k-75k, 56.8% for AGIs $75k-100k, 146.8% for AGIs $100k-200k, 1880.7% for AGIs over 200k)
Net capital gain/loss in AGI: +$15,528 (reported on 11.8% of returns)
Here:
+$15,528
State:
+$28,402
(% of AGI for various income ranges: 6.2% for AGIs below $25k, 15.7% for AGIs $25k-50k, 56.8% for AGIs $50k-75k, 85.4% for AGIs $75k-100k, 285.3% for AGIs $100k-200k, 11373.9% for AGIs over 200k)
Profit/loss from business: +$3,164 (reported on 24.2% of returns)
Here:
+$3,164
State:
+$6,707
(% of AGI for various income ranges: 40.7% for AGIs below $25k, 40.7% for AGIs $50k-75k, 84.1% for AGIs $75k-100k, 297.9% for AGIs $100k-200k, 3159.6% for AGIs over 200k)
Taxable individual retirement arrangement distribution: $17,331 (reported on 6.5% of returns)
30252:
$17,331
Georgia:
$20,525
(% of AGI for various income ranges: 33.7% for AGIs below $25k, 70.0% for AGIs $25k-50k, 138.9% for AGIs $50k-75k, 213.7% for AGIs $75k-100k, 434.4% for AGIs $100k-200k, 1615.7% for AGIs over 200k)
Self-employed (Keogh) retirement plans: $16,550 (reported on 0.2% of returns)
30252:
$16,550
Georgia:
$27,751
(% of AGI for various income ranges: 236.4% for AGIs over 200k)
Total itemized deductions: $29,129 (reported on 16.1% of returns)
Here:
$29,129
State:
$34,001
(% of AGI for various income ranges: 66.0% for AGIs below $25k, 273.9% for AGIs $25k-50k, 678.2% for AGIs $50k-75k, 1000.5% for AGIs $75k-100k, 1757.9% for AGIs $100k-200k, 7183.9% for AGIs over 200k)
Charity contributions: $10,407 (reported on 14.1% of returns)
Here:
$10,407
State:
$14,164
(% of AGI for various income ranges: 8.8% for AGIs below $25k, 63.9% for AGIs $25k-50k, 161.9% for AGIs $50k-75k, 254.9% for AGIs $75k-100k, 580.7% for AGIs $100k-200k, 3332.1% for AGIs over 200k)
Taxes paid: $7,491 (reported on 16.1% of returns)
30252:
$7,491
State:
$7,540
(% of AGI for various income ranges: 10.5% for AGIs below $25k, 53.5% for AGIs $25k-50k, 168.7% for AGIs $50k-75k, 265.7% for AGIs $75k-100k, 513.8% for AGIs $100k-200k, 1707.1% for AGIs over 200k)
Earned income credit: $2,487 (reported on 16.6% of returns)
Here:
$2,487
State:
$2,530
(% of AGI for various income ranges: 108.4% for AGIs below $25k, 91.4% for AGIs $25k-50k, 1.2% for AGIs $50k-75k)
Percentage of individuals using paid preparers for their 2020 taxes: 93.6%
Here:
94%
State:
93%
(% for various income ranges: 92.6% for AGIs below $25k, 94.1% for AGIs $25k-50k, 93.3% for AGIs $50k-75k, 94.3% for AGIs $75k-100k, 94.1% for AGIs $100k-200k, 94.8% for AGIs over 200k)
Averages for the 2012 tax year for zip code 30252, filed in 2013:
Average Adjusted Gross Income (AGI) in 2012: $60,473 (Individual Income Tax Returns)
Here:
$60,473
State:
$56,131
Salary/wage: $54,767 (reported on 86.1% of returns)
Here:
$54,767
State:
$47,942
(% of AGI for various income ranges: 77.8% for AGIs below $25k, 81.0% for AGIs $25k-50k, 79.1% for AGIs $50k-75k, 82.1% for AGIs $75k-100k, 81.4% for AGIs $100k-200k, 59.5% for AGIs over 200k)
Taxable interest for individuals: $1,073 (reported on 30.0% of returns)
This zip code:
$1,073
Georgia:
$1,706
(% of AGI for various income ranges: 0.8% for AGIs below $25k, 0.5% for AGIs $25k-50k, 0.5% for AGIs $50k-75k, 0.4% for AGIs $75k-100k, 0.3% for AGIs $100k-200k, 1.0% for AGIs over 200k)
Ordinary dividends: $3,143 (reported on 14.4% of returns)
Here:
$3,143
State:
$7,265
(% of AGI for various income ranges: 0.8% for AGIs below $25k, 0.6% for AGIs $25k-50k, 0.7% for AGIs $50k-75k, 0.4% for AGIs $75k-100k, 0.7% for AGIs $100k-200k, 1.6% for AGIs over 200k)
Net capital gain/loss in AGI: +$6,935 (reported on 11.0% of returns)
Here:
+$6,935
State:
+$16,323
(% of AGI for various income ranges: 0.2% for AGIs $50k-75k, 0.3% for AGIs $75k-100k, 0.5% for AGIs $100k-200k, 7.7% for AGIs over 200k)
Profit/loss from business: +$5,788 (reported on 19.4% of returns)
Here:
+$5,788
State:
+$7,583
(% of AGI for various income ranges: 7.9% for AGIs below $25k, 1.8% for AGIs $25k-50k, 1.3% for AGIs $50k-75k, 1.2% for AGIs $75k-100k, 1.2% for AGIs $100k-200k, 2.2% for AGIs over 200k)
Taxable individual retirement arrangement distribution: $14,409 (reported on 8.5% of returns)
30252:
$14,409
Georgia:
$17,199
(% of AGI for various income ranges: 2.5% for AGIs below $25k, 2.0% for AGIs $25k-50k, 1.9% for AGIs $50k-75k, 2.1% for AGIs $75k-100k, 2.1% for AGIs $100k-200k, 1.6% for AGIs over 200k)
Self-employment retirement plans: $7,733 (reported on 0.2% of returns)
30252:
$7,733
Georgia:
$23,277
Total itemized deductions: $22,061 (24% of AGI, reported on 49.7% of returns)
Here:
$22,061
State:
$23,886
Here:
23.8% of AGI
State:
21.5% of AGI
(% of AGI for various income ranges: 14.5% for AGIs below $25k, 18.6% for AGIs $25k-50k, 20.5% for AGIs $50k-75k, 19.5% for AGIs $75k-100k, 18.5% for AGIs $100k-200k, 14.1% for AGIs over 200k)
Charity contributions: $4,403 (reported on 43.5% of returns)
Here:
$4,403
State:
$5,507
(% of AGI for various income ranges: 1.5% for AGIs below $25k, 2.9% for AGIs $25k-50k, 3.2% for AGIs $50k-75k, 3.2% for AGIs $75k-100k, 3.4% for AGIs $100k-200k, 3.7% for AGIs over 200k)
Taxes paid: $6,646 (reported on 49.7% of returns)
30252:
$6,646
State:
$7,838
(% of AGI for various income ranges: 2.3% for AGIs below $25k, 3.8% for AGIs $25k-50k, 5.1% for AGIs $50k-75k, 5.8% for AGIs $75k-100k, 6.5% for AGIs $100k-200k, 6.0% for AGIs over 200k)
Earned income credit: $2,508 (reported on 18.0% of returns)
Here:
$2,508
State:
$2,589
(% of AGI for various income ranges: 8.5% for AGIs below $25k, 1.4% for AGIs $25k-50k)
Percentage of individuals using paid preparers for their 2012 taxes: 52.2%
Here:
52%
State:
55%
(% for various income ranges: 46.5% for AGIs below $25k, 53.8% for AGIs $25k-50k, 55.8% for AGIs $50k-75k, 55.2% for AGIs $75k-100k, 54.3% for AGIs $100k-200k, 66.7% for AGIs over 200k)
Averages for the 2004 tax year for zip code 30252, filed in 2005:
Average Adjusted Gross Income (AGI) in 2004: $58,282 (Individual Income Tax Returns)
Here:
$58,282
State:
$47,553
Salary/wage: $53,059 (reported on 88.1% of returns)
Here:
$53,059
State:
$42,178
(% of AGI for various income ranges: 139.5% for AGIs below $10k, 74.6% for AGIs $10k-25k, 83.2% for AGIs $25k-50k, 86.5% for AGIs $50k-75k, 86.7% for AGIs $75k-100k, 71.4% for AGIs over 100k)
Taxable interest for individuals: $1,402 (reported on 46.5% of returns)
This zip code:
$1,402
Georgia:
$1,772
(% of AGI for various income ranges: 4.6% for AGIs below $10k, 2.4% for AGIs $10k-25k, 1.0% for AGIs $25k-50k, 0.7% for AGIs $50k-75k, 0.6% for AGIs $75k-100k, 1.4% for AGIs over 100k)
Taxable dividends: $1,940 (reported on 21.2% of returns)
Here:
$1,940
State:
$4,283
(% of AGI for various income ranges: 2.8% for AGIs below $10k, 1.0% for AGIs $10k-25k, 0.4% for AGIs $25k-50k, 0.5% for AGIs $50k-75k, 0.5% for AGIs $75k-100k, 1.0% for AGIs over 100k)
Net capital gain/loss: +$11,582 (reported on 15.6% of returns)
Here:
+$11,582
State:
+$16,461
(% of AGI for various income ranges: -1.4% for AGIs below $10k, 0.3% for AGIs $10k-25k, 0.4% for AGIs $25k-50k, 0.3% for AGIs $50k-75k, 0.5% for AGIs $75k-100k, 7.5% for AGIs over 100k)
Profit/loss from business: +$8,056 (reported on 18.2% of returns)
Here:
+$8,056
State:
+$8,201
(% of AGI for various income ranges: -2.7% for AGIs below $10k, 7.0% for AGIs $10k-25k, 2.4% for AGIs $25k-50k, 1.6% for AGIs $50k-75k, 1.3% for AGIs $75k-100k, 3.3% for AGIs over 100k)
IRA payment deduction: $3,032 (reported on 2.1% of returns)
30252:
$3,032
Georgia:
$2,969
(% of AGI for various income ranges: 0.1% for AGIs $10k-25k, 0.2% for AGIs $25k-50k, 0.1% for AGIs $50k-75k, 0.1% for AGIs $75k-100k, 0.1% for AGIs over 100k)
Self-employed pension: $11,863 (reported on 0.6% of returns)
Here:
$11,863
Georgia:
$16,203
(% of AGI for various income ranges: 0.1% for AGIs $50k-75k, 0.0% for AGIs $75k-100k, 0.2% for AGIs over 100k)
Total itemized deductions: $19,670 (24% of AGI, reported on 61.5% of returns)
Here:
$19,670
State:
$19,944
Here:
24.5% of AGI
State:
22.6% of AGI
(% of AGI for various income ranges: 25.2% for AGIs below $10k, 19.3% for AGIs $10k-25k, 23.7% for AGIs $25k-50k, 24.0% for AGIs $50k-75k, 21.6% for AGIs $75k-100k, 17.5% for AGIs over 100k)
Charity contributions deductions: $3,706 (4% of AGI, reported on 55.7% of returns)
Here:
$3,706
State:
$4,354
Here:
4.5% of AGI
State:
4.7% of AGI
(% of AGI for various income ranges: 1.5% for AGIs below $10k, 2.8% for AGIs $10k-25k, 3.5% for AGIs $25k-50k, 3.6% for AGIs $50k-75k, 3.4% for AGIs $75k-100k, 3.7% for AGIs over 100k)
Total tax: $7,555 (reported on 80.7% of returns)
30252:
$7,555
State:
$8,223
(% of AGI for various income ranges: 4.4% for AGIs below $10k, 4.3% for AGIs $10k-25k, 5.9% for AGIs $25k-50k, 7.1% for AGIs $50k-75k, 8.8% for AGIs $75k-100k, 15.8% for AGIs over 100k)
Earned income credit: $1,773 (reported on 10.6% of returns)
Here:
$1,773
State:
$1,986
Percentage of individuals using paid preparers for their 2004 taxes: 57.4%
Here:
57%
State:
62%
(% for various income ranges: 44.1% for AGIs below $10k, 59.9% for AGIs $10k-25k, 59.5% for AGIs $25k-50k, 59.6% for AGIs $50k-75k, 58.2% for AGIs $75k-100k, 60.6% for AGIs over 100k)
Household received Food Stamps/SNAP in the past 12 months: 1,589 Household did not receive Food Stamps/SNAP in the past 12 months: 14,625
Women who had a birth in the past 12 months: 309 (284 now married, 25 unmarried) Women who did not have a birth in the past 12 months: 11,917 (5,281 now married, 6,631 unmarried)
Housing units in zip code 30252 with a mortgage: 11,638 (736 second mortgage, 9 home equity loan, 500 both second mortgage and home equity loan) Houses without a mortgage: 130
Median monthly owner costs for units with a mortgage: $1,767 Median monthly owner costs for units without a mortgage: $508
Residents with income below the poverty level in 2022:
This zip code:
3.8%
Whole state:
12.7%
Residents with income below 50% of the poverty level in 2022:
This zip code:
1.8%
Whole state:
6.3%
Median number of rooms in houses and condos:
Here:
7.8
State:
6.8
Median number of rooms in apartments:
Here:
6.2
State:
4.6
Notable locations in this zip code not listed on our city pages
Notable locations in zip code 30252: Henry County Fire Department Station 13 (A), Henry County Fire Department Station 10 (B), Henry County Fire Department Station 4 (C). Display/hide their locations on the map
Churches in zip code 30252 include: Antioch Baptist Church (A), Bethany Baptist Church (B), South River Church (C), Snapping Shoals Methodist Church (D), Saint James Church (E), McDonough Tabernacle (F), Landmark Church (G), Kelley Presbyterian Church (H), Fargasons Chapel (I). Display/hide their locations on the map
Cemeteries: Knight Cemetery (1), Antioch Cemetery (2), Selfridge Cemetery (3), Bonner Cemetery (4), Thompson Cemetery (5), Eastlawn Cemetery (6), Elliot Cemetery (7). Display/hide their locations on the map
Reservoirs: Lake Dow (A), Crumbley Lake (B), Iris Lakes (C), Lake Ola (D), S H Lake (E), Rape Lake (F), Duggan Lake (G), Iris Lake East (H). Display/hide their locations on the map
Streams, rivers, and creeks: Williford Branch (A), Walnut Creek (B), Kalves Creek (C), Island Shoals Creek (D), Honey Creek (E), Big Cotton Indian Creek (F), Nails Creek (G), Little Cotton Indian Creek (H). Display/hide their locations on the map
8,482 married couples with children.
2,118 single-parent households (583 men, 1,535 women).
91.4% of residents of 30252 zip code speak English at home.
3.8% of residents speak Spanish at home (88% very well, 12% well, 1% not well).
2.3% of residents speak other Indo-European language at home (90% very well, 6% well, 4% not well).
2.0% of residents speak Asian or Pacific Island language at home (58% very well, 9% well, 32% not well).
0.2% of residents speak other language at home (100% very well).
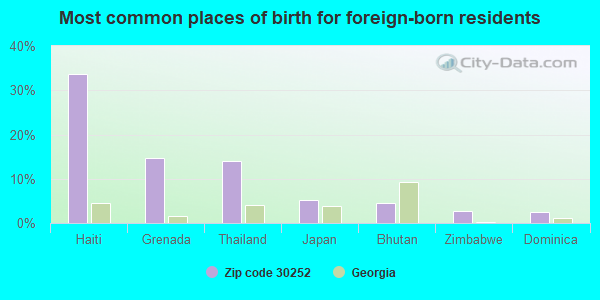
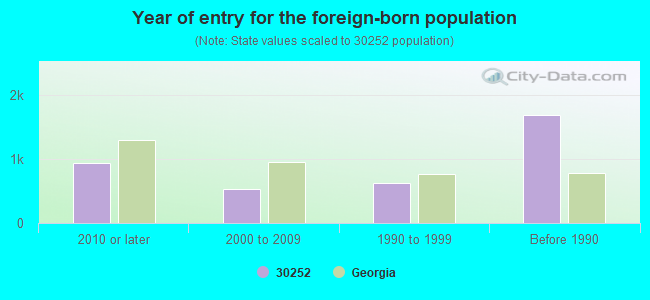
Foreign born population: 3,107 (6.3%) (77.3% of them are naturalized citizens)
Facilities with environmental interests located in this zip code:
METALFLEX MANUFACTURI (507 INDUSTRIAL BLVD. in MCDONOUGH, GA)
AIR MINOR (AIRS/AFS) Conditionally Exempt Small Quantity Generators, less than 100 kg/month of hazardous waste (Resource Conservation and Recovery Act (tracking hazardous waste)) Business SIC classification: FABRICATED PIPE AND PIPE FITTINGS Business NAICS classification: ORNAMENTAL AND ARCHITECTURAL METAL WORK MANUFACTURING. Organizations: OPERNAME (CONTACT/OPERATOR)
, METALFLEX MFG CO INC (CONTACT/OPERATOR)
, OWNERNAME (CONTACT/OWNER)
OLA ELEMENTARY SCHOOL (278 NORTH OLA ROAD in MCDONOUGH, GA)
(National Center for Education Statistics) - STATE ID-0100 Organizations: HENRY COUNTY (SCHOOL DISTRICT)
BEHR PROCESS CORPORATION (130 DECLARATION DR in MCDONOUGH, GA)
CRITERIA AND HAZARDOUS AIR POLLUTANT INVENTORY (Inventory of air pollution sources) Small Quantity Generators, between 100 kg and 1000 kg of hazardous waste/month (Resource Conservation and Recovery Act (tracking hazardous waste)) TRI REPORTER (Tracking of toxic chemicals releasing facilities) Business SIC classification: PAINTS, VARNISHES, LACQUERS, ENAMELS, AND ALLIED PRODUCTS Organizations: MASCO CORPORATION (CONTACT/OWNER)
Alternative names: BEHR PROCESS CORP.
NEW HOPE ELEMENTARY SCHOOL (1655 NEW HOPE ROAD in MCDONOUGH, GA)
National Pollutant Discharge Elimination System NON-MAJOR (Tracking pollutant discharge elimination systems) - permit Organizations: HENRY COUNTY BOARD OF ED (CONTACT/OWNER)
LAFARGE LOCUST GROVE CONCRETE PLANT (110 MICHAELS DR in MC DONOUGH, GA)
TRI REPORTER (Tracking of toxic chemicals releasing facilities) Business SIC classification: READY-MIXED CONCRETE Alternative names: JAMES FORBES
Housing units lacking complete plumbing facilities: 0.2% Housing units lacking complete kitchen facilities: 0.3%
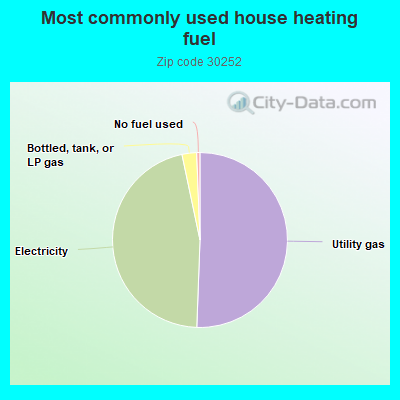
50.6%Utility gas
46.1%Electricity
2.7%Bottled, tank, or LP gas
0.6%No fuel used
Place of birth for U.S.-born residents:
This state: 24,324
Northeast: 4,925
Midwest: 3,891
South: 10,399
West: 1,672
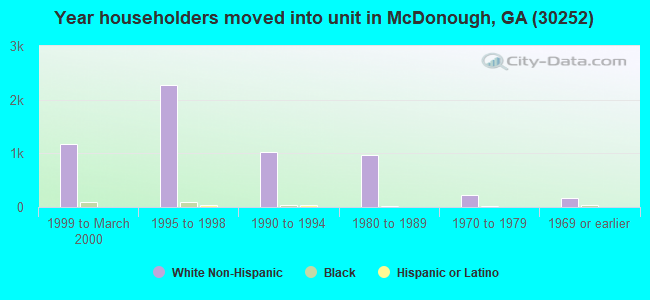
46% of the 30252 zip code residents lived in the same house 5 years ago. Out of people who lived in different houses, 38% lived in this county. Out of people who lived in different counties, 50% lived in Georgia.
92% of the 30252 zip code residents lived in the same house 1 year ago. Out of people who lived in different houses, 39% moved from this county. Out of people who lived in different houses, 33% moved from different county within same state. Out of people who lived in different houses, 26% moved from different state. Out of people who lived in different houses, 3% moved from abroad.
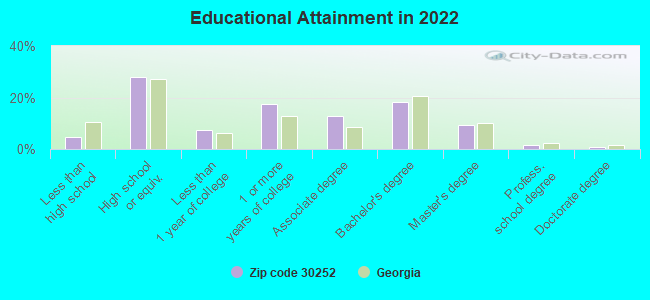
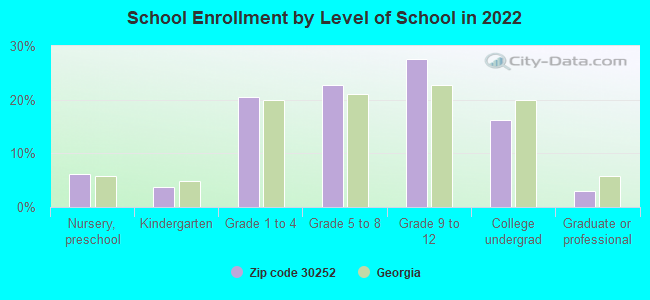
Private vs. public school enrollment:
Students in private schools in grades 1 to 8 (elementary and middle school): 902
Here:
14.5%
Georgia:
12.1%
Students in private schools in grades 9 to 12 (high school): 257
Here:
6.5%
Georgia:
10.8%
Students in private undergraduate colleges: 498
Here:
21.5%
Georgia:
17.1%
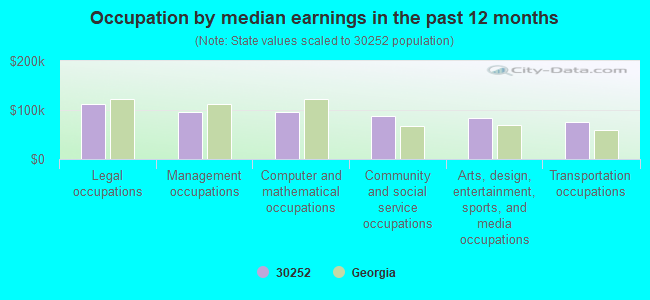
Occupation by median earnings in the past 12 months ($)
112,718Legal occupations
96,138Management occupations
95,531Computer and mathematical occupations
86,962Community and social service occupations
84,449Arts, design, entertainment, sports, and media occupations
74,843Transportation occupations
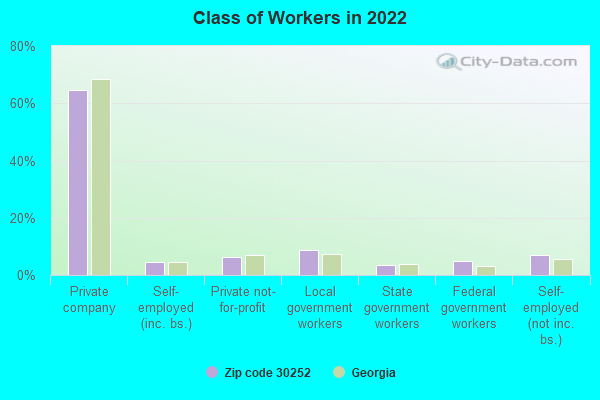
Companies with federal contracts located in this zip code:
GUIDED SYSTEMS TECHNOLOGIES,IN (618 INDIAN COTTON TRL in MCDONOUGH, GA; small business) : $3,153,289 in 15 contractsfrom 2000 to 2006
Contracts for Other Defense -- Management and Support (R&D), Physical Sciences -- Management and Support (R&D), Ammunition -- Management and Support (R&D), Ammunition -- Advanced Development (R&D), and moreby Air Force, Missile Defense Agency, Navy Signed by year:2000: $200,000; 2001: $738,375; 2002: $725,000; 2003: $0; 2004: $1,239,932; 2005: $99,982; 2006: $150,000.
Biggest contracts:
$500,000 with Air Force for Other Defense -- Management and Support (R&D). Signed on 2004-01-14. Completion date: 2005-07-15.
$499,932 with Air Force for Physical Sciences -- Management and Support (R&D). Signed on 2004-04-30. Completion date: 2006-04-30.
$375,000 with Air Force for Other Defense -- Management and Support (R&D). Signed on 2002-03-21. Completion date: 2003-03-09.
$375,000, same as above.Signed on 2001-03-02. Completion date: 2003-03-09.
ALKENTOR BUSINESS DYNAMICS (1208 LULLWATER WAY in MCDONOUGH, GA; small business) : $153,600 in 5 contractsfrom 2002 to 2005
Contracts for Other Management Support Services, Vocational/Technical by Army Signed by year:2000: $0; 2001: $0; 2002: $30,500; 2003: $30,500; 2004: $50,000; 2005: $42,600; 2006: $0.
Biggest contracts:
$42,600 with Army for Other Management Support Services. Signed on 2005-09-30. Completion date: 2006-09-26.
$40,000 with Army for Vocational/Technical. Signed on 2004-09-16. Completion date: 2003-09-22.
$30,500, same as above.Signed on 2003-09-13. Completion date: 2003-09-22.
$30,500, same as above.Signed on 2002-09-22. Completion date: 2003-09-22.
FAITH MECHANICAL SERVICES (1810 KING MILL RD in MCDONOUGH, GA; small business) : $32,014 in 6 contractsfrom 2004 to 2006
Contracts for Maintenance, Repair or Alteration of Real Property -- Miscellaneous Buildings, Printing, Duplicating, and Bookbinding Equipment by Army Signed by year:2000: $0; 2001: $0; 2002: $0; 2003: $0; 2004: $21,625; 2005: $5,650; 2006: $4,739.
Biggest contracts:
$9,250 with Army for Maintenance, Repair or Alteration of Real Property -- Miscellaneous Buildings. Signed on 2004-09-24. Completion date: 2004-09-30.
$7,850, same as above.Signed on 2004-05-20. Completion date: 2004-06-30.
$5,650, same as above.Signed on 2005-04-12. Completion date: 2005-04-29.
$4,739 with Army for Printing, Duplicating, and Bookbinding Equipment. Taking place in NJ. Signed on 2006-04-27. Completion date: 2006-09-30.
Top industries in this zip code by the number of employees in 2005:
Administrative and Support and Waste Management and Remediation Services: Temporary Help Services (250-499 employees: 1 establishment, 1-4 employees: 1 establishment)
Other Services (except Public Administration): Religious Organizations (50-99: 1, 20-49: 1, 10-19: 4, 5-9: 4, 1-4: 10)
Educational Services: Elementary and Secondary Schools (100-249: 1)
2002 - 2018 National Fire Incident Reporting System (NFIRS) incidents
According to the data from the years 2002 - 2018 the average number of fires per year is 87. The highest number of fire incidents - 181 took place in 2008, and the least - 8 in 2005. The data has a declining trend.
When looking into fire subcategories, the most incidents belonged to: Outside Fires (55.5%), and Structure Fires (30.0%).
Fire incident types reported to NFIRS in Zip Code 30252


 Nearest zip codes: 30253, 30248, 30016, 30094, 30234, 30281.


 According to the data from the years 2002 - 2018 the average number of fires per year is 87. The highest number of fire incidents - 181 took place in 2008, and the least - 8 in 2005. The data has a declining trend.
 When looking into fire subcategories, the most incidents belonged to: Outside Fires (55.5%), and Structure Fires (30.0%).