Estimated zip code population in 2022: 32,507
Zip code population in 2010: 23,249
Zip code population in 2000: 11,151
Houses and condos: 11,122
Renter-occupied apartments: 1,879
% of renters here:
18%State:
34%
March 2022 cost of living index in zip code 30248: 100.7
(near average, U.S. average is 100)
Land area: 70.6
sq. mi.
Water area: 0.6
sq. mi.
Population density: 461 people per square mile (low).
OSM Map
General Map
Google Map
MSN Map
OSM Map
General Map
Google Map
MSN Map
OSM Map
General Map
Google Map
MSN Map
OSM Map
General Map
Google Map
MSN Map
Please wait while loading the map...
Real estate property taxes paid for housing units in 2022:
This zip code:
0.9% ($2,463)Georgia:
0.7% ($2,160)
Median real estate property taxes paid for housing units with mortgages in 2022: $2,514 (0.9%)
Median real estate property taxes paid for housing units with no mortgage in 2022: $2,029 (0.7%)
Profiles of local businesses
Business Search - 14 Million verified businesses
Males: 15,400 Females: 17,109
For population 25 years and over in 30248:
High school or higher: 93.3%Bachelor's degree or higher: 26.8%Graduate or professional degree: 9.3%Unemployed: 3.3%Mean travel time to work (commute): 34.6 minutes
For population 15 years and over in 30248:
Never married: 32.1%Now married: 50.1%Separated: 1.5%Widowed: 3.6%Divorced: 12.7%
Zip code 30248 compared to state average:
Foreign-born population percentage below state average. Renting percentage below state average. House age significantly below state average. 18,480 56.9% White 10,430 32.1% Black 2,895 8.9% Hispanic or Latino 280 0.9% Asian 276 0.8% Two or more races 112 0.3% Some other race 30 0.09% American Indian
Data:
Median household income ($)
Median household income (% change since 2000)
Household income diversity
Ratio of average income to average house value (%)
Ratio of average income to average rent
Median household income ($) - White
Median household income ($) - Black or African American
Median household income ($) - Asian
Median household income ($) - Hispanic or Latino
Median household income ($) - American Indian and Alaska Native
Median household income ($) - Multirace
Median household income ($) - Other Race
Median household income for houses/condos with a mortgage ($)
Median household income for apartments without a mortgage ($)
Races - White alone (%)
Races - White alone (% change since 2000)
Races - Black alone (%)
Races - Black alone (% change since 2000)
Races - American Indian alone (%)
Races - American Indian alone (% change since 2000)
Races - Asian alone (%)
Races - Asian alone (% change since 2000)
Races - Hispanic (%)
Races - Hispanic (% change since 2000)
Races - Native Hawaiian and Other Pacific Islander alone (%)
Races - Native Hawaiian and Other Pacific Islander alone (% change since 2000)
Races - Two or more races (%)
Races - Two or more races (% change since 2000)
Races - Other race alone (%)
Races - Other race alone (% change since 2000)
Racial diversity
Unemployment (%)
Unemployment (% change since 2000)
Unemployment (%) - White
Unemployment (%) - Black or African American
Unemployment (%) - Asian
Unemployment (%) - Hispanic or Latino
Unemployment (%) - American Indian and Alaska Native
Unemployment (%) - Multirace
Unemployment (%) - Other Race
Population density (people per square mile)
Population - Males (%)
Population - Females (%)
Population - Males (%) - White
Population - Males (%) - Black or African American
Population - Males (%) - Asian
Population - Males (%) - Hispanic or Latino
Population - Males (%) - American Indian and Alaska Native
Population - Males (%) - Multirace
Population - Males (%) - Other Race
Population - Females (%) - White
Population - Females (%) - Black or African American
Population - Females (%) - Asian
Population - Females (%) - Hispanic or Latino
Population - Females (%) - American Indian and Alaska Native
Population - Females (%) - Multirace
Population - Females (%) - Other Race
Coronavirus confirmed cases (Apr 27, 2024)
Deaths caused by coronavirus (Apr 27, 2024)
Coronavirus confirmed cases (per 100k population) (Apr 27, 2024)
Deaths caused by coronavirus (per 100k population) (Apr 27, 2024)
Daily increase in number of cases (Apr 27, 2024)
Weekly increase in number of cases (Apr 27, 2024)
Cases doubled (in days) (Apr 27, 2024)
Hospitalized patients (Apr 18, 2022)
Negative test results (Apr 18, 2022)
Total test results (Apr 18, 2022)
COVID Vaccine doses distributed (per 100k population) (Sep 19, 2023)
COVID Vaccine doses administered (per 100k population) (Sep 19, 2023)
COVID Vaccine doses distributed (Sep 19, 2023)
COVID Vaccine doses administered (Sep 19, 2023)
Likely homosexual households (%)
Likely homosexual households (% change since 2000)
Likely homosexual households - Lesbian couples (%)
Likely homosexual households - Lesbian couples (% change since 2000)
Likely homosexual households - Gay men (%)
Likely homosexual households - Gay men (% change since 2000)
Cost of living index
Median gross rent ($)
Median contract rent ($)
Median monthly housing costs ($)
Median house or condo value ($)
Median house or condo value ($ change since 2000)
Mean house or condo value by units in structure - 1, detached ($)
Mean house or condo value by units in structure - 1, attached ($)
Mean house or condo value by units in structure - 2 ($)
Mean house or condo value by units in structure by units in structure - 3 or 4 ($)
Mean house or condo value by units in structure - 5 or more ($)
Mean house or condo value by units in structure - Boat, RV, van, etc. ($)
Mean house or condo value by units in structure - Mobile home ($)
Median house or condo value ($) - White
Median house or condo value ($) - Black or African American
Median house or condo value ($) - Asian
Median house or condo value ($) - Hispanic or Latino
Median house or condo value ($) - American Indian and Alaska Native
Median house or condo value ($) - Multirace
Median house or condo value ($) - Other Race
Median resident age
Resident age diversity
Median resident age - Males
Median resident age - Females
Median resident age - White
Median resident age - Black or African American
Median resident age - Asian
Median resident age - Hispanic or Latino
Median resident age - American Indian and Alaska Native
Median resident age - Multirace
Median resident age - Other Race
Median resident age - Males - White
Median resident age - Males - Black or African American
Median resident age - Males - Asian
Median resident age - Males - Hispanic or Latino
Median resident age - Males - American Indian and Alaska Native
Median resident age - Males - Multirace
Median resident age - Males - Other Race
Median resident age - Females - White
Median resident age - Females - Black or African American
Median resident age - Females - Asian
Median resident age - Females - Hispanic or Latino
Median resident age - Females - American Indian and Alaska Native
Median resident age - Females - Multirace
Median resident age - Females - Other Race
Commute - mean travel time to work (minutes)
Travel time to work - Less than 5 minutes (%)
Travel time to work - Less than 5 minutes (% change since 2000)
Travel time to work - 5 to 9 minutes (%)
Travel time to work - 5 to 9 minutes (% change since 2000)
Travel time to work - 10 to 19 minutes (%)
Travel time to work - 10 to 19 minutes (% change since 2000)
Travel time to work - 20 to 29 minutes (%)
Travel time to work - 20 to 29 minutes (% change since 2000)
Travel time to work - 30 to 39 minutes (%)
Travel time to work - 30 to 39 minutes (% change since 2000)
Travel time to work - 40 to 59 minutes (%)
Travel time to work - 40 to 59 minutes (% change since 2000)
Travel time to work - 60 to 89 minutes (%)
Travel time to work - 60 to 89 minutes (% change since 2000)
Travel time to work - 90 or more minutes (%)
Travel time to work - 90 or more minutes (% change since 2000)
Marital status - Never married (%)
Marital status - Now married (%)
Marital status - Separated (%)
Marital status - Widowed (%)
Marital status - Divorced (%)
Median family income ($)
Median family income (% change since 2000)
Median non-family income ($)
Median non-family income (% change since 2000)
Median per capita income ($)
Median per capita income (% change since 2000)
Median family income ($) - White
Median family income ($) - Black or African American
Median family income ($) - Asian
Median family income ($) - Hispanic or Latino
Median family income ($) - American Indian and Alaska Native
Median family income ($) - Multirace
Median family income ($) - Other Race
Median year house/condo built
Median year apartment built
Year house built - Built 2005 or later (%)
Year house built - Built 2000 to 2004 (%)
Year house built - Built 1990 to 1999 (%)
Year house built - Built 1980 to 1989 (%)
Year house built - Built 1970 to 1979 (%)
Year house built - Built 1960 to 1969 (%)
Year house built - Built 1950 to 1959 (%)
Year house built - Built 1940 to 1949 (%)
Year house built - Built 1939 or earlier (%)
Average household size
Household density (households per square mile)
Average household size - White
Average household size - Black or African American
Average household size - Asian
Average household size - Hispanic or Latino
Average household size - American Indian and Alaska Native
Average household size - Multirace
Average household size - Other Race
Occupied housing units (%)
Vacant housing units (%)
Owner occupied housing units (%)
Renter occupied housing units (%)
Vacancy status - For rent (%)
Vacancy status - For sale only (%)
Vacancy status - Rented or sold, not occupied (%)
Vacancy status - For seasonal, recreational, or occasional use (%)
Vacancy status - For migrant workers (%)
Vacancy status - Other vacant (%)
Residents with income below the poverty level (%)
Residents with income below 50% of the poverty level (%)
Children below poverty level (%)
Poor families by family type - Married-couple family (%)
Poor families by family type - Male, no wife present (%)
Poor families by family type - Female, no husband present (%)
Poverty status for native-born residents (%)
Poverty status for foreign-born residents (%)
Poverty among high school graduates not in families (%)
Poverty among people who did not graduate high school not in families (%)
Residents with income below the poverty level (%) - White
Residents with income below the poverty level (%) - Black or African American
Residents with income below the poverty level (%) - Asian
Residents with income below the poverty level (%) - Hispanic or Latino
Residents with income below the poverty level (%) - American Indian and Alaska Native
Residents with income below the poverty level (%) - Multirace
Residents with income below the poverty level (%) - Other Race
Air pollution - Air Quality Index (AQI)
Air pollution - CO
Air pollution - NO2
Air pollution - SO2
Air pollution - Ozone
Air pollution - PM10
Air pollution - PM25
Air pollution - Pb
Crime - Murders per 100,000 population
Crime - Rapes per 100,000 population
Crime - Robberies per 100,000 population
Crime - Assaults per 100,000 population
Crime - Burglaries per 100,000 population
Crime - Thefts per 100,000 population
Crime - Auto thefts per 100,000 population
Crime - Arson per 100,000 population
Crime - City-data.com crime index
Crime - Violent crime index
Crime - Property crime index
Crime - Murders per 100,000 population (5 year average)
Crime - Rapes per 100,000 population (5 year average)
Crime - Robberies per 100,000 population (5 year average)
Crime - Assaults per 100,000 population (5 year average)
Crime - Burglaries per 100,000 population (5 year average)
Crime - Thefts per 100,000 population (5 year average)
Crime - Auto thefts per 100,000 population (5 year average)
Crime - Arson per 100,000 population (5 year average)
Crime - City-data.com crime index (5 year average)
Crime - Violent crime index (5 year average)
Crime - Property crime index (5 year average)
1996 Presidential Elections Results (%) - Democratic Party (Clinton)
1996 Presidential Elections Results (%) - Republican Party (Dole)
1996 Presidential Elections Results (%) - Other
2000 Presidential Elections Results (%) - Democratic Party (Gore)
2000 Presidential Elections Results (%) - Republican Party (Bush)
2000 Presidential Elections Results (%) - Other
2004 Presidential Elections Results (%) - Democratic Party (Kerry)
2004 Presidential Elections Results (%) - Republican Party (Bush)
2004 Presidential Elections Results (%) - Other
2008 Presidential Elections Results (%) - Democratic Party (Obama)
2008 Presidential Elections Results (%) - Republican Party (McCain)
2008 Presidential Elections Results (%) - Other
2012 Presidential Elections Results (%) - Democratic Party (Obama)
2012 Presidential Elections Results (%) - Republican Party (Romney)
2012 Presidential Elections Results (%) - Other
2016 Presidential Elections Results (%) - Democratic Party (Clinton)
2016 Presidential Elections Results (%) - Republican Party (Trump)
2016 Presidential Elections Results (%) - Other
2020 Presidential Elections Results (%) - Democratic Party (Biden)
2020 Presidential Elections Results (%) - Republican Party (Trump)
2020 Presidential Elections Results (%) - Other
Ancestries Reported - Arab (%)
Ancestries Reported - Czech (%)
Ancestries Reported - Danish (%)
Ancestries Reported - Dutch (%)
Ancestries Reported - English (%)
Ancestries Reported - French (%)
Ancestries Reported - French Canadian (%)
Ancestries Reported - German (%)
Ancestries Reported - Greek (%)
Ancestries Reported - Hungarian (%)
Ancestries Reported - Irish (%)
Ancestries Reported - Italian (%)
Ancestries Reported - Lithuanian (%)
Ancestries Reported - Norwegian (%)
Ancestries Reported - Polish (%)
Ancestries Reported - Portuguese (%)
Ancestries Reported - Russian (%)
Ancestries Reported - Scotch-Irish (%)
Ancestries Reported - Scottish (%)
Ancestries Reported - Slovak (%)
Ancestries Reported - Subsaharan African (%)
Ancestries Reported - Swedish (%)
Ancestries Reported - Swiss (%)
Ancestries Reported - Ukrainian (%)
Ancestries Reported - United States (%)
Ancestries Reported - Welsh (%)
Ancestries Reported - West Indian (%)
Ancestries Reported - Other (%)
Educational Attainment - No schooling completed (%)
Educational Attainment - Less than high school (%)
Educational Attainment - High school or equivalent (%)
Educational Attainment - Less than 1 year of college (%)
Educational Attainment - 1 or more years of college (%)
Educational Attainment - Associate degree (%)
Educational Attainment - Bachelor's degree (%)
Educational Attainment - Master's degree (%)
Educational Attainment - Professional school degree (%)
Educational Attainment - Doctorate degree (%)
School Enrollment - Nursery, preschool (%)
School Enrollment - Kindergarten (%)
School Enrollment - Grade 1 to 4 (%)
School Enrollment - Grade 5 to 8 (%)
School Enrollment - Grade 9 to 12 (%)
School Enrollment - College undergrad (%)
School Enrollment - Graduate or professional (%)
School Enrollment - Not enrolled in school (%)
School enrollment - Public schools (%)
School enrollment - Private schools (%)
School enrollment - Not enrolled (%)
Median number of rooms in houses and condos
Median number of rooms in apartments
Housing units lacking complete plumbing facilities (%)
Housing units lacking complete kitchen facilities (%)
Density of houses
Urban houses (%)
Rural houses (%)
Households with people 60 years and over (%)
Households with people 65 years and over (%)
Households with people 75 years and over (%)
Households with one or more nonrelatives (%)
Households with no nonrelatives (%)
Population in households (%)
Family households (%)
Nonfamily households (%)
Population in families (%)
Family households with own children (%)
Median number of bedrooms in owner occupied houses
Mean number of bedrooms in owner occupied houses
Median number of bedrooms in renter occupied houses
Mean number of bedrooms in renter occupied houses
Median number of vehichles in owner occupied houses
Mean number of vehichles in owner occupied houses
Median number of vehichles in renter occupied houses
Mean number of vehichles in renter occupied houses
Mortgage status - with mortgage (%)
Mortgage status - with second mortgage (%)
Mortgage status - with home equity loan (%)
Mortgage status - with both second mortgage and home equity loan (%)
Mortgage status - without a mortgage (%)
Average family size
Average family size - White
Average family size - Black or African American
Average family size - Asian
Average family size - Hispanic or Latino
Average family size - American Indian and Alaska Native
Average family size - Multirace
Average family size - Other Race
Geographical mobility - Same house 1 year ago (%)
Geographical mobility - Moved within same county (%)
Geographical mobility - Moved from different county within same state (%)
Geographical mobility - Moved from different state (%)
Geographical mobility - Moved from abroad (%)
Place of birth - Born in state of residence (%)
Place of birth - Born in other state (%)
Place of birth - Native, outside of US (%)
Place of birth - Foreign born (%)
Housing units in structures - 1, detached (%)
Housing units in structures - 1, attached (%)
Housing units in structures - 2 (%)
Housing units in structures - 3 or 4 (%)
Housing units in structures - 5 to 9 (%)
Housing units in structures - 10 to 19 (%)
Housing units in structures - 20 to 49 (%)
Housing units in structures - 50 or more (%)
Housing units in structures - Mobile home (%)
Housing units in structures - Boat, RV, van, etc. (%)
House/condo owner moved in on average (years ago)
Renter moved in on average (years ago)
Year householder moved into unit - Moved in 1999 to March 2000 (%)
Year householder moved into unit - Moved in 1995 to 1998 (%)
Year householder moved into unit - Moved in 1990 to 1994 (%)
Year householder moved into unit - Moved in 1980 to 1989 (%)
Year householder moved into unit - Moved in 1970 to 1979 (%)
Year householder moved into unit - Moved in 1969 or earlier (%)
Means of transportation to work - Drove car alone (%)
Means of transportation to work - Carpooled (%)
Means of transportation to work - Public transportation (%)
Means of transportation to work - Bus or trolley bus (%)
Means of transportation to work - Streetcar or trolley car (%)
Means of transportation to work - Subway or elevated (%)
Means of transportation to work - Railroad (%)
Means of transportation to work - Ferryboat (%)
Means of transportation to work - Taxicab (%)
Means of transportation to work - Motorcycle (%)
Means of transportation to work - Bicycle (%)
Means of transportation to work - Walked (%)
Means of transportation to work - Other means (%)
Working at home (%)
Industry diversity
Most Common Industries - Agriculture, forestry, fishing and hunting, and mining (%)
Most Common Industries - Agriculture, forestry, fishing and hunting (%)
Most Common Industries - Mining, quarrying, and oil and gas extraction (%)
Most Common Industries - Construction (%)
Most Common Industries - Manufacturing (%)
Most Common Industries - Wholesale trade (%)
Most Common Industries - Retail trade (%)
Most Common Industries - Transportation and warehousing, and utilities (%)
Most Common Industries - Transportation and warehousing (%)
Most Common Industries - Utilities (%)
Most Common Industries - Information (%)
Most Common Industries - Finance and insurance, and real estate and rental and leasing (%)
Most Common Industries - Finance and insurance (%)
Most Common Industries - Real estate and rental and leasing (%)
Most Common Industries - Professional, scientific, and management, and administrative and waste management services (%)
Most Common Industries - Professional, scientific, and technical services (%)
Most Common Industries - Management of companies and enterprises (%)
Most Common Industries - Administrative and support and waste management services (%)
Most Common Industries - Educational services, and health care and social assistance (%)
Most Common Industries - Educational services (%)
Most Common Industries - Health care and social assistance (%)
Most Common Industries - Arts, entertainment, and recreation, and accommodation and food services (%)
Most Common Industries - Arts, entertainment, and recreation (%)
Most Common Industries - Accommodation and food services (%)
Most Common Industries - Other services, except public administration (%)
Most Common Industries - Public administration (%)
Occupation diversity
Most Common Occupations - Management, business, science, and arts occupations (%)
Most Common Occupations - Management, business, and financial occupations (%)
Most Common Occupations - Management occupations (%)
Most Common Occupations - Business and financial operations occupations (%)
Most Common Occupations - Computer, engineering, and science occupations (%)
Most Common Occupations - Computer and mathematical occupations (%)
Most Common Occupations - Architecture and engineering occupations (%)
Most Common Occupations - Life, physical, and social science occupations (%)
Most Common Occupations - Education, legal, community service, arts, and media occupations (%)
Most Common Occupations - Community and social service occupations (%)
Most Common Occupations - Legal occupations (%)
Most Common Occupations - Education, training, and library occupations (%)
Most Common Occupations - Arts, design, entertainment, sports, and media occupations (%)
Most Common Occupations - Healthcare practitioners and technical occupations (%)
Most Common Occupations - Health diagnosing and treating practitioners and other technical occupations (%)
Most Common Occupations - Health technologists and technicians (%)
Most Common Occupations - Service occupations (%)
Most Common Occupations - Healthcare support occupations (%)
Most Common Occupations - Protective service occupations (%)
Most Common Occupations - Fire fighting and prevention, and other protective service workers including supervisors (%)
Most Common Occupations - Law enforcement workers including supervisors (%)
Most Common Occupations - Food preparation and serving related occupations (%)
Most Common Occupations - Building and grounds cleaning and maintenance occupations (%)
Most Common Occupations - Personal care and service occupations (%)
Most Common Occupations - Sales and office occupations (%)
Most Common Occupations - Sales and related occupations (%)
Most Common Occupations - Office and administrative support occupations (%)
Most Common Occupations - Natural resources, construction, and maintenance occupations (%)
Most Common Occupations - Farming, fishing, and forestry occupations (%)
Most Common Occupations - Construction and extraction occupations (%)
Most Common Occupations - Installation, maintenance, and repair occupations (%)
Most Common Occupations - Production, transportation, and material moving occupations (%)
Most Common Occupations - Production occupations (%)
Most Common Occupations - Transportation occupations (%)
Most Common Occupations - Material moving occupations (%)
People in Group quarters - Institutionalized population (%)
People in Group quarters - Correctional institutions (%)
People in Group quarters - Federal prisons and detention centers (%)
People in Group quarters - Halfway houses (%)
People in Group quarters - Local jails and other confinement facilities (including police lockups) (%)
People in Group quarters - Military disciplinary barracks (%)
People in Group quarters - State prisons (%)
People in Group quarters - Other types of correctional institutions (%)
People in Group quarters - Nursing homes (%)
People in Group quarters - Hospitals/wards, hospices, and schools for the handicapped (%)
People in Group quarters - Hospitals/wards and hospices for chronically ill (%)
People in Group quarters - Hospices or homes for chronically ill (%)
People in Group quarters - Military hospitals or wards for chronically ill (%)
People in Group quarters - Other hospitals or wards for chronically ill (%)
People in Group quarters - Hospitals or wards for drug/alcohol abuse (%)
People in Group quarters - Mental (Psychiatric) hospitals or wards (%)
People in Group quarters - Schools, hospitals, or wards for the mentally retarded (%)
People in Group quarters - Schools, hospitals, or wards for the physically handicapped (%)
People in Group quarters - Institutions for the deaf (%)
People in Group quarters - Institutions for the blind (%)
People in Group quarters - Orthopedic wards and institutions for the physically handicapped (%)
People in Group quarters - Wards in general hospitals for patients who have no usual home elsewhere (%)
People in Group quarters - Wards in military hospitals for patients who have no usual home elsewhere (%)
People in Group quarters - Juvenile institutions (%)
People in Group quarters - Long-term care (%)
People in Group quarters - Homes for abused, dependent, and neglected children (%)
People in Group quarters - Residential treatment centers for emotionally disturbed children (%)
People in Group quarters - Training schools for juvenile delinquents (%)
People in Group quarters - Short-term care, detention or diagnostic centers for delinquent children (%)
People in Group quarters - Type of juvenile institution unknown (%)
People in Group quarters - Noninstitutionalized population (%)
People in Group quarters - College dormitories (includes college quarters off campus) (%)
People in Group quarters - Military quarters (%)
People in Group quarters - On base (%)
People in Group quarters - Barracks, unaccompanied personnel housing (UPH), (Enlisted/Officer), ;and similar group living quarters for military personnel (%)
People in Group quarters - Transient quarters for temporary residents (%)
People in Group quarters - Military ships (%)
People in Group quarters - Group homes (%)
People in Group quarters - Homes or halfway houses for drug/alcohol abuse (%)
People in Group quarters - Homes for the mentally ill (%)
People in Group quarters - Homes for the mentally retarded (%)
People in Group quarters - Homes for the physically handicapped (%)
People in Group quarters - Other group homes (%)
People in Group quarters - Religious group quarters (%)
People in Group quarters - Dormitories (%)
People in Group quarters - Agriculture workers' dormitories on farms (%)
People in Group quarters - Job Corps and vocational training facilities (%)
People in Group quarters - Other workers' dormitories (%)
People in Group quarters - Crews of maritime vessels (%)
People in Group quarters - Other nonhousehold living situations (%)
People in Group quarters - Other noninstitutional group quarters (%)
Residents speaking English at home (%)
Residents speaking English at home - Born in the United States (%)
Residents speaking English at home - Native, born elsewhere (%)
Residents speaking English at home - Foreign born (%)
Residents speaking Spanish at home (%)
Residents speaking Spanish at home - Born in the United States (%)
Residents speaking Spanish at home - Native, born elsewhere (%)
Residents speaking Spanish at home - Foreign born (%)
Residents speaking other language at home (%)
Residents speaking other language at home - Born in the United States (%)
Residents speaking other language at home - Native, born elsewhere (%)
Residents speaking other language at home - Foreign born (%)
Class of Workers - Employee of private company (%)
Class of Workers - Self-employed in own incorporated business (%)
Class of Workers - Private not-for-profit wage and salary workers (%)
Class of Workers - Local government workers (%)
Class of Workers - State government workers (%)
Class of Workers - Federal government workers (%)
Class of Workers - Self-employed workers in own not incorporated business and Unpaid family workers (%)
House heating fuel used in houses and condos - Utility gas (%)
House heating fuel used in houses and condos - Bottled, tank, or LP gas (%)
House heating fuel used in houses and condos - Electricity (%)
House heating fuel used in houses and condos - Fuel oil, kerosene, etc. (%)
House heating fuel used in houses and condos - Coal or coke (%)
House heating fuel used in houses and condos - Wood (%)
House heating fuel used in houses and condos - Solar energy (%)
House heating fuel used in houses and condos - Other fuel (%)
House heating fuel used in houses and condos - No fuel used (%)
House heating fuel used in apartments - Utility gas (%)
House heating fuel used in apartments - Bottled, tank, or LP gas (%)
House heating fuel used in apartments - Electricity (%)
House heating fuel used in apartments - Fuel oil, kerosene, etc. (%)
House heating fuel used in apartments - Coal or coke (%)
House heating fuel used in apartments - Wood (%)
House heating fuel used in apartments - Solar energy (%)
House heating fuel used in apartments - Other fuel (%)
House heating fuel used in apartments - No fuel used (%)
Armed forces status - In Armed Forces (%)
Armed forces status - Civilian (%)
Armed forces status - Civilian - Veteran (%)
Armed forces status - Civilian - Nonveteran (%)
Fatal accidents locations in years 2005-2021
Fatal accidents locations in 2005
Fatal accidents locations in 2006
Fatal accidents locations in 2007
Fatal accidents locations in 2008
Fatal accidents locations in 2009
Fatal accidents locations in 2010
Fatal accidents locations in 2011
Fatal accidents locations in 2012
Fatal accidents locations in 2013
Fatal accidents locations in 2014
Fatal accidents locations in 2015
Fatal accidents locations in 2016
Fatal accidents locations in 2017
Fatal accidents locations in 2018
Fatal accidents locations in 2019
Fatal accidents locations in 2020
Fatal accidents locations in 2021
Alcohol use - People drinking some alcohol every month (%)
Alcohol use - People not drinking at all (%)
Alcohol use - Average days/month drinking alcohol
Alcohol use - Average drinks/week
Alcohol use - Average days/year people drink much
Audiometry - Average condition of hearing (%)
Audiometry - People that can hear a whisper from across a quiet room (%)
Audiometry - People that can hear normal voice from across a quiet room (%)
Audiometry - Ears ringing, roaring, buzzing (%)
Audiometry - Had a job exposure to loud noise (%)
Audiometry - Had off-work exposure to loud noise (%)
Blood Pressure & Cholesterol - Has high blood pressure (%)
Blood Pressure & Cholesterol - Checking blood pressure at home (%)
Blood Pressure & Cholesterol - Frequently checking blood cholesterol (%)
Blood Pressure & Cholesterol - Has high cholesterol level (%)
Consumer Behavior - Money monthly spent on food at supermarket/grocery store
Consumer Behavior - Money monthly spent on food at other stores
Consumer Behavior - Money monthly spent on eating out
Consumer Behavior - Money monthly spent on carryout/delivered foods
Consumer Behavior - Income spent on food at supermarket/grocery store (%)
Consumer Behavior - Income spent on food at other stores (%)
Consumer Behavior - Income spent on eating out (%)
Consumer Behavior - Income spent on carryout/delivered foods (%)
Current Health Status - General health condition (%)
Current Health Status - Blood donors (%)
Current Health Status - Has blood ever tested for HIV virus (%)
Current Health Status - Left-handed people (%)
Dermatology - People using sunscreen (%)
Diabetes - Diabetics (%)
Diabetes - Had a blood test for high blood sugar (%)
Diabetes - People taking insulin (%)
Diet Behavior & Nutrition - Diet health (%)
Diet Behavior & Nutrition - Milk product consumption (# of products/month)
Diet Behavior & Nutrition - Meals not home prepared (#/week)
Diet Behavior & Nutrition - Meals from fast food or pizza place (#/week)
Diet Behavior & Nutrition - Ready-to-eat foods (#/month)
Diet Behavior & Nutrition - Frozen meals/pizza (#/month)
Drug Use - People that ever used marijuana or hashish (%)
Drug Use - Ever used hard drugs (%)
Drug Use - Ever used any form of cocaine (%)
Drug Use - Ever used heroin (%)
Drug Use - Ever used methamphetamine (%)
Health Insurance - People covered by health insurance (%)
Kidney Conditions-Urology - Avg. # of times urinating at night
Medical Conditions - People with asthma (%)
Medical Conditions - People with anemia (%)
Medical Conditions - People with psoriasis (%)
Medical Conditions - People with overweight (%)
Medical Conditions - Elderly people having difficulties in thinking or remembering (%)
Medical Conditions - People who ever received blood transfusion (%)
Medical Conditions - People having trouble seeing even with glass/contacts (%)
Medical Conditions - People with arthritis (%)
Medical Conditions - People with gout (%)
Medical Conditions - People with congestive heart failure (%)
Medical Conditions - People with coronary heart disease (%)
Medical Conditions - People with angina pectoris (%)
Medical Conditions - People who ever had heart attack (%)
Medical Conditions - People who ever had stroke (%)
Medical Conditions - People with emphysema (%)
Medical Conditions - People with thyroid problem (%)
Medical Conditions - People with chronic bronchitis (%)
Medical Conditions - People with any liver condition (%)
Medical Conditions - People who ever had cancer or malignancy (%)
Mental Health - People who have little interest in doing things (%)
Mental Health - People feeling down, depressed, or hopeless (%)
Mental Health - People who have trouble sleeping or sleeping too much (%)
Mental Health - People feeling tired or having little energy (%)
Mental Health - People with poor appetite or overeating (%)
Mental Health - People feeling bad about themself (%)
Mental Health - People who have trouble concentrating on things (%)
Mental Health - People moving or speaking slowly or too fast (%)
Mental Health - People having thoughts they would be better off dead (%)
Oral Health - Average years since last visit a dentist
Oral Health - People embarrassed because of mouth (%)
Oral Health - People with gum disease (%)
Oral Health - General health of teeth and gums (%)
Oral Health - Average days a week using dental floss/device
Oral Health - Average days a week using mouthwash for dental problem
Oral Health - Average number of teeth
Pesticide Use - Households using pesticides to control insects (%)
Pesticide Use - Households using pesticides to kill weeds (%)
Physical Activity - People doing vigorous-intensity work activities (%)
Physical Activity - People doing moderate-intensity work activities (%)
Physical Activity - People walking or bicycling (%)
Physical Activity - People doing vigorous-intensity recreational activities (%)
Physical Activity - People doing moderate-intensity recreational activities (%)
Physical Activity - Average hours a day doing sedentary activities
Physical Activity - Average hours a day watching TV or videos
Physical Activity - Average hours a day using computer
Physical Functioning - People having limitations keeping them from working (%)
Physical Functioning - People limited in amount of work they can do (%)
Physical Functioning - People that need special equipment to walk (%)
Physical Functioning - People experiencing confusion/memory problems (%)
Physical Functioning - People requiring special healthcare equipment (%)
Prescription Medications - Average number of prescription medicines taking
Preventive Aspirin Use - Adults 40+ taking low-dose aspirin (%)
Reproductive Health - Vaginal deliveries (%)
Reproductive Health - Cesarean deliveries (%)
Reproductive Health - Deliveries resulted in a live birth (%)
Reproductive Health - Pregnancies resulted in a delivery (%)
Reproductive Health - Women breastfeeding newborns (%)
Reproductive Health - Women that had a hysterectomy (%)
Reproductive Health - Women that had both ovaries removed (%)
Reproductive Health - Women that have ever taken birth control pills (%)
Reproductive Health - Women taking birth control pills (%)
Reproductive Health - Women that have ever used Depo-Provera or injectables (%)
Reproductive Health - Women that have ever used female hormones (%)
Sexual Behavior - People 18+ that ever had sex (vaginal, anal, or oral) (%)
Sexual Behavior - Males 18+ that ever had vaginal sex with a woman (%)
Sexual Behavior - Males 18+ that ever performed oral sex on a woman (%)
Sexual Behavior - Males 18+ that ever had anal sex with a woman (%)
Sexual Behavior - Males 18+ that ever had any sex with a man (%)
Sexual Behavior - Females 18+ that ever had vaginal sex with a man (%)
Sexual Behavior - Females 18+ that ever performed oral sex on a man (%)
Sexual Behavior - Females 18+ that ever had anal sex with a man (%)
Sexual Behavior - Females 18+ that ever had any kind of sex with a woman (%)
Sexual Behavior - Average age people first had sex
Sexual Behavior - Average number of female sex partners in lifetime (males 18+)
Sexual Behavior - Average number of female vaginal sex partners in lifetime (males 18+)
Sexual Behavior - Average age people first performed oral sex on a woman (18+)
Sexual Behavior - Average number of woman performed oral sex on in lifetime (18+)
Sexual Behavior - Average number of male sex partners in lifetime (males 18+)
Sexual Behavior - Average number of male anal sex partners in lifetime (males 18+)
Sexual Behavior - Average age people first performed oral sex on a man (18+)
Sexual Behavior - Average number of male oral sex partners in lifetime (18+)
Sexual Behavior - People using protection when performing oral sex (%)
Sexual Behavior - Average number of times people have vaginal or anal sex a year
Sexual Behavior - People having sex without condom (%)
Sexual Behavior - Average number of male sex partners in lifetime (females 18+)
Sexual Behavior - Average number of male vaginal sex partners in lifetime (females 18+)
Sexual Behavior - Average number of female sex partners in lifetime (females 18+)
Sexual Behavior - Circumcised males 18+ (%)
Sleep Disorders - Average hours sleeping at night
Sleep Disorders - People that has trouble sleeping (%)
Smoking-Cigarette Use - People smoking cigarettes (%)
Taste & Smell - People 40+ having problems with smell (%)
Taste & Smell - People 40+ having problems with taste (%)
Taste & Smell - People 40+ that ever had wisdom teeth removed (%)
Taste & Smell - People 40+ that ever had tonsils teeth removed (%)
Taste & Smell - People 40+ that ever had a loss of consciousness because of a head injury (%)
Taste & Smell - People 40+ that ever had a broken nose or other serious injury to face or skull (%)
Taste & Smell - People 40+ that ever had two or more sinus infections (%)
Weight - Average height (inches)
Weight - Average weight (pounds)
Weight - Average BMI
Weight - People that are obese (%)
Weight - People that ever were obese (%)
Weight - People trying to lose weight (%)
Urban population: 9,060
Rural population: 23,446
Estimated median house/condo value in 2022: $275,751
30248:
$275,751Georgia:
$297,400
According to our research of Georgia and other state lists, there were 49 registered sex offenders living in 30248 zip code as of April 27, 2024 . The ratio of all residents to sex offenders in zip code 30248 is 503 to 1.The ratio of registered sex offenders to all residents in this zip code is lower than the state average.
Median resident age: This zip code:
36.5 yearsGeorgia median age:
37.6 years
Average household size: This zip code:
3.1 peopleGeorgia:
2.6 people
Averages for the 2020 tax year for zip code 30248, filed in 2021:
Average Adjusted Gross Income (AGI) in 2020: $60,475 (Individual Income Tax Returns) Here:
$60,475State:
$70,847
Salary/wage: $53,163 (reported on 85.9% of returns )Here:
$53,163State:
$59,126
(% of AGI for various income ranges: 1237.2% for AGIs below $25k , 3924.0% for AGIs $25k-50k , 7098.3% for AGIs $50k-75k , 10383.8% for AGIs $75k-100k , 19398.0% for AGIs $100k-200k , 63079.2% for AGIs over 200k ) Taxable interest for individuals: $1,023 (reported on 16.5% of returns )This zip code:
$1,023Georgia:
$2,011
(% of AGI for various income ranges: 6.4% for AGIs below $25k , 8.4% for AGIs $25k-50k , 11.3% for AGIs $50k-75k , 18.3% for AGIs $75k-100k , 45.0% for AGIs $100k-200k , 927.5% for AGIs over 200k ) Ordinary dividends: $3,156 (reported on 8.1% of returns )(% of AGI for various income ranges: 4.6% for AGIs below $25k , 5.8% for AGIs $25k-50k , 20.9% for AGIs $50k-75k , 63.1% for AGIs $75k-100k , 96.9% for AGIs $100k-200k , 1182.5% for AGIs over 200k ) Net capital gain/loss in AGI: +$21,072 (reported on 8.1% of returns )Here:
+$21,072State:
+$28,402
(% of AGI for various income ranges: 4.9% for AGIs below $25k , 9.0% for AGIs $25k-50k , 27.2% for AGIs $50k-75k , 57.1% for AGIs $75k-100k , 283.7% for AGIs $100k-200k , 16781.7% for AGIs over 200k ) Profit/loss from business: +$112 (reported on 24.4% of returns )(% of AGI for various income ranges: 153.7% for AGIs $75k-100k , 135.7% for AGIs $100k-200k , 2861.7% for AGIs over 200k ) Taxable individual retirement arrangement distribution: $16,894 (reported on 4.7% of returns )30248:
$16,894Georgia:
$20,525
(% of AGI for various income ranges: 17.4% for AGIs below $25k , 46.7% for AGIs $25k-50k , 94.5% for AGIs $50k-75k , 225.6% for AGIs $75k-100k , 412.5% for AGIs $100k-200k , 1275.0% for AGIs over 200k ) Total itemized deductions: $29,038 (reported on 12.9% of returns )Here:
$29,038State:
$34,001
(% of AGI for various income ranges: 56.1% for AGIs below $25k , 255.3% for AGIs $25k-50k , 546.2% for AGIs $50k-75k , 817.7% for AGIs $75k-100k , 1624.0% for AGIs $100k-200k , 8698.3% for AGIs over 200k ) Charity contributions: $10,718 (reported on 10.9% of returns )Here:
$10,718State:
$14,164
(% of AGI for various income ranges: 9.1% for AGIs below $25k , 59.8% for AGIs $25k-50k , 127.8% for AGIs $50k-75k , 223.0% for AGIs $75k-100k , 519.5% for AGIs $100k-200k , 4296.7% for AGIs over 200k ) Taxes paid: $6,981 (reported on 12.7% of returns )(% of AGI for various income ranges: 9.9% for AGIs below $25k , 50.4% for AGIs $25k-50k , 129.1% for AGIs $50k-75k , 213.6% for AGIs $75k-100k , 473.4% for AGIs $100k-200k , 1570.8% for AGIs over 200k ) Earned income credit: $2,607 (reported on 20.8% of returns )(% of AGI for various income ranges: 131.9% for AGIs below $25k , 94.7% for AGIs $25k-50k , 1.8% for AGIs $50k-75k ) Percentage of individuals using paid preparers for their 2020 taxes: 93.3%(% for various income ranges: 93.1% for AGIs below $25k , 92.5% for AGIs $25k-50k , 93.7% for AGIs $50k-75k , 93.7% for AGIs $75k-100k , 94.0% for AGIs $100k-200k , 97.3% for AGIs over 200k )
Averages for the 2012 tax year for zip code 30248, filed in 2013:
Average Adjusted Gross Income (AGI) in 2012: $51,697 (Individual Income Tax Returns) Here:
$51,697State:
$56,131
Salary/wage: $48,338 (reported on 87.8% of returns )Here:
$48,338State:
$47,942
(% of AGI for various income ranges: 78.8% for AGIs below $25k , 85.9% for AGIs $25k-50k , 84.6% for AGIs $50k-75k , 83.5% for AGIs $75k-100k , 83.6% for AGIs $100k-200k , 66.4% for AGIs over 200k ) Taxable interest for individuals: $715 (reported on 22.4% of returns )This zip code:
$715Georgia:
$1,706
(% of AGI for various income ranges: 0.6% for AGIs below $25k , 0.3% for AGIs $25k-50k , 0.2% for AGIs $50k-75k , 0.3% for AGIs $75k-100k , 0.2% for AGIs $100k-200k , 0.6% for AGIs over 200k ) Ordinary dividends: $2,270 (reported on 9.9% of returns )(% of AGI for various income ranges: 0.4% for AGIs below $25k , 0.4% for AGIs $25k-50k , 0.4% for AGIs $50k-75k , 0.3% for AGIs $75k-100k , 0.5% for AGIs $100k-200k , 0.7% for AGIs over 200k ) Net capital gain/loss in AGI: +$1,853 (reported on 7.7% of returns )Here:
+$1,853State:
+$16,323
(% of AGI for various income ranges: 0.7% for AGIs $100k-200k , 0.8% for AGIs over 200k ) Profit/loss from business: +$4,057 (reported on 19.0% of returns )Here:
+$4,057State:
+$7,583
(% of AGI for various income ranges: 7.0% for AGIs below $25k , 0.7% for AGIs $25k-50k , 0.8% for AGIs $50k-75k , 1.3% for AGIs $75k-100k , 0.9% for AGIs $100k-200k , 1.0% for AGIs over 200k ) Taxable individual retirement arrangement distribution: $14,516 (reported on 6.2% of returns )30248:
$14,516Georgia:
$17,199
(% of AGI for various income ranges: 2.0% for AGIs below $25k , 1.3% for AGIs $25k-50k , 1.2% for AGIs $50k-75k , 1.6% for AGIs $75k-100k , 2.4% for AGIs $100k-200k , 1.9% for AGIs over 200k ) Total itemized deductions: $20,529 (26% of AGI, reported on 44.9% of returns )Here:
$20,529State:
$23,886
Here:
25.5% of AGIState:
21.5% of AGI
(% of AGI for various income ranges: 13.4% for AGIs below $25k , 17.6% for AGIs $25k-50k , 18.9% for AGIs $50k-75k , 18.9% for AGIs $75k-100k , 18.9% for AGIs $100k-200k , 15.2% for AGIs over 200k ) Charity contributions: $4,061 (reported on 38.2% of returns )(% of AGI for various income ranges: 1.7% for AGIs below $25k , 2.5% for AGIs $25k-50k , 3.0% for AGIs $50k-75k , 3.3% for AGIs $75k-100k , 3.4% for AGIs $100k-200k , 3.6% for AGIs over 200k ) Taxes paid: $5,853 (reported on 44.7% of returns )(% of AGI for various income ranges: 1.9% for AGIs below $25k , 3.6% for AGIs $25k-50k , 4.6% for AGIs $50k-75k , 5.6% for AGIs $75k-100k , 6.5% for AGIs $100k-200k , 6.7% for AGIs over 200k ) Earned income credit: $2,457 (reported on 22.9% of returns )(% of AGI for various income ranges: 9.4% for AGIs below $25k , 1.5% for AGIs $25k-50k ) Percentage of individuals using paid preparers for their 2012 taxes: 51.9%(% for various income ranges: 48.8% for AGIs below $25k , 52.5% for AGIs $25k-50k , 54.4% for AGIs $50k-75k , 50.5% for AGIs $75k-100k , 55.8% for AGIs $100k-200k , 76.9% for AGIs over 200k )
Averages for the 2004 tax year for zip code 30248, filed in 2005:
Average Adjusted Gross Income (AGI) in 2004: $47,685 (Individual Income Tax Returns) Here:
$47,685State:
$47,553
Salary/wage: $44,353 (reported on 90.8% of returns )Here:
$44,353State:
$42,178
(% of AGI for various income ranges: 197.1% for AGIs below $10k , 81.6% for AGIs $10k-25k , 87.6% for AGIs $25k-50k , 89.8% for AGIs $50k-75k , 90.1% for AGIs $75k-100k , 69.1% for AGIs over 100k ) Taxable interest for individuals: $912 (reported on 36.6% of returns )This zip code:
$912Georgia:
$1,772
(% of AGI for various income ranges: 5.0% for AGIs below $10k , 1.0% for AGIs $10k-25k , 0.6% for AGIs $25k-50k , 0.5% for AGIs $50k-75k , 0.4% for AGIs $75k-100k , 1.0% for AGIs over 100k ) Taxable dividends: $1,149 (reported on 12.6% of returns )(% of AGI for various income ranges: 2.8% for AGIs below $10k , 0.5% for AGIs $10k-25k , 0.2% for AGIs $25k-50k , 0.3% for AGIs $50k-75k , 0.2% for AGIs $75k-100k , 0.4% for AGIs over 100k ) Net capital gain/loss: +$19,063 (reported on 10.1% of returns )Here:
+$19,063State:
+$16,461
(% of AGI for various income ranges: -3.1% for AGIs below $10k , 0.4% for AGIs $10k-25k , 0.4% for AGIs $25k-50k , 0.4% for AGIs $50k-75k , 0.8% for AGIs $75k-100k , 14.6% for AGIs over 100k ) Profit/loss from business: +$7,136 (reported on 16.5% of returns )Here:
+$7,136State:
+$8,201
(% of AGI for various income ranges: 2.0% for AGIs below $10k , 6.3% for AGIs $10k-25k , 2.3% for AGIs $25k-50k , 1.9% for AGIs $50k-75k , 1.1% for AGIs $75k-100k , 3.3% for AGIs over 100k ) IRA payment deduction: $2,768 (reported on 1.6% of returns )30248:
$2,768Georgia:
$2,969
(% of AGI for various income ranges: 0.8% for AGIs below $10k , 0.1% for AGIs $25k-50k , 0.1% for AGIs $50k-75k , 0.1% for AGIs $75k-100k , 0.1% for AGIs over 100k ) Self-employed pension: $7,864 (reported on 0.3% of returns )Here:
$7,864Georgia:
$16,203
Total itemized deductions: $17,795 (26% of AGI, reported on 54.0% of returns )Here:
$17,795State:
$19,944
Here:
25.8% of AGIState:
22.6% of AGI
(% of AGI for various income ranges: 22.2% for AGIs below $10k , 14.3% for AGIs $10k-25k , 20.9% for AGIs $25k-50k , 21.7% for AGIs $50k-75k , 20.9% for AGIs $75k-100k , 18.7% for AGIs over 100k ) Charity contributions deductions: $3,393 (5% of AGI, reported on 48.2% of returns )Here:
4.8% of AGIState:
4.7% of AGI
(% of AGI for various income ranges: 1.7% for AGIs below $10k , 2.1% for AGIs $10k-25k , 2.9% for AGIs $25k-50k , 3.1% for AGIs $50k-75k , 2.9% for AGIs $75k-100k , 4.9% for AGIs over 100k ) Total tax: $5,474 (reported on 76.8% of returns )(% of AGI for various income ranges: 5.0% for AGIs below $10k , 3.9% for AGIs $10k-25k , 5.7% for AGIs $25k-50k , 7.2% for AGIs $50k-75k , 8.8% for AGIs $75k-100k , 14.6% for AGIs over 100k ) Earned income credit: $1,847 (reported on 15.7% of returns )Percentage of individuals using paid preparers for their 2004 taxes: 57.4%(% for various income ranges: 48.8% for AGIs below $10k , 62.1% for AGIs $10k-25k , 57.6% for AGIs $25k-50k , 57.2% for AGIs $50k-75k , 55.9% for AGIs $75k-100k , 64.5% for AGIs over 100k )
Estimated median household income in 2022: This zip code:
$81,816Georgia:
$72,837
Nearest zip codes: 30234 ,
30253 ,
30252 ,
30233 ,
30284 ,
30223 .
Locust Grove Zip Code Map
Percentage of family households: This zip code:
61.9%Georgia:
48.5%
Percentage of households with unmarried partners: This zip code:
2.8%Georgia:
46.9%
No gay or lesbian households reported
Household received Food Stamps/SNAP in the past 12 months: 905Household did not receive Food Stamps/SNAP in the past 12 months: 9,487
Women who had a birth in the past 12 months: 669 (475 now married , 194 unmarried) Women who did not have a birth in the past 12 months: 8,308 (3,707 now married , 4,597 unmarried)
Housing units in zip code 30248 with a mortgage: 7,041 (304
second mortgage , 221
both second mortgage and home equity loan )
Houses without a mortgage: 66
Median monthly owner costs for units with a mortgage: $1,550
Median monthly owner costs for units without a mortgage: $513
Residents with income below the poverty level in 2022:
This zip code:
7.7%Whole state:
12.7%
Residents with income below 50% of the poverty level in 2022:
This zip code:
4.5%Whole state:
6.3%
Median number of rooms in houses and condos: Median number of rooms in apartments: Notable locations in this zip code not listed on our city pages
Click to draw/clear zip code borders Notable locations in zip code 30248: (A) , Locust Grove City Hall (B) , Henry County Fire Department Station 12 (C) , Henry County Fire Department Station 2 (D) . Display/hide their locations on the map
Churches in zip code 30248 include: (A) , Bold Spring Church (B) , Luella Baptist Church (C) , New Hope Church (D) , Philadelphia Baptist Church (E) , Phillipi Baptist Church (F) , Unity Grove Baptist Church (G) . Display/hide their locations on the map
Cemeteries: (1) , Old Mount Bethel Cemetery (2) , Weems Cemetery (3) , Henley-Heflin Cemetery (4) , Pullin Cemetery (5) . Display/hide their locations on the map
Lakes and reservoirs: (A) , Skyland Lake (B) , Southern States Lake (C) , Hetrick Lake (D) , Collins Lake (E) . Display/hide their locations on the map
Streams, rivers, and creeks: (A) , Thompson Creek (B) , Indian Creek (C) , Greer Branch (D) , Tussahaw Branch (E) , Brown Branch (F) , Mill Creek (G) , Long Branch (H) , Lee Creek (I) . Display/hide their locations on the map
Year house built (houses)
160 2020 or later2,438 2010 to 20194,780 2000 to 20092,349 1990 to 1999913 1980 to 1989164 1970 to 1979289 1960 to 196933 1950 to 195964 1940 to 1949106 1939 or earlier
Zip code 30248 household income distribution in 2022 260 Less than $10,000101 $10,000 to $14,999186 $15,000 to $19,999119 $20,000 to $24,99984 $25,000 to $29,999225 $30,000 to $34,999412 $35,000 to $39,999345 $40,000 to $44,999596 $45,000 to $49,9991,190 $50,000 to $59,9991,294 $60,000 to $74,9991,632 $75,000 to $99,9991,161 $100,000 to $124,999825 $125,000 to $149,9991,173 $150,000 to $199,999899 $200,000 or moreEstimate of home value of owner-occupied houses/condos in 2022 in zip code 30248 69 Less than $10,00031 $10,000 to $14,99932 $15,000 to $19,99978 $20,000 to $24,99937 $30,000 to $34,9996 $40,000 to $49,99924 $60,000 to $69,99933 $70,000 to $79,9997 $90,000 to $99,999170 $100,000 to $124,999285 $125,000 to $149,9991,024 $150,000 to $174,999786 $175,000 to $199,9991,119 $200,000 to $249,9991,066 $250,000 to $299,9991,441 $300,000 to $399,999946 $400,000 to $499,999887 $500,000 to $749,999142 $750,000 to $999,99910 $2,000,000 or moreRent paid by renters in 2022 in zip code 30248 5 Less than $10015 $150 to $19920 $400 to $44929 $450 to $49958 $500 to $54923 $600 to $6496 $700 to $749126 $750 to $799102 $800 to $899272 $900 to $999322 $1,000 to $1,249479 $1,250 to $1,499266 $1,500 to $1,99948 $2,000 to $2,49924 $2,500 to $2,9996 $3,000 to $3,49932 No cash rent
Median gross rent in 2022: $1,412.
Median price asked for vacant for-sale houses and condos in 2022: $212,143.
Estimated median house (or condo) value in 2022 for: White Non-Hispanic householders: $293,854Black or African American householders: $242,692Two or more races householders: $290,706Hispanic or Latino householders: $255,286Estimated median house or condo value in 2022: $275,751
30248:
$275,751Georgia:
$297,400
Lower value quartile - upper value quartile: $198,960 - $397,024
Mean price in 2022: Detached houses: $307,902Here:
$307,902State:
$376,364
Mobile homes: $48,112Here:
$48,112State:
$102,413
Housing units in structures:
One, detached: 9,723One, attached: 78Two: 1933 or 4: 265 to 9: 2810 to 19: 5720 to 49: 23350 or more: 271Mobile homes: 493Unemployment : 3.3%
Means of transportation to work in zip code 30248 75.4% 11,759 Drove a car alone5.9% 926 Carpooled1.5% 232 Bus or trolley bus0.4% 55 Motorcycle0.0% 7 Walked1.1% 165 Other means15.0% 2,343 Worked at homeTravel time to work (commute) in zip code 30248 65 Less than 5 minutes492 5 to 9 minutes1,462 10 to 14 minutes2,138 15 to 19 minutes1,291 20 to 24 minutes590 25 to 29 minutes1,701 30 to 34 minutes519 35 to 39 minutes715 40 to 44 minutes1,960 45 to 59 minutes1,632 60 to 89 minutes627 90 or more minutes
Percentage of zip code residents living and working in this county: 58.1%
Household type by relationship:
Households: 32,507
Male householders: 5,289 (790 living alone ), Female householders: 5,138 (1,046 living alone )5,708 spouses (5,635 opposite-sex spouses ), 691 unmarried partners , (663 opposite-sex unmarried partners ), 11,956 children (11,336 natural , 22 adopted , 588 stepchildren ), 735 grandchildren , 367 brothers or sisters , 759 parents , 0 foster children , 730 other relatives , 1,011 non-relatives In group quarters: 6 (-1 institutionalized population )
Size of family households: 2,570 2-persons , 2,385 3-persons , 1,560 4-persons , 1,309 5-persons , 453 6-persons , 165 7-or-more-persons
Size of nonfamily households: 1,835 1-person , 139 2-persons , 34 3-persons
5,288 married couples with children. single-parent households (607 men , 1,649 women ).
91.0% of residents of 30248 zip code speak English at home. of residents speak Spanish at home (62% very well, 18% well, 15% not well, 4% not at all ).of residents speak other Indo-European language at home (75% very well, 25% well ).of residents speak Asian or Pacific Island language at home (42% very well, 58% not well ).of residents speak other language at home (100% very well ).
Foreign born population: 1,731 (5.3%)
(63.6%
of them are naturalized citizens )
This zip code:
5.3%Whole state:
10.7%
13% Dominica 13% Honduras 12% Haiti 12% Guatemala 4% Thailand 4% Guyana 3% Peru 39% American 9% English 4% Irish 3% German 3% African 1% Scottish 1% Jamaican
Year of entry for the foreign-born population
690 2010 or later 544 2000 to 2009 482 1990 to 1999 593 Before 1990
Facilities with environmental interests located in this zip code:
LOCUST GROVE ELEMENTARY SCHOOL (95 GRIFFIN ROAD in LOCUST GROVE, GA)
(Geographic Names Information System) (National Center for Education Statistics) - STATE ID-5050 Organizations: HENRY COUNTY (SCHOOL DISTRICT)
LUELLA MIDDLE SCHOOL (2075 HAMPTON-LOCUST GROVE ROAD in LOCUST GROVE, GA)
(National Center for Education Statistics) - STATE ID-0603 Organizations: HENRY COUNTY (SCHOOL DISTRICT)
CAMP CREEK WPCP (1601 LESTER MILL ROAD in LOCUST GROVE, GA)
(Integrated Compliance Information System) - ICIS-04-2002-4530, FORMAL ENFORCEMENT ACTION Business SIC classification: SEWERAGE SYSTEMS
MANN PAUL (23 SKYLAND DR in LOCUST GROVE, GA)
(Resource Conservation and Recovery Act (tracking hazardous waste))
MANN'S USED OIL SERVICE (1348 PEEKSVILLE RD in LOCUST GROVE, GA)
USED OIL PROGRAM (Resource Conservation and Recovery Act (tracking hazardous waste)) Organizations: HENRY LEE (CONTACT/OPERATOR)
METROPOLITAN PALLET (CLEVELAND AVENUE in LOCUST GROVE, GA)
AIR MINOR (AIRS/AFS) Business SIC classification: WOOD PALLETS AND SKIDS
LOCUST GROVE AMOCO (I-75 & LOCUST GROVE RD. in LOCUST GROVE, GA)
Conditionally Exempt Small Quantity Generators, less than 100 kg/month of hazardous waste (Resource Conservation and Recovery Act (tracking hazardous waste)) - notification Organizations: WILLIS OIL CO (CONTACT/OWNER)
LG MERCURY (20 MOHICAN MAZE in LOCUST GROVE, GA)
SUPERFUND (Superfund database)
Housing units lacking complete plumbing facilities: 2.4%
Housing units lacking complete kitchen facilities: 0.3%
61.8% Electricity 33.4% Utility gas 4.0% Bottled, tank, or LP gas
Population in 1990: 5,812. Population change in the 1990s: +5,339 (+91.9%).
Place of birth for U.S.-born residents:
This state: 20,484Northeast: 1,910Midwest: 1,617South: 4,908West: 1,132
47% of the 30248 zip code residents lived in the same house 5 years ago.
Out of people who lived in different houses, 31% lived in this county.
Out of people who lived in different counties, 50% lived in Georgia.
85% of the 30248 zip code residents lived in the same house 1 year ago.
Out of people who lived in different houses, 51% moved from this county.
Out of people who lived in different houses, 25% moved from different county within same state.
Out of people who lived in different houses, 20% moved from different state.
Out of people who lived in different houses, 1% moved from abroad.
Private vs. public school enrollment:
Students in private schools in grades 1 to 8 (elementary and middle school): 571
Students in private schools in grades 9 to 12 (high school): 220
Students in private undergraduate colleges: 115
Occupation by median earnings in the past 12 months ($)
108,444 Computer and mathematical occupations 94,501 Law enforcement workers including supervisors 81,461 Management occupations 62,918 Business and financial operations occupations 59,123 Arts, design, entertainment, sports, and media occupations 57,808 Installation, maintenance, and repair occupations
Companies with federal contracts located in this zip code:
DELTA INDUSTRIAL CONTRACTORS I (142 PARK 42 DR in LOCUST GROVE, GA; small business) in 2 contracts in 2000
$47,500 with U.S. Army Corps of Engineers - civil program financing only for Misc Fiber Optic Components. Taking place in NC. Signed on 2000-04-05. Completion date: 1999-12-28.
, same as above. Signed on 2000-04-05. Completion date: 1999-12-28.
GSM TRAINING ASSOCIATES, LLC (2110 OLD JACKSON RD in LOCUST GROVE, GA; small business)
$15,000 with Army for Construction of Structures and Facilities -- Schools. Taking place in TN. Signed on 2004-07-07. Completion date: 2004-08-06.
Top industries in this zip code by the number of employees in 2005:
Wholesale Trade: Lumber, Plywood, Millwork, and Wood Panel Merchant Wholesalers (100-249 employees: 1 establishment)Accommodation and Food Services: Limited-Service Restaurants (20-49: 3, 10-19: 1, 5-9: 3, 1-4: 4)Accommodation and Food Services: Full-Service Restaurants (20-49: 1, 10-19: 3, 1-4: 4)Administrative and Support and Waste Management and Remediation Services: Landscaping Services (20-49: 1, 10-19: 1, 5-9: 2, 1-4: 6)
Fatal accident statistics in 2014:
Fatal accident count: 3Vehicles involved in fatal accidents: 4Fatal accidents caused by drunken drivers: 0Fatalities: 3Persons involved in fatal accidents: 8Pedestrians involved in fatal accidents: 0
Fatal accident statistics in 2013:
Fatal accident count: 5Vehicles involved in fatal accidents: 6Fatal accidents caused by drunken drivers: 0Fatalities: 5Persons involved in fatal accidents: 8Pedestrians involved in fatal accidents: 1
Home Mortgage Disclosure Act Aggregated Statistics For Year 2009(Based on 8 partial tracts) A) FHA, FSA/RHS & VA B) Conventional C) Refinancings D) Home Improvement Loans F) Non-occupant Loans on G) Loans On Manufactured Number Average Value Number Average Value Number Average Value Number Average Value Number Average Value Number Average Value
LOANS ORIGINATED 499 $121,920 152 $137,621 785 $158,921 36 $55,924 109 $126,274 21 $46,278 APPLICATIONS APPROVED, NOT ACCEPTED 26 $130,742 11 $98,782 76 $155,282 3 $67,763 5 $73,336 6 $54,693 APPLICATIONS DENIED 106 $134,085 36 $124,308 472 $169,557 49 $39,156 37 $100,226 9 $47,711 APPLICATIONS WITHDRAWN 78 $135,749 26 $128,495 309 $162,682 13 $56,068 10 $84,201 5 $63,940 FILES CLOSED FOR INCOMPLETENESS 21 $154,658 4 $191,630 68 $189,061 0 $0 1 $134,640 0 $0
Aggregated Statistics For Year 2008(Based on 8 partial tracts) A) FHA, FSA/RHS & VA B) Conventional C) Refinancings D) Home Improvement Loans F) Non-occupant Loans on G) Loans On Manufactured Number Average Value Number Average Value Number Average Value Number Average Value Number Average Value Number Average Value
LOANS ORIGINATED 455 $141,664 330 $164,253 741 $163,772 51 $48,333 204 $157,816 26 $39,712 APPLICATIONS APPROVED, NOT ACCEPTED 15 $171,925 44 $149,256 108 $179,271 8 $40,089 12 $146,183 6 $57,878 APPLICATIONS DENIED 77 $155,688 70 $146,780 615 $165,868 115 $54,955 51 $134,166 24 $52,450 APPLICATIONS WITHDRAWN 71 $137,418 49 $196,264 231 $173,957 26 $120,759 28 $162,256 1 $65,690 FILES CLOSED FOR INCOMPLETENESS 15 $145,266 21 $149,017 76 $173,942 5 $51,904 9 $133,674 2 $64,660
Aggregated Statistics For Year 2007(Based on 8 partial tracts) A) FHA, FSA/RHS & VA B) Conventional C) Refinancings D) Home Improvement Loans F) Non-occupant Loans on G) Loans On Manufactured Number Average Value Number Average Value Number Average Value Number Average Value Number Average Value Number Average Value
LOANS ORIGINATED 228 $166,251 1,060 $152,179 880 $148,362 143 $45,960 330 $135,509 40 $49,455 APPLICATIONS APPROVED, NOT ACCEPTED 8 $171,082 137 $159,254 230 $141,066 19 $33,394 54 $136,310 6 $93,943 APPLICATIONS DENIED 58 $163,827 350 $170,041 1,044 $153,823 222 $54,388 99 $133,107 48 $59,281 APPLICATIONS WITHDRAWN 19 $166,456 179 $169,885 412 $158,807 22 $83,361 45 $139,005 4 $28,752 FILES CLOSED FOR INCOMPLETENESS 4 $204,892 44 $184,625 98 $176,752 2 $44,980 12 $163,072 0 $0
Aggregated Statistics For Year 2006(Based on 8 partial tracts) A) FHA, FSA/RHS & VA B) Conventional C) Refinancings D) Home Improvement Loans F) Non-occupant Loans on G) Loans On Manufactured Number Average Value Number Average Value Number Average Value Number Average Value Number Average Value Number Average Value
LOANS ORIGINATED 255 $158,666 2,237 $126,028 1,054 $131,795 174 $41,099 661 $110,233 44 $44,855 APPLICATIONS APPROVED, NOT ACCEPTED 12 $126,127 266 $121,912 241 $128,777 30 $28,323 83 $98,607 19 $47,772 APPLICATIONS DENIED 26 $122,092 466 $139,087 985 $144,693 219 $44,738 151 $128,428 45 $53,992 APPLICATIONS WITHDRAWN 33 $137,283 344 $131,028 510 $145,123 41 $82,074 86 $116,415 7 $64,314 FILES CLOSED FOR INCOMPLETENESS 2 $131,170 83 $125,463 145 $154,683 4 $25,682 38 $157,712 0 $0
Aggregated Statistics For Year 2005(Based on 8 partial tracts) A) FHA, FSA/RHS & VA B) Conventional C) Refinancings D) Home Improvement Loans E) Loans on Dwellings For 5+ Families F) Non-occupant Loans on G) Loans On Manufactured Number Average Value Number Average Value Number Average Value Number Average Value Number Average Value Number Average Value Number Average Value
LOANS ORIGINATED 320 $155,145 2,186 $112,724 1,165 $128,239 86 $54,517 0 $0 473 $104,025 44 $56,893 APPLICATIONS APPROVED, NOT ACCEPTED 7 $151,003 210 $104,265 180 $113,626 18 $45,641 0 $0 31 $95,044 20 $44,745 APPLICATIONS DENIED 37 $145,138 353 $104,409 906 $128,575 183 $43,737 0 $0 68 $101,772 64 $62,690 APPLICATIONS WITHDRAWN 29 $150,806 289 $119,206 573 $142,767 72 $107,930 2 $17,312,170 66 $102,056 12 $71,493 FILES CLOSED FOR INCOMPLETENESS 2 $122,355 81 $109,843 126 $137,890 10 $60,737 0 $0 13 $73,892 2 $107,820
Aggregated Statistics For Year 2004(Based on 8 partial tracts) A) FHA, FSA/RHS & VA B) Conventional C) Refinancings D) Home Improvement Loans F) Non-occupant Loans on G) Loans On Manufactured Number Average Value Number Average Value Number Average Value Number Average Value Number Average Value Number Average Value
LOANS ORIGINATED 343 $144,586 1,423 $130,965 1,000 $123,544 84 $35,210 160 $96,243 32 $50,115 APPLICATIONS APPROVED, NOT ACCEPTED 8 $123,736 107 $111,209 169 $113,408 31 $46,639 20 $105,303 17 $59,890 APPLICATIONS DENIED 41 $134,110 174 $108,901 679 $117,315 148 $37,655 37 $109,217 66 $50,637 APPLICATIONS WITHDRAWN 31 $132,249 171 $139,418 361 $131,049 31 $47,899 20 $87,524 10 $81,593 FILES CLOSED FOR INCOMPLETENESS 7 $128,429 43 $135,115 142 $128,955 12 $40,719 5 $82,766 5 $73,108
Aggregated Statistics For Year 2003(Based on 8 partial tracts) A) FHA, FSA/RHS & VA B) Conventional C) Refinancings D) Home Improvement Loans F) Non-occupant Loans on Number Average Value Number Average Value Number Average Value Number Average Value Number Average Value
LOANS ORIGINATED 489 $130,624 937 $120,353 1,855 $121,837 74 $22,543 154 $98,304 APPLICATIONS APPROVED, NOT ACCEPTED 16 $140,109 75 $112,608 174 $111,265 14 $37,034 6 $83,945 APPLICATIONS DENIED 28 $126,497 126 $88,565 501 $115,483 79 $24,575 19 $129,170 APPLICATIONS WITHDRAWN 31 $129,627 103 $118,903 252 $116,811 8 $29,818 13 $85,361 FILES CLOSED FOR INCOMPLETENESS 5 $120,598 17 $142,550 68 $121,730 6 $47,823 0 $0
Aggregated Statistics For Year 2002(Based on 6 partial tracts) A) FHA, FSA/RHS & VA B) Conventional C) Refinancings D) Home Improvement Loans F) Non-occupant Loans on Number Average Value Number Average Value Number Average Value Number Average Value Number Average Value
LOANS ORIGINATED 143 $126,567 167 $108,427 434 $113,037 25 $30,584 46 $91,212 APPLICATIONS APPROVED, NOT ACCEPTED 6 $115,423 13 $89,632 49 $101,452 4 $18,515 0 $0 APPLICATIONS DENIED 5 $122,918 31 $87,050 192 $93,829 26 $18,516 6 $80,513 APPLICATIONS WITHDRAWN 5 $131,904 17 $103,318 90 $112,261 5 $30,652 2 $193,375 FILES CLOSED FOR INCOMPLETENESS 1 $162,370 6 $124,520 38 $115,797 0 $0 2 $149,810
Aggregated Statistics For Year 2001(Based on 6 partial tracts) A) FHA, FSA/RHS & VA B) Conventional C) Refinancings D) Home Improvement Loans F) Non-occupant Loans on Number Average Value Number Average Value Number Average Value Number Average Value Number Average Value
LOANS ORIGINATED 171 $118,341 184 $104,948 403 $109,782 28 $28,427 35 $97,421 APPLICATIONS APPROVED, NOT ACCEPTED 2 $105,095 13 $91,515 42 $98,148 7 $24,044 3 $81,417 APPLICATIONS DENIED 8 $115,632 52 $76,016 186 $78,103 34 $19,014 8 $97,355 APPLICATIONS WITHDRAWN 10 $128,136 14 $117,482 93 $99,169 10 $19,681 6 $104,665 FILES CLOSED FOR INCOMPLETENESS 1 $67,990 3 $154,437 21 $100,322 2 $48,005 1 $73,690
Aggregated Statistics For Year 2000(Based on 6 partial tracts) A) FHA, FSA/RHS & VA B) Conventional C) Refinancings D) Home Improvement Loans F) Non-occupant Loans on Number Average Value Number Average Value Number Average Value Number Average Value Number Average Value
LOANS ORIGINATED 150 $109,643 171 $101,339 115 $82,430 27 $24,107 17 $90,678 APPLICATIONS APPROVED, NOT ACCEPTED 3 $95,007 22 $63,971 28 $79,953 18 $25,559 2 $50,370 APPLICATIONS DENIED 15 $94,245 80 $65,500 107 $62,099 31 $22,795 7 $51,084 APPLICATIONS WITHDRAWN 11 $106,117 17 $79,329 58 $72,540 8 $26,192 3 $68,533 FILES CLOSED FOR INCOMPLETENESS 3 $112,100 3 $119,093 14 $81,236 1 $20,330 0 $0
Aggregated Statistics For Year 1999(Based on 4 partial tracts) A) FHA, FSA/RHS & VA B) Conventional C) Refinancings D) Home Improvement Loans F) Non-occupant Loans on Number Average Value Number Average Value Number Average Value Number Average Value Number Average Value
LOANS ORIGINATED 217 $105,063 263 $94,885 209 $92,227 37 $19,333 19 $59,362 APPLICATIONS APPROVED, NOT ACCEPTED 4 $92,865 45 $57,495 39 $83,544 18 $16,466 2 $42,715 APPLICATIONS DENIED 18 $102,413 147 $55,943 122 $73,332 49 $17,994 5 $51,680 APPLICATIONS WITHDRAWN 12 $95,846 29 $75,045 90 $80,475 10 $31,025 2 $103,080 FILES CLOSED FOR INCOMPLETENESS 1 $130,720 1 $128,320 24 $81,253 1 $13,010 1 $42,580
Detailed HMDA statistics for the following Tracts:
0704.01
,
0704.02 ,
0705.00 ,
1602.00
Private Mortgage Insurance Companies Aggregated Statistics For Year 2009(Based on 8 partial tracts) A) Conventional B) Refinancings C) Non-occupant Loans on Number Average Value Number Average Value Number Average Value
LOANS ORIGINATED 23 $174,275 24 $170,439 0 $0 APPLICATIONS APPROVED, NOT ACCEPTED 4 $176,508 15 $219,465 1 $130,400 APPLICATIONS DENIED 5 $156,834 10 $135,921 1 $72,440 APPLICATIONS WITHDRAWN 2 $115,500 1 $235,970 0 $0 FILES CLOSED FOR INCOMPLETENESS 2 $163,210 0 $0 0 $0
Aggregated Statistics For Year 2008(Based on 8 partial tracts) A) Conventional B) Refinancings C) Non-occupant Loans on D) Loans On Manufactured Number Average Value Number Average Value Number Average Value Number Average Value
LOANS ORIGINATED 133 $162,395 76 $177,791 15 $131,278 2 $37,600 APPLICATIONS APPROVED, NOT ACCEPTED 58 $172,121 48 $215,552 10 $163,005 0 $0 APPLICATIONS DENIED 21 $161,228 11 $258,866 9 $135,847 0 $0 APPLICATIONS WITHDRAWN 13 $226,082 12 $214,348 3 $120,283 0 $0 FILES CLOSED FOR INCOMPLETENESS 12 $217,206 2 $101,685 4 $194,430 0 $0
Aggregated Statistics For Year 2007(Based on 8 partial tracts) A) Conventional B) Refinancings C) Non-occupant Loans on Number Average Value Number Average Value Number Average Value
LOANS ORIGINATED 332 $159,748 123 $176,805 43 $160,523 APPLICATIONS APPROVED, NOT ACCEPTED 37 $162,783 29 $157,642 4 $232,088 APPLICATIONS DENIED 4 $119,890 3 $156,003 2 $154,550 APPLICATIONS WITHDRAWN 9 $224,644 11 $157,762 0 $0 FILES CLOSED FOR INCOMPLETENESS 2 $214,065 2 $251,770 0 $0
Aggregated Statistics For Year 2006(Based on 8 partial tracts) A) Conventional B) Refinancings C) Non-occupant Loans on D) Loans On Manufactured Number Average Value Number Average Value Number Average Value Number Average Value
LOANS ORIGINATED 247 $170,339 95 $178,499 42 $181,105 0 $0 APPLICATIONS APPROVED, NOT ACCEPTED 30 $192,750 22 $206,732 3 $197,590 2 $72,930 APPLICATIONS DENIED 0 $0 1 $206,400 0 $0 0 $0 APPLICATIONS WITHDRAWN 15 $174,048 9 $186,856 2 $214,605 0 $0 FILES CLOSED FOR INCOMPLETENESS 2 $111,940 0 $0 0 $0 0 $0
Aggregated Statistics For Year 2005(Based on 8 partial tracts) A) Conventional B) Refinancings C) Non-occupant Loans on Number Average Value Number Average Value Number Average Value
LOANS ORIGINATED 187 $160,072 107 $157,704 29 $163,334 APPLICATIONS APPROVED, NOT ACCEPTED 28 $167,366 24 $183,588 8 $168,845 APPLICATIONS DENIED 0 $0 1 $147,760 0 $0 APPLICATIONS WITHDRAWN 8 $146,380 13 $171,661 0 $0 FILES CLOSED FOR INCOMPLETENESS 2 $246,095 1 $83,170 0 $0
Aggregated Statistics For Year 2004(Based on 8 partial tracts) A) Conventional B) Refinancings C) Non-occupant Loans on D) Loans On Manufactured Number Average Value Number Average Value Number Average Value Number Average Value
LOANS ORIGINATED 184 $156,878 148 $143,148 19 $100,636 1 $47,170 APPLICATIONS APPROVED, NOT ACCEPTED 41 $148,051 32 $138,421 5 $96,746 2 $88,090 APPLICATIONS DENIED 5 $118,772 0 $0 0 $0 0 $0 APPLICATIONS WITHDRAWN 12 $163,382 12 $143,208 5 $106,370 0 $0 FILES CLOSED FOR INCOMPLETENESS 0 $0 2 $140,325 0 $0 0 $0
Aggregated Statistics For Year 2003(Based on 8 partial tracts) A) Conventional B) Refinancings C) Non-occupant Loans on Number Average Value Number Average Value Number Average Value
LOANS ORIGINATED 222 $140,457 314 $131,454 52 $110,403 APPLICATIONS APPROVED, NOT ACCEPTED 25 $127,431 45 $145,657 6 $103,608 APPLICATIONS DENIED 7 $116,707 8 $137,808 1 $81,790 APPLICATIONS WITHDRAWN 16 $181,440 35 $126,332 2 $149,140 FILES CLOSED FOR INCOMPLETENESS 2 $87,160 0 $0 2 $87,160
Aggregated Statistics For Year 2002(Based on 6 partial tracts) A) Conventional B) Refinancings C) Non-occupant Loans on Number Average Value Number Average Value Number Average Value
LOANS ORIGINATED 56 $129,461 76 $131,515 9 $96,429 APPLICATIONS APPROVED, NOT ACCEPTED 4 $136,978 16 $135,255 0 $0 APPLICATIONS DENIED 0 $0 3 $116,207 1 $136,500 APPLICATIONS WITHDRAWN 0 $0 6 $107,715 1 $49,560 FILES CLOSED FOR INCOMPLETENESS 0 $0 0 $0 0 $0
Aggregated Statistics For Year 2001(Based on 6 partial tracts) A) Conventional B) Refinancings C) Non-occupant Loans on Number Average Value Number Average Value Number Average Value
LOANS ORIGINATED 75 $126,928 67 $125,044 6 $89,570 APPLICATIONS APPROVED, NOT ACCEPTED 9 $99,352 10 $133,618 2 $46,875 APPLICATIONS DENIED 1 $136,430 1 $67,940 1 $87,050 APPLICATIONS WITHDRAWN 0 $0 4 $117,390 0 $0 FILES CLOSED FOR INCOMPLETENESS 0 $0 0 $0 0 $0
Aggregated Statistics For Year 2000(Based on 6 partial tracts) A) Conventional B) Refinancings C) Non-occupant Loans on Number Average Value Number Average Value Number Average Value
LOANS ORIGINATED 56 $118,055 12 $110,757 1 $68,880 APPLICATIONS APPROVED, NOT ACCEPTED 6 $132,878 2 $91,445 0 $0 APPLICATIONS DENIED 1 $167,170 1 $54,830 0 $0 APPLICATIONS WITHDRAWN 2 $115,590 0 $0 0 $0 FILES CLOSED FOR INCOMPLETENESS 0 $0 0 $0 0 $0
Aggregated Statistics For Year 1999(Based on 4 partial tracts) A) Conventional B) Refinancings C) Non-occupant Loans on Number Average Value Number Average Value Number Average Value
LOANS ORIGINATED 69 $111,896 27 $117,792 2 $92,435 APPLICATIONS APPROVED, NOT ACCEPTED 5 $123,426 5 $138,208 0 $0 APPLICATIONS DENIED 1 $107,510 1 $129,090 1 $115,240 APPLICATIONS WITHDRAWN 1 $114,580 0 $0 0 $0 FILES CLOSED FOR INCOMPLETENESS 1 $86,990 1 $80,240 0 $0
Detailed PMIC statistics for the following Tracts:
0704.01
,
0704.02 ,
0705.00 ,
1602.00
2002 - 2018 National Fire Incident Reporting System (NFIRS) incidents See full 2006 National Fire Incident Reporting System statistics for zip code 30248, Georgia
Most common first names in zip code 30248 among deceased individuals Name Count Lived (average)
James 53 69.4 years William 41 73.5 years John 36 68.6 years Robert 24 72.1 years Mary 23 71.7 years Charles 23 70.2 years Willie 19 69.1 years Henry 19 77.7 years Thomas 17 74.5 years George 16 74.9 years
Most common last names in zip code 30248 among deceased individuals Last name Count Lived (average)
Brown 26 76.4 years Smith 20 74.6 years Johnson 18 72.7 years Sims 16 78.8 years Walker 13 74.6 years Tingle 13 77.9 years Wilson 11 77.9 years Davis 10 78.7 years Cleveland 10 74.7 years Henderson 10 58.1 years
Businesses in zip code 30248
Name Count Name Count
Advance Auto Parts 1 Jones New York 1 Aeropostale 1 KFC 1 Ann Taylor 1 La Quinta 1 Banana Republic 1 Lane Bryant 1 Bath & Body Works 1 Levi Strauss & Co. 1 Burger King 1 McDonald's 2 Charlotte Russe 1 Nike 3 Chico's 1 Old Navy 1 Clarks 1 Pac Sun 1 Comfort Suites 1 Pizza Hut 1 Dairy Queen 1 Publix Super Markets 1 Dennys 1 Quiznos 1 DressBarn 1 Ramada 1 Dressbarn 1 Red Roof Inn 1 Eddie Bauer 1 Rue21 1 Famous Footwear 1 Skechers USA 1 FedEx 2 Subway 2 GNC 1 Super 8 1 Gap 1 Taco Bell 1 Gymboree 1 U-Haul 2 H&R Block 1 UPS 3 J.Crew 1 Waffle House 1

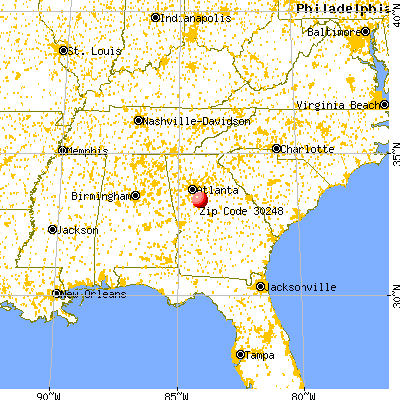


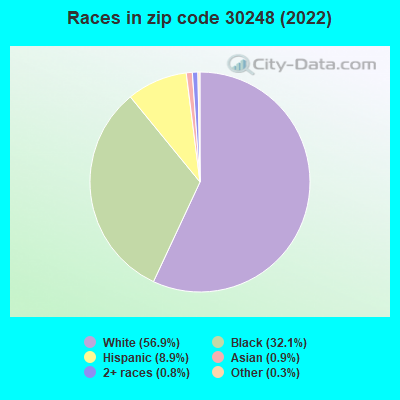


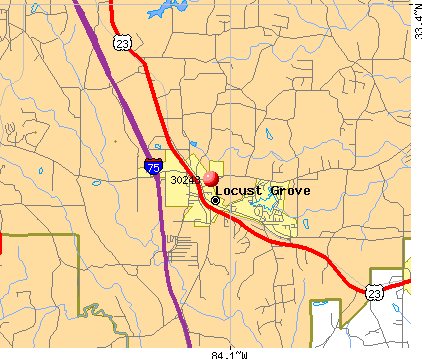 Nearest zip codes: 30234, 30253, 30252, 30233, 30284, 30223.
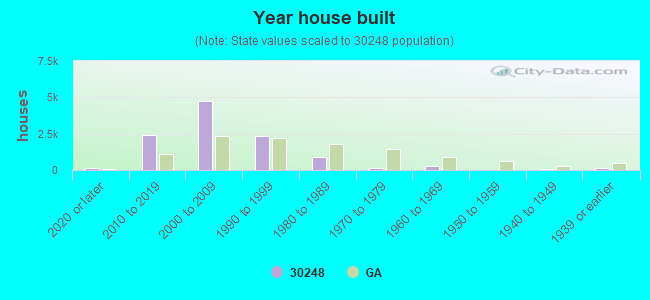

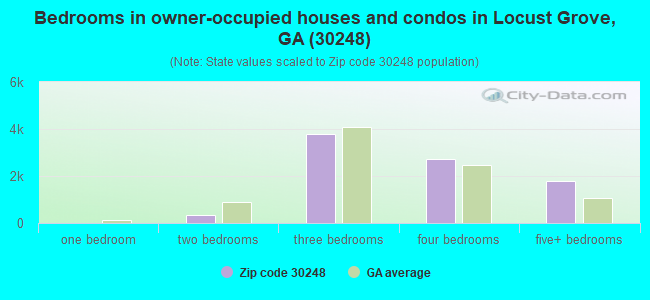
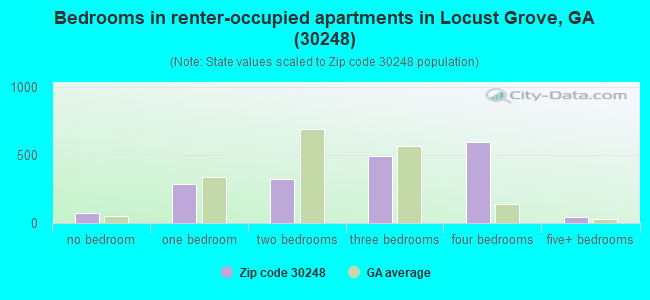
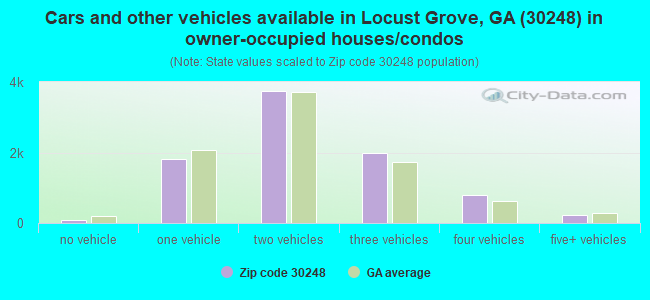
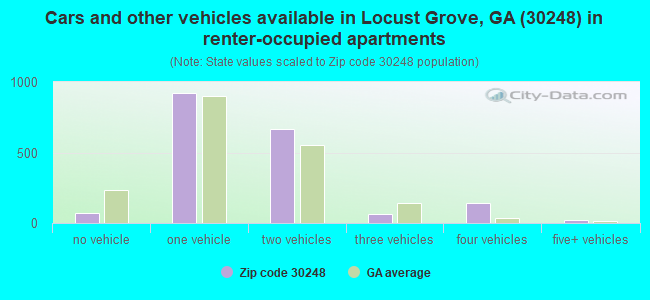


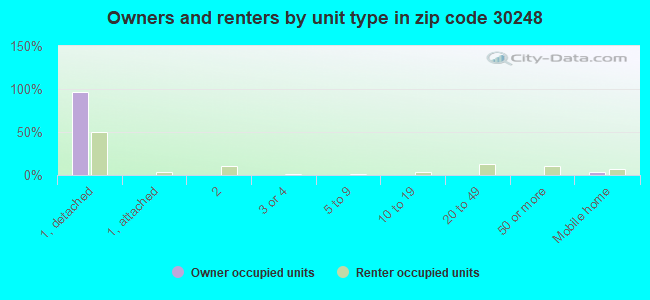
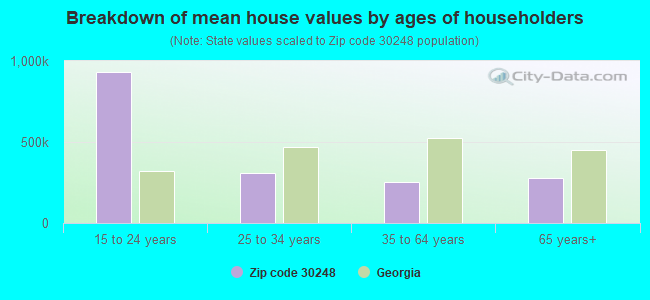


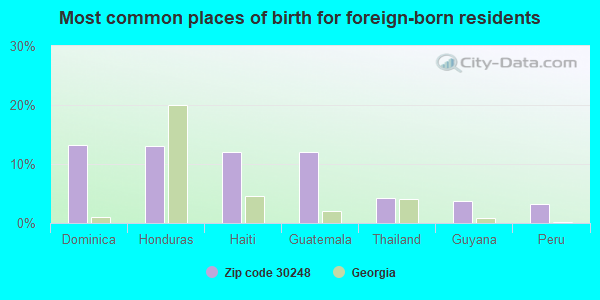
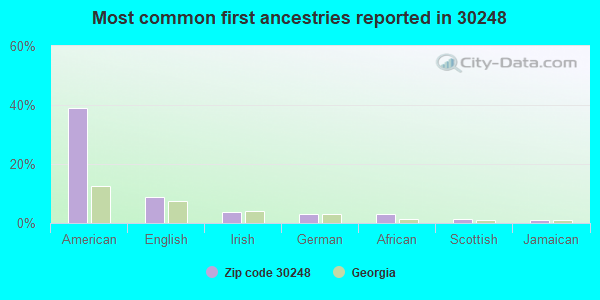
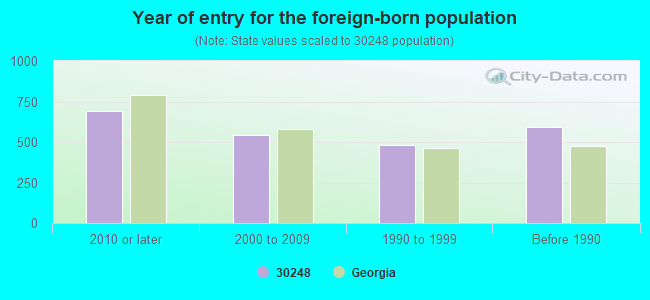
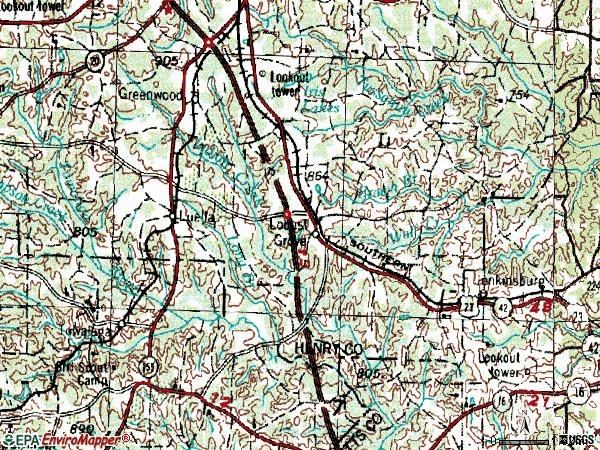

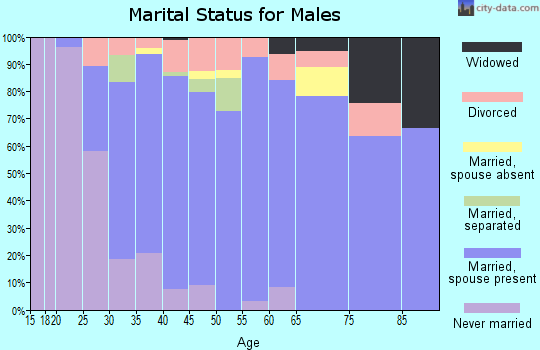

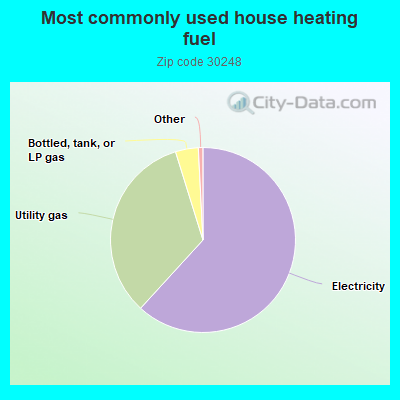
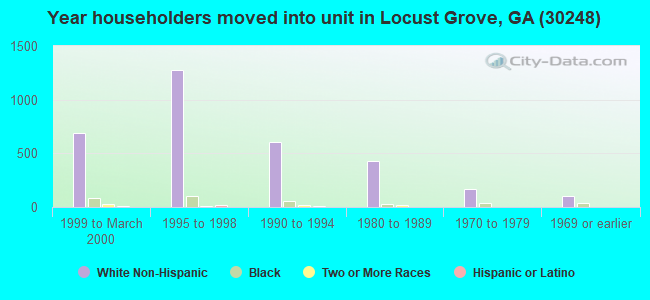
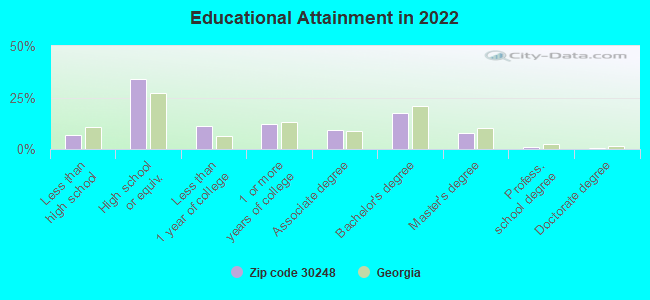
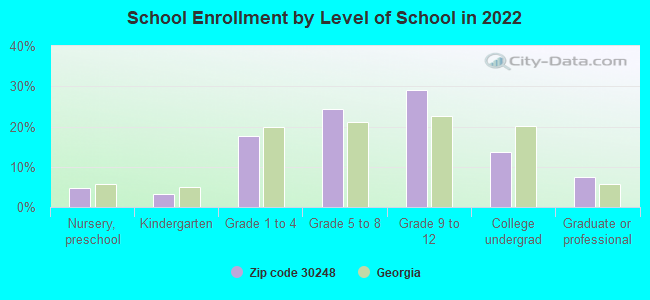
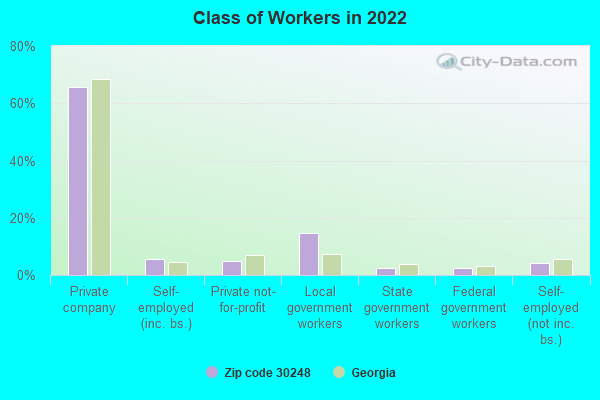
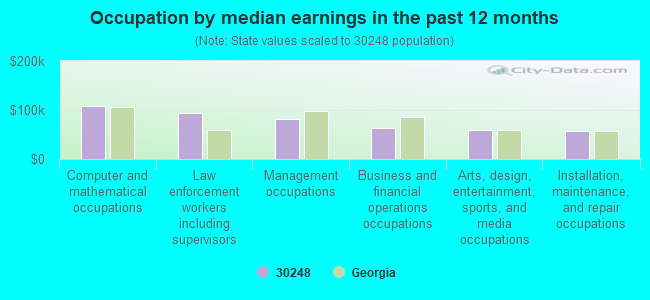
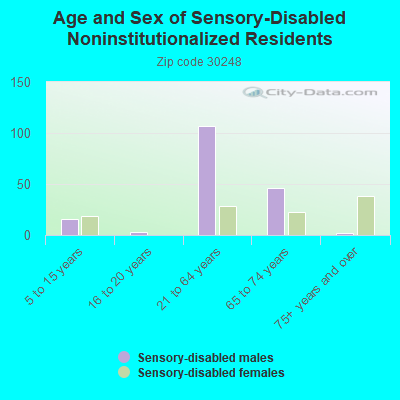
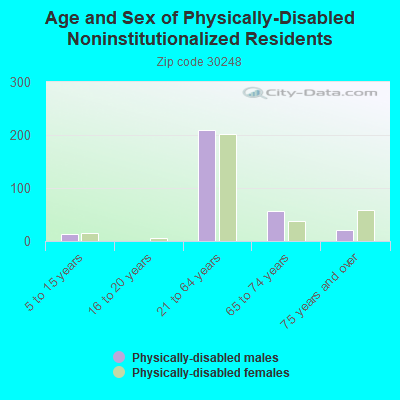
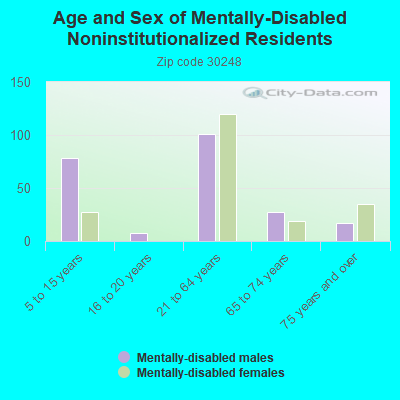
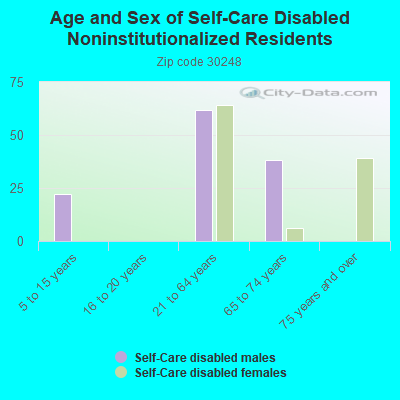
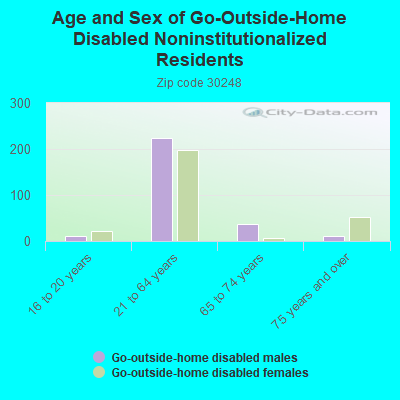
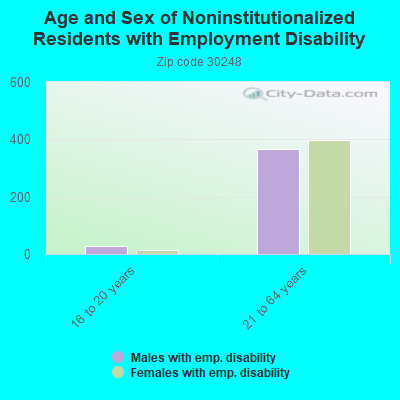
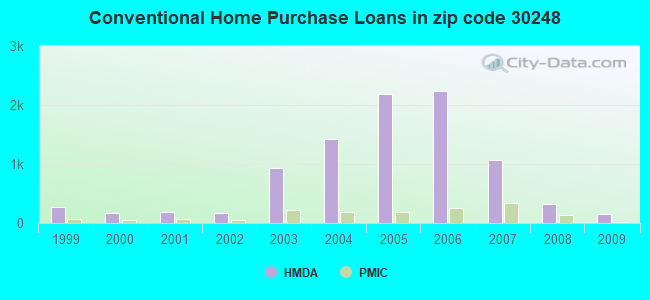
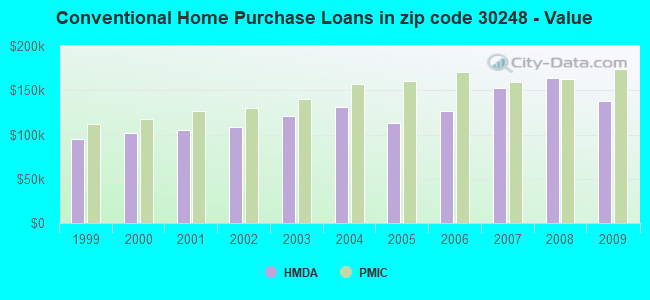
 According to the data from the years 2002 - 2018 the average number of fire incidents per year is 78. The highest number of fire incidents - 121 took place in 2011, and the least - 15 in 2018. The data has a declining trend.
 When looking into fire subcategories, the most incidents belonged to: Outside Fires (51.8%), and Structure Fires (24.0%).