Estimated zip code population in 2022: 61,614 Zip code population in 2010: 49,380 Zip code population in 2000: 26,597
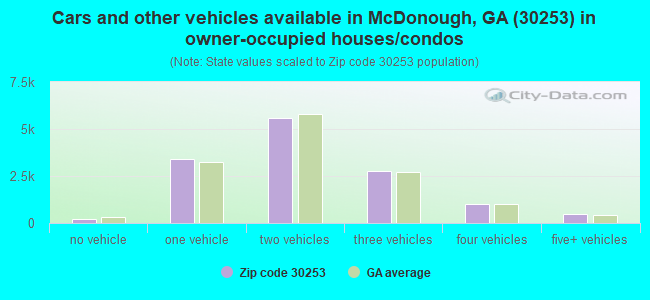
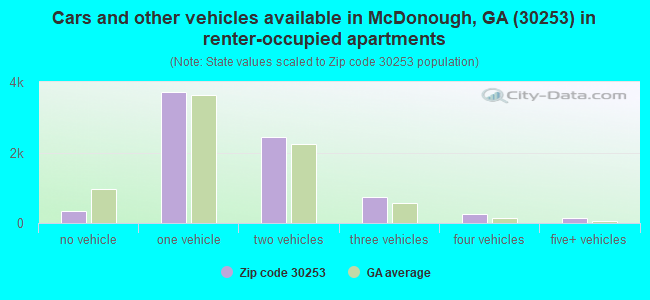
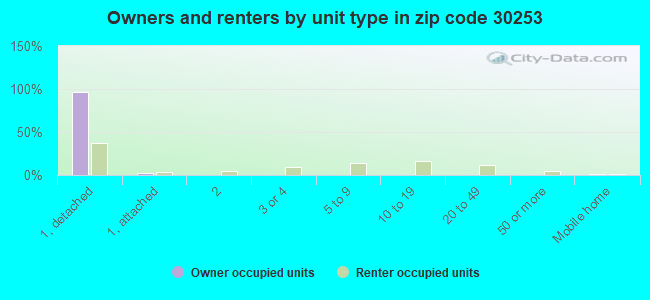
Houses and condos: 22,307 Renter-occupied apartments: 7,601
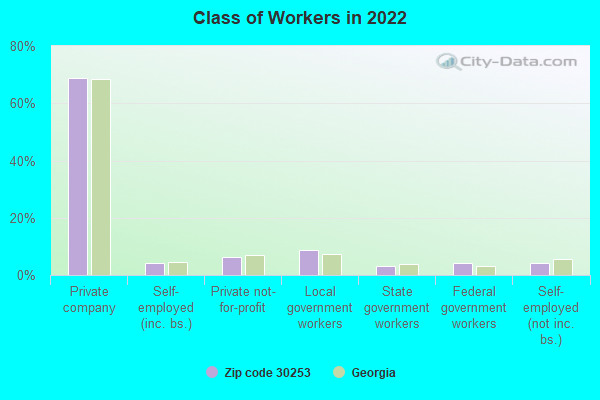
% of renters here:
36%
State:
34%
March 2022 cost of living index in zip code 30253: 101.3 (near average, U.S. average is 100)
Land area: 48.5 sq. mi. Water area: 0.5 sq. mi.
Population density: 1,270 people per square mile
(low).
OSM Map
General Map
Google Map
MSN Map
OSM Map
General Map
Google Map
MSN Map
OSM Map
General Map
Google Map
MSN Map
OSM Map
General Map
Google Map
MSN Map
Please wait while loading the map...
Real estate property taxes paid for housing units in 2022:
This zip code:
0.9% ($2,690)
Georgia:
0.7% ($2,160)
Median real estate property taxes paid for housing units with mortgages in 2022: $2,773 (0.9%) Median real estate property taxes paid for housing units with no mortgage in 2022: $2,119 (0.7%)
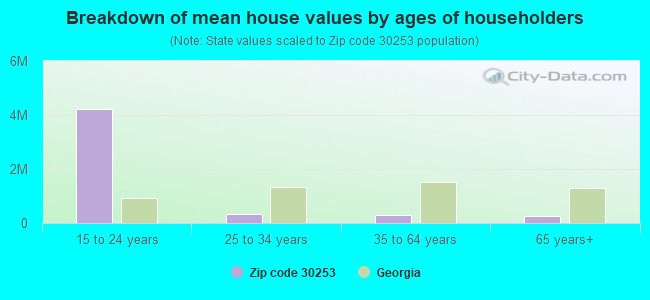
Estimated median house/condo value in 2022: $299,335
30253:
$299,335
Georgia:
$297,400
According to our research of Georgia and other state lists, there were 87 registered sex offenders living in 30253 zip code as of April 26, 2024. The ratio of all residents to sex offenders in zip code 30253 is 614 to 1. The ratio of registered sex offenders to all residents in this zip code is lower than the state average.
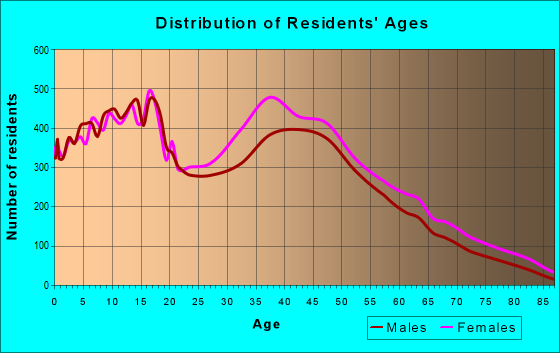
Median resident age:
This zip code:
34.1 years
Georgia median age:
37.6 years
Average household size:
This zip code:
2.9 people
Georgia:
2.6 people
Averages for the 2020 tax year for zip code 30253, filed in 2021:
Average Adjusted Gross Income (AGI) in 2020: $58,970 (Individual Income Tax Returns)
Here:
$58,970
State:
$70,847
Salary/wage: $48,827 (reported on 85.1% of returns)
Here:
$48,827
State:
$59,126
(% of AGI for various income ranges: 1274.4% for AGIs below $25k, 3928.6% for AGIs $25k-50k, 7456.7% for AGIs $50k-75k, 10556.5% for AGIs $75k-100k, 20312.2% for AGIs $100k-200k, 82379.0% for AGIs over 200k)
Taxable interest for individuals: $1,387 (reported on 15.9% of returns)
This zip code:
$1,387
Georgia:
$2,011
(% of AGI for various income ranges: 5.3% for AGIs below $25k, 8.7% for AGIs $25k-50k, 19.8% for AGIs $50k-75k, 35.7% for AGIs $75k-100k, 90.9% for AGIs $100k-200k, 1565.0% for AGIs over 200k)
Ordinary dividends: $5,935 (reported on 8.8% of returns)
Here:
$5,935
State:
$8,996
(% of AGI for various income ranges: 6.2% for AGIs below $25k, 8.6% for AGIs $25k-50k, 28.1% for AGIs $50k-75k, 52.0% for AGIs $75k-100k, 146.1% for AGIs $100k-200k, 5558.5% for AGIs over 200k)
Net capital gain/loss in AGI: +$21,935 (reported on 8.6% of returns)
Here:
+$21,935
State:
+$28,402
(% of AGI for various income ranges: 4.9% for AGIs below $25k, 8.1% for AGIs $25k-50k, 44.8% for AGIs $50k-75k, 132.8% for AGIs $75k-100k, 469.5% for AGIs $100k-200k, 23553.5% for AGIs over 200k)
Profit/loss from business: +$316 (reported on 27.6% of returns)
Here:
+$316
State:
+$6,707
(% of AGI for various income ranges: 71.8% for AGIs $75k-100k, 279.7% for AGIs $100k-200k, 5479.5% for AGIs over 200k)
Taxable individual retirement arrangement distribution: $16,049 (reported on 4.7% of returns)
30253:
$16,049
Georgia:
$20,525
(% of AGI for various income ranges: 20.4% for AGIs below $25k, 35.9% for AGIs $25k-50k, 95.5% for AGIs $50k-75k, 208.0% for AGIs $75k-100k, 454.5% for AGIs $100k-200k, 2632.0% for AGIs over 200k)
Self-employed (Keogh) retirement plans: $22,325 (reported on 0.1% of returns)
30253:
$22,325
Georgia:
$27,751
(% of AGI for various income ranges: 446.5% for AGIs over 200k)
Total itemized deductions: $29,462 (reported on 12.8% of returns)
Here:
$29,462
State:
$34,001
(% of AGI for various income ranges: 46.7% for AGIs below $25k, 257.6% for AGIs $25k-50k, 671.8% for AGIs $50k-75k, 1040.8% for AGIs $75k-100k, 2074.9% for AGIs $100k-200k, 11794.0% for AGIs over 200k)
Charity contributions: $12,182 (reported on 11.2% of returns)
Here:
$12,182
State:
$14,164
(% of AGI for various income ranges: 8.3% for AGIs below $25k, 69.5% for AGIs $25k-50k, 184.0% for AGIs $50k-75k, 321.1% for AGIs $75k-100k, 764.2% for AGIs $100k-200k, 6824.0% for AGIs over 200k)
Taxes paid: $6,862 (reported on 12.8% of returns)
30253:
$6,862
State:
$7,540
(% of AGI for various income ranges: 6.9% for AGIs below $25k, 51.2% for AGIs $25k-50k, 165.5% for AGIs $50k-75k, 272.8% for AGIs $75k-100k, 592.7% for AGIs $100k-200k, 1907.5% for AGIs over 200k)
Earned income credit: $2,562 (reported on 25.0% of returns)
Here:
$2,562
State:
$2,530
(% of AGI for various income ranges: 143.0% for AGIs below $25k, 98.2% for AGIs $25k-50k, 1.0% for AGIs $50k-75k)
Percentage of individuals using paid preparers for their 2020 taxes: 92.7%
Here:
93%
State:
93%
(% for various income ranges: 93.0% for AGIs below $25k, 92.8% for AGIs $25k-50k, 92.7% for AGIs $50k-75k, 92.7% for AGIs $75k-100k, 91.7% for AGIs $100k-200k, 93.1% for AGIs over 200k)
Averages for the 2012 tax year for zip code 30253, filed in 2013:
Average Adjusted Gross Income (AGI) in 2012: $52,348 (Individual Income Tax Returns)
Here:
$52,348
State:
$56,131
Salary/wage: $45,064 (reported on 86.8% of returns)
Here:
$45,064
State:
$47,942
(% of AGI for various income ranges: 83.4% for AGIs below $25k, 87.6% for AGIs $25k-50k, 82.7% for AGIs $50k-75k, 82.4% for AGIs $75k-100k, 79.6% for AGIs $100k-200k, 42.7% for AGIs over 200k)
Taxable interest for individuals: $1,107 (reported on 21.8% of returns)
This zip code:
$1,107
Georgia:
$1,706
(% of AGI for various income ranges: 0.6% for AGIs below $25k, 0.4% for AGIs $25k-50k, 0.4% for AGIs $50k-75k, 0.4% for AGIs $75k-100k, 0.3% for AGIs $100k-200k, 0.8% for AGIs over 200k)
Ordinary dividends: $5,500 (reported on 10.6% of returns)
Here:
$5,500
State:
$7,265
(% of AGI for various income ranges: 0.5% for AGIs below $25k, 0.5% for AGIs $25k-50k, 0.5% for AGIs $50k-75k, 0.5% for AGIs $75k-100k, 0.7% for AGIs $100k-200k, 3.3% for AGIs over 200k)
Net capital gain/loss in AGI: +$12,452 (reported on 7.5% of returns)
Here:
+$12,452
State:
+$16,323
(% of AGI for various income ranges: 0.2% for AGIs $75k-100k, 0.6% for AGIs $100k-200k, 8.0% for AGIs over 200k)
Profit/loss from business: +$4,471 (reported on 20.7% of returns)
Here:
+$4,471
State:
+$7,583
(% of AGI for various income ranges: 5.2% for AGIs below $25k, 0.7% for AGIs $50k-75k, 0.9% for AGIs $75k-100k, 1.1% for AGIs $100k-200k, 4.2% for AGIs over 200k)
Taxable individual retirement arrangement distribution: $15,150 (reported on 6.1% of returns)
30253:
$15,150
Georgia:
$17,199
(% of AGI for various income ranges: 1.6% for AGIs below $25k, 1.3% for AGIs $25k-50k, 1.7% for AGIs $50k-75k, 1.6% for AGIs $75k-100k, 2.4% for AGIs $100k-200k, 1.6% for AGIs over 200k)
Self-employment retirement plans: $17,140 (reported on 0.2% of returns)
30253:
$17,140
Georgia:
$23,277
Total itemized deductions: $21,645 (23% of AGI, reported on 39.0% of returns)
Here:
$21,645
State:
$23,886
Here:
23.1% of AGI
State:
21.5% of AGI
(% of AGI for various income ranges: 10.6% for AGIs below $25k, 16.7% for AGIs $25k-50k, 19.3% for AGIs $50k-75k, 19.8% for AGIs $75k-100k, 17.4% for AGIs $100k-200k, 11.9% for AGIs over 200k)
Charity contributions: $5,048 (reported on 33.8% of returns)
Here:
$5,048
State:
$5,507
(% of AGI for various income ranges: 1.6% for AGIs below $25k, 3.0% for AGIs $25k-50k, 3.7% for AGIs $50k-75k, 3.9% for AGIs $75k-100k, 3.7% for AGIs $100k-200k, 3.0% for AGIs over 200k)
Taxes paid: $6,340 (reported on 38.8% of returns)
30253:
$6,340
State:
$7,838
(% of AGI for various income ranges: 1.5% for AGIs below $25k, 3.2% for AGIs $25k-50k, 4.7% for AGIs $50k-75k, 5.5% for AGIs $75k-100k, 6.0% for AGIs $100k-200k, 5.7% for AGIs over 200k)
Earned income credit: $2,667 (reported on 27.4% of returns)
Here:
$2,667
State:
$2,589
(% of AGI for various income ranges: 10.9% for AGIs below $25k, 1.5% for AGIs $25k-50k)
Percentage of individuals using paid preparers for their 2012 taxes: 52.4%
Here:
52%
State:
55%
(% for various income ranges: 50.1% for AGIs below $25k, 51.9% for AGIs $25k-50k, 53.1% for AGIs $50k-75k, 56.1% for AGIs $75k-100k, 53.8% for AGIs $100k-200k, 80.0% for AGIs over 200k)
Averages for the 2004 tax year for zip code 30253, filed in 2005:
Average Adjusted Gross Income (AGI) in 2004: $51,446 (Individual Income Tax Returns)
Here:
$51,446
State:
$47,553
Salary/wage: $46,111 (reported on 89.6% of returns)
Here:
$46,111
State:
$42,178
(% of AGI for various income ranges: 185.7% for AGIs below $10k, 84.2% for AGIs $10k-25k, 89.4% for AGIs $25k-50k, 85.9% for AGIs $50k-75k, 86.9% for AGIs $75k-100k, 66.4% for AGIs over 100k)
Taxable interest for individuals: $1,428 (reported on 36.8% of returns)
This zip code:
$1,428
Georgia:
$1,772
(% of AGI for various income ranges: 8.5% for AGIs below $10k, 1.3% for AGIs $10k-25k, 0.7% for AGIs $25k-50k, 0.6% for AGIs $50k-75k, 0.7% for AGIs $75k-100k, 1.3% for AGIs over 100k)
Taxable dividends: $2,008 (reported on 17.3% of returns)
Here:
$2,008
State:
$4,283
(% of AGI for various income ranges: 2.6% for AGIs below $10k, 0.5% for AGIs $10k-25k, 0.4% for AGIs $25k-50k, 0.4% for AGIs $50k-75k, 0.3% for AGIs $75k-100k, 1.1% for AGIs over 100k)
Net capital gain/loss: +$12,036 (reported on 12.9% of returns)
Here:
+$12,036
State:
+$16,461
(% of AGI for various income ranges: 1.1% for AGIs below $10k, 0.3% for AGIs $10k-25k, 0.2% for AGIs $25k-50k, 0.6% for AGIs $50k-75k, 1.0% for AGIs $75k-100k, 7.3% for AGIs over 100k)
Profit/loss from business: +$5,280 (reported on 16.4% of returns)
Here:
+$5,280
State:
+$8,201
(% of AGI for various income ranges: 6.4% for AGIs below $10k, 3.8% for AGIs $10k-25k, 0.8% for AGIs $25k-50k, 1.5% for AGIs $50k-75k, 1.1% for AGIs $75k-100k, 2.0% for AGIs over 100k)
IRA payment deduction: $2,725 (reported on 2.0% of returns)
30253:
$2,725
Georgia:
$2,969
(% of AGI for various income ranges: 0.1% for AGIs $10k-25k, 0.1% for AGIs $25k-50k, 0.1% for AGIs $50k-75k, 0.1% for AGIs $75k-100k, 0.1% for AGIs over 100k)
Self-employed pension: $13,556 (reported on 0.5% of returns)
Here:
$13,556
Georgia:
$16,203
Total itemized deductions: $19,933 (25% of AGI, reported on 52.0% of returns)
Here:
$19,933
State:
$19,944
Here:
25.2% of AGI
State:
22.6% of AGI
(% of AGI for various income ranges: 24.8% for AGIs below $10k, 14.7% for AGIs $10k-25k, 23.0% for AGIs $25k-50k, 23.3% for AGIs $50k-75k, 21.8% for AGIs $75k-100k, 17.2% for AGIs over 100k)
Charity contributions deductions: $4,166 (5% of AGI, reported on 46.8% of returns)
Here:
$4,166
State:
$4,354
Here:
5.1% of AGI
State:
4.7% of AGI
(% of AGI for various income ranges: 1.8% for AGIs below $10k, 2.1% for AGIs $10k-25k, 3.8% for AGIs $25k-50k, 4.0% for AGIs $50k-75k, 3.9% for AGIs $75k-100k, 4.0% for AGIs over 100k)
Total tax: $7,604 (reported on 73.6% of returns)
30253:
$7,604
State:
$8,223
(% of AGI for various income ranges: 4.8% for AGIs below $10k, 3.4% for AGIs $10k-25k, 5.5% for AGIs $25k-50k, 7.7% for AGIs $50k-75k, 9.1% for AGIs $75k-100k, 17.8% for AGIs over 100k)
Earned income credit: $1,934 (reported on 18.3% of returns)
Here:
$1,934
State:
$1,986
Percentage of individuals using paid preparers for their 2004 taxes: 58.1%
Here:
58%
State:
62%
(% for various income ranges: 49.9% for AGIs below $10k, 60.4% for AGIs $10k-25k, 58.2% for AGIs $25k-50k, 58.0% for AGIs $50k-75k, 57.6% for AGIs $75k-100k, 66.6% for AGIs over 100k)
Household received Food Stamps/SNAP in the past 12 months: 3,249 Household did not receive Food Stamps/SNAP in the past 12 months: 17,929
Women who had a birth in the past 12 months: 1,177 (618 now married, 558 unmarried) Women who did not have a birth in the past 12 months: 15,751 (5,469 now married, 10,290 unmarried)
Housing units in zip code 30253 with a mortgage: 9,758 (686 second mortgage, 537 both second mortgage and home equity loan) Houses without a mortgage: 88
Median monthly owner costs for units with a mortgage: $1,665 Median monthly owner costs for units without a mortgage: $541
Residents with income below the poverty level in 2022:
This zip code:
10.5%
Whole state:
12.7%
Residents with income below 50% of the poverty level in 2022:
This zip code:
5.6%
Whole state:
6.3%
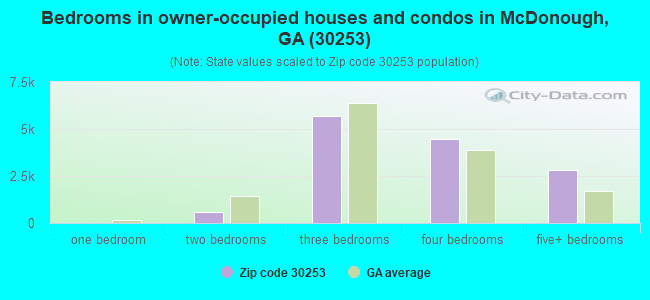
Median number of rooms in houses and condos:
Here:
7.2
State:
6.8
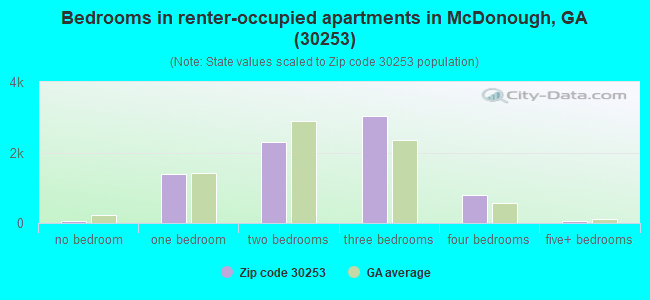
Median number of rooms in apartments:
Here:
4.9
State:
4.6
Notable locations in this zip code not listed on our city pages
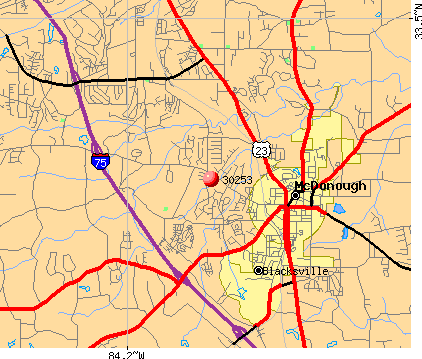
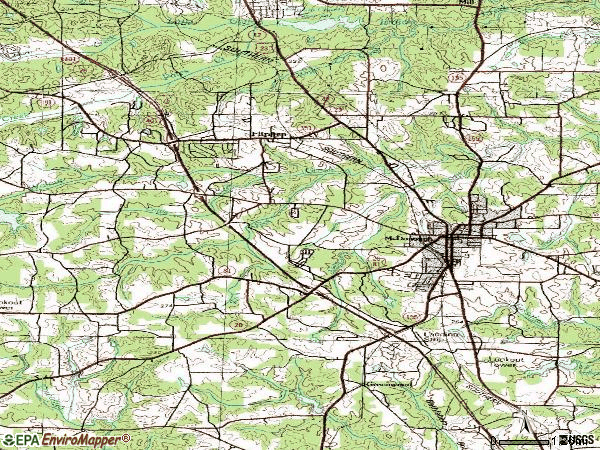
Notable locations in zip code 30253: Shingle Roof Campground (A), Henry County Chamber of Commerce (B), McDonough Fire Department Station 2 (C), Henry County Fire Department Station 1 Headquarters (D), McDonough Police Station (E), McDonough Fire Department (F), Henry County Fire Department Station 7 (G), Henry County Fire Department Station 3 (H), McDonough City Hall (I), Henry County Jail (J), Henry County Courthouse (K). Display/hide their locations on the map
Shopping Centers: McDonough Crossing Shopping Center (1), McDonough Marketplace Shopping Center (2), McDonough Place Shopping Center (3), McDonough Plaza Shopping Center (4), McDonough West Shopping Center (5). Display/hide their locations on the map
Churches in zip code 30253 include: Bethlehem Baptist Church (A), Cleveland Chapel African Methodist Episcopal Church (B), Wesley Methodist Church (C), Shiloh Baptist Church (D), Seven Day Church (E), Power of God Church (F), New Hope Church (G), Mount Carmel Church (H), McDonough Methodist Church (I). Display/hide their locations on the map
Cemeteries: Akins Cemetery (1), Brannan Cemetery (2), Elliott Cemetery (3), English Cemetery (4), Hudson-Pair-Steele Cemetery (5). Display/hide their locations on the map
Reservoirs: Steele Lake (A), Painted Turtle Lake (B), Green Valley Lake (C), Lake Foster (D), McGarity Lake (E), Dailey Lake (F). Display/hide their locations on the map
8,677 married couples with children.
5,470 single-parent households (656 men, 4,814 women).
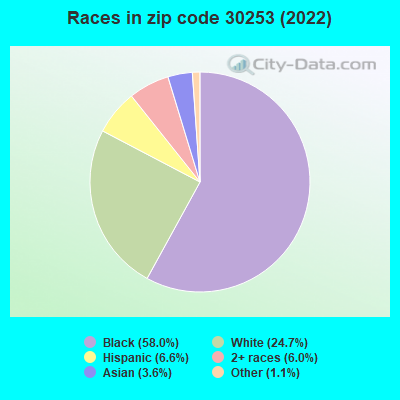
88.4% of residents of 30253 zip code speak English at home.
5.4% of residents speak Spanish at home (67% very well, 13% well, 13% not well, 7% not at all).
2.4% of residents speak other Indo-European language at home (68% very well, 29% well, 1% not well, 2% not at all).
1.9% of residents speak Asian or Pacific Island language at home (52% very well, 28% well, 15% not well, 4% not at all).
2.0% of residents speak other language at home (89% very well, 8% well, 3% not well).
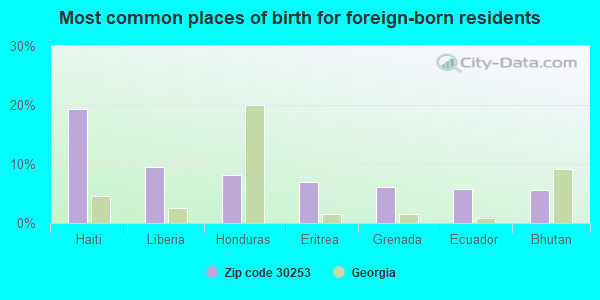
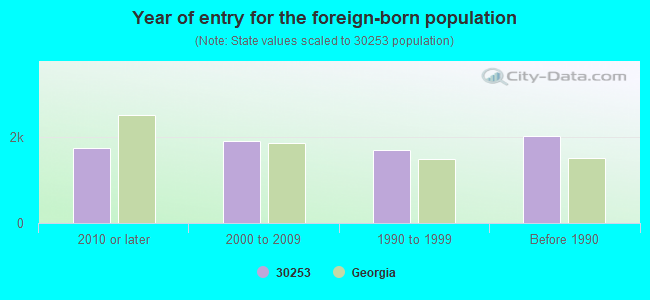
Foreign born population: 6,339 (10.3%) (69.3% of them are naturalized citizens)
Major facilities with environmental interests located in this zip code:
KANGAROO #45 (269 KEYS FERRY ST in MC DONOUGH, GA)
STATE MASTER (Georgia's Geographic Environmental Information) - UST-2, UNDERGROUND STORAGE TANK PROGRAM, UST-3, UST-4, UST-5, UST-6, UST-1, (Resource Conservation and Recovery Act (tracking hazardous waste)) Organizations: THE PANTRY INC (CONTACT/OPERATOR)
, PETROSOUTH INC (CONTACT/OWNER)
, KANGAROO INC. (CONTACT/OWNER)
, PETRO SERVICE (INSTALLER)
Alternative names: KANGAROO #28
QUIKTRIP #783 (50 WILLOW LANE in MCDONOUGH, GA)
STATE MASTER (Georgia's Geographic Environmental Information) - UST-1, UNDERGROUND STORAGE TANK PROGRAM, UST-2, UST-3, Conditionally Exempt Small Quantity Generators, less than 100 kg/month of hazardous waste (Resource Conservation and Recovery Act (tracking hazardous waste)) - notification Organizations: QUIKTRIP CORP (CONTACT/OPERATOR)
, QUALITY ENTERPRISES (INSTALLER)
AIR ASSOCIATES INC (2205 HWY 42 NORTH in MCDONOUGH, GA)
(Resource Conservation and Recovery Act (tracking hazardous waste)) - ICIS-, ENFORCEMENT/COMPLIANCE ACTIVITY Organizations: CENTURY-LENZE DEVELOPMENT LLC (CONTACT/OPERATOR)
, KEVIN LENZE (CONTACT/OWNER)
MCDONOUGH ELEMENTARY SCHOOL (330 TOMLINSON STREET in MCDONOUGH, GA)
(Geographic Names Information System) (National Center for Education Statistics) - STATE ID-0803 Organizations: HENRY COUNTY (SCHOOL DISTRICT)
OAKLAND ELEMENTARY SCHOOL (551 HIGHWAY 81 WEST in MCDONOUGH, GA)
(Geographic Names Information System) (National Center for Education Statistics) - STATE ID-0291 Organizations: HENRY COUNTY (SCHOOL DISTRICT)
MCDONOUGH PRIMARY SCHOOL (330 TOMLINSON STREET in MCDONOUGH, GA)
(National Center for Education Statistics) - STATE ID-1052 Organizations: HENRY COUNTY (SCHOOL DISTRICT)
NEC TECHNOLOGIES INC (1 NEC DRIVE in MCDONOUGH, GA)
AIR MINOR (AIRS/AFS) (Resource Conservation and Recovery Act (tracking hazardous waste)) Business SIC classification: PLASTICS PRODUCTS Organizations: OPERNAME (CONTACT/OPERATOR)
, NEC CORP LTD (CONTACT/OWNER)
NAILS CREEK (WETLANDS ADJACENT TO) (BETWEEN TURNER RD AND THE FARM RD in MC DONOUGH, GA)
(Integrated Compliance Information System) - ICIS-04-1998-0165, FORMAL ENFORCEMENT ACTION, ICIS-04-1998-0167,
MCDONOUGH WWTP (TURNERS CHURCH RD WALNUT in MCDONOUGH, GA)
CARMICHAEL OLDS GMC (436 MACON RD in MCDONOUGH, GA)
(Resource Conservation and Recovery Act (tracking hazardous waste)) Organizations: OPERNAME (CONTACT/OPERATOR)
, AUSBAND EDDIE JR (CONTACT/OWNER)
Housing units lacking complete plumbing facilities: 0.1% Housing units lacking complete kitchen facilities: 0.7%
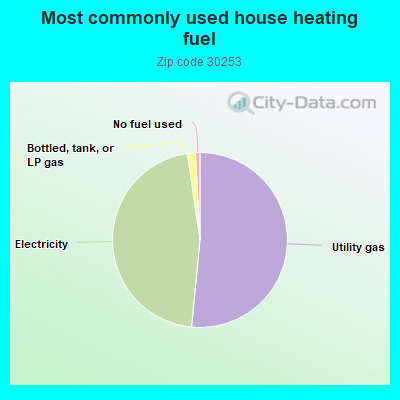
51.5%Utility gas
46.1%Electricity
1.5%Bottled, tank, or LP gas
0.8%No fuel used
Population in 1990: 18,550. Population change in the 1990s: +8,047 (+43.4%).
Place of birth for U.S.-born residents:
This state: 30,301
Northeast: 4,776
Midwest: 4,415
South: 12,255
West: 2,358
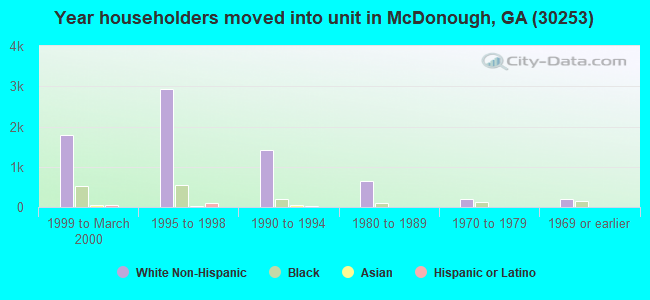
40% of the 30253 zip code residents lived in the same house 5 years ago. Out of people who lived in different houses, 25% lived in this county. Out of people who lived in different counties, 50% lived in Georgia.
88% of the 30253 zip code residents lived in the same house 1 year ago. Out of people who lived in different houses, 37% moved from this county. Out of people who lived in different houses, 37% moved from different county within same state. Out of people who lived in different houses, 21% moved from different state. Out of people who lived in different houses, 5% moved from abroad.
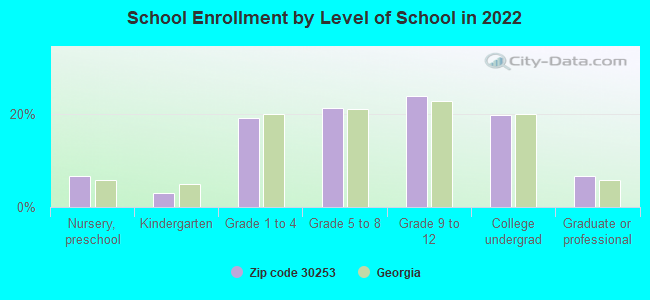
Private vs. public school enrollment:
Students in private schools in grades 1 to 8 (elementary and middle school): 1,206
Here:
16.8%
Georgia:
12.1%
Students in private schools in grades 9 to 12 (high school): 603
Here:
14.3%
Georgia:
10.8%
Students in private undergraduate colleges: 448
Here:
12.9%
Georgia:
17.1%
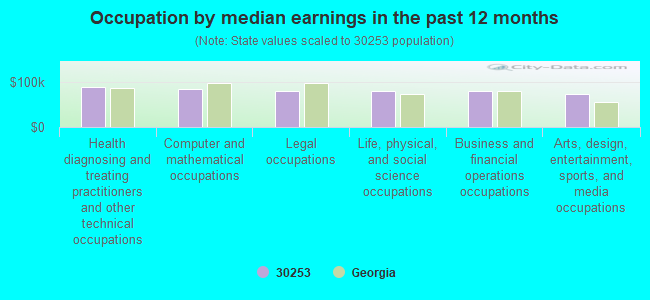
Occupation by median earnings in the past 12 months ($)
90,640Health diagnosing and treating practitioners and other technical occupations
86,152Computer and mathematical occupations
81,958Legal occupations
81,576Life, physical, and social science occupations
81,194Business and financial operations occupations
74,976Arts, design, entertainment, sports, and media occupations
Companies with federal contracts located in this zip code:
BENNETT MOTOR EXPRESS, INC (1001 INDUSTRIAL PARKWAY in MCDONOUGH, GA) : $1,945,581 in 10 contractsfrom 2003 to 2005
Contracts for Motor Freight, Transport Vessels-Passenger And Troop, Other Transportation Travel and Relocation Services by Army, Office of Assistant Secretary for Health except national centers (disused code), Bureau of Prisoners/Federal Prison System Signed by year:2000: $0; 2001: $0; 2002: $0; 2003: $166,574; 2004: $1,737,202; 2005: $41,805; 2006: $0.
Biggest contracts:
$1,697,057 with Army for Motor Freight. Signed on 2004-12-27. Completion date: 2006-01-12.
$124,936, same as above.Signed on 2003-10-01. Completion date: 2006-01-12.
$41,805, same as above.Signed on 2005-11-30. Completion date: 2006-01-12.
$41,638 with Office of Assistant Secretary for Health except national centers (disused code) for Transport Vessels-Passenger And Troop. Signed on 2003-05-15. Completion date: 2003-05-15.
KMA BUSINESS SOLUTIONS, INC (24 JONESBORO STREET in MCDONOUGH, GA; small business) : $34,000 in 6 contractsfrom 2005 to 2006
Contracts for Other Professional Services by Army Signed by year:2000: $0; 2001: $0; 2002: $0; 2003: $0; 2004: $0; 2005: $22,000; 2006: $12,000.
Biggest contracts:
$12,000 with Army for Other Professional Services. Taking place in WA. Signed on 2006-03-14. Completion date: 2006-03-16.
$12,000, same as above.Signed on 2005-04-13. Completion date: 2005-04-13.
$10,000, same as above.Signed on 2005-12-19. Completion date: 2005-11-01.
$10,000, same as above.Signed on 2005-08-23. Completion date: 2005-09-25.
SOUTHERN SATELLITES (153 HAMPTON ST STE 200 in MC DONOUGH, GA)
$18,040 with Army for Radio and Television Communication Equipment, Except Airborne. Signed on 2004-09-29. Completion date: 2004-10-08.
POWER TECH, INC (385 WYLDEWOODE DR in MC DONOUGH, GA; small business) : $13,570 in 2 contractsfrom 2003 to 2004
$6,850 with Navy for Maintenance, Repair and Rebuilding of Equipment -- Automatic Data Processing Equipment (Including Firmware), Software, Supplies and Support Equipment. Taking place in VA. Signed on 2004-10-01. Completion date: 2005-09-30.
$6,720, same as above.Signed on 2003-11-06. Completion date: 2004-09-30.
Top industries in this zip code by the number of employees in 2005:
2002 - 2018 National Fire Incident Reporting System (NFIRS) incidents
According to the data from the years 2002 - 2018 the average number of fires per year is 237. The highest number of fire incidents - 447 took place in 2006, and the least - 1 in 2003. The data has a declining trend.
When looking into fire subcategories, the most incidents belonged to: Outside Fires (45.6%), and Structure Fires (34.0%).
Fire incident types reported to NFIRS in Zip Code 30253


 Nearest zip codes: 30281, 30248, 30252, 30250, 30228, 30284.
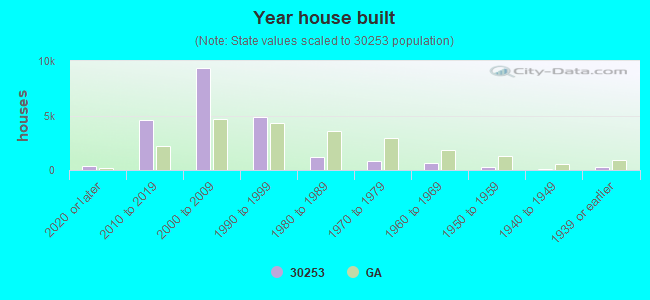


 According to the data from the years 2002 - 2018 the average number of fires per year is 237. The highest number of fire incidents - 447 took place in 2006, and the least - 1 in 2003. The data has a declining trend.
 When looking into fire subcategories, the most incidents belonged to: Outside Fires (45.6%), and Structure Fires (34.0%).