Estimated zip code population in 2022: 9,762 Zip code population in 2010: 7,899 Zip code population in 2000: 26,061
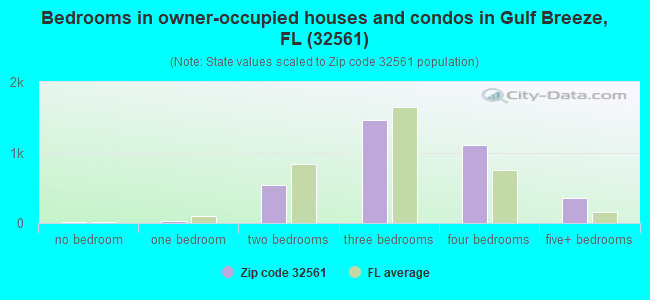
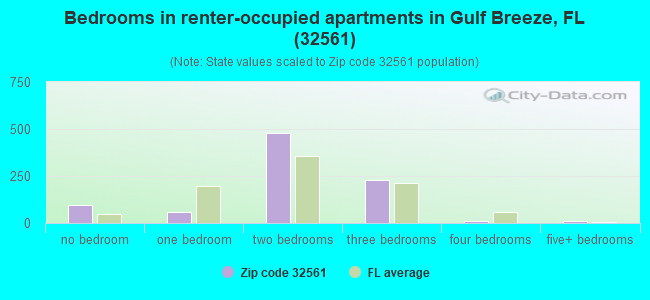
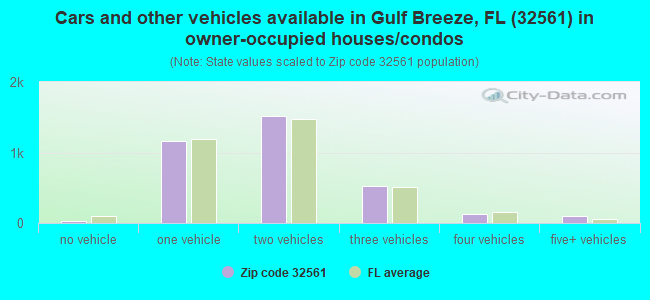
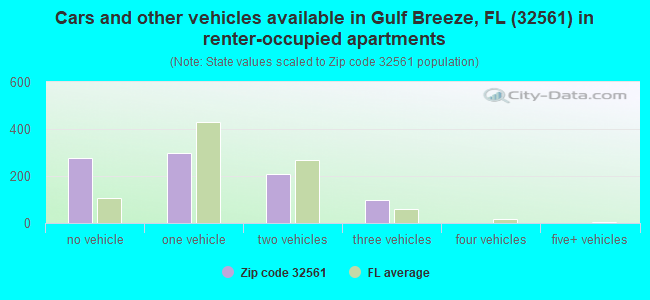
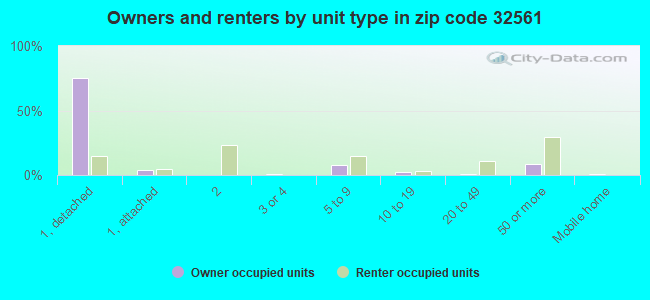
Houses and condos: 6,750 Renter-occupied apartments: 878
% of renters here:
20%
State:
33%
March 2022 cost of living index in zip code 32561: 88.2 (less than average, U.S. average is 100)
Land area: 11.8 sq. mi. Water area: 26.9 sq. mi.
Population density: 828 people per square mile
(low).
OSM Map
General Map
Google Map
MSN Map
OSM Map
General Map
Google Map
MSN Map
OSM Map
General Map
Google Map
MSN Map
OSM Map
General Map
Google Map
MSN Map
Please wait while loading the map...
Real estate property taxes paid for housing units in 2022:
This zip code:
0.5% ($3,117)
Florida:
0.7% ($2,529)
Median real estate property taxes paid for housing units with mortgages in 2022: $3,570 (0.5%) Median real estate property taxes paid for housing units with no mortgage in 2022: $2,894 (0.5%)
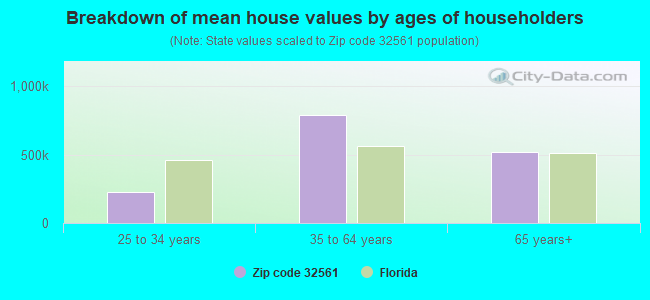
Estimated median house/condo value in 2022: $637,792
32561:
$637,792
Florida:
$354,100
According to our research of Florida and other state lists, there was 1 registered sex offender living in 32561 zip code as of April 26, 2024. The ratio of all residents to sex offenders in zip code 32561 is 9,340 to 1. The ratio of registered sex offenders to all residents in this zip code is much lower than the state average.
Median resident age:
This zip code:
51.0 years
Florida median age:
42.7 years
Average household size:
This zip code:
2.2 people
Florida:
2.5 people
Averages for the 2020 tax year for zip code 32561, filed in 2021:
Average Adjusted Gross Income (AGI) in 2020: $264,550 (Individual Income Tax Returns)
Here:
$264,550
State:
$82,200
Salary/wage: $132,407 (reported on 71.0% of returns)
Here:
$132,407
State:
$58,347
(% of AGI for various income ranges: 1052.0% for AGIs below $25k, 3294.8% for AGIs $25k-50k, 5692.7% for AGIs $50k-75k, 8084.5% for AGIs $75k-100k, 17053.8% for AGIs $100k-200k, 103220.4% for AGIs over 200k)
Taxable interest for individuals: $5,857 (reported on 53.0% of returns)
This zip code:
$5,857
Florida:
$4,272
(% of AGI for various income ranges: 36.4% for AGIs below $25k, 101.1% for AGIs $25k-50k, 194.3% for AGIs $50k-75k, 284.5% for AGIs $75k-100k, 438.0% for AGIs $100k-200k, 3593.9% for AGIs over 200k)
Ordinary dividends: $16,589 (reported on 42.8% of returns)
Here:
$16,589
State:
$15,863
(% of AGI for various income ranges: 85.5% for AGIs below $25k, 170.2% for AGIs $25k-50k, 410.3% for AGIs $50k-75k, 447.3% for AGIs $75k-100k, 1209.6% for AGIs $100k-200k, 8161.8% for AGIs over 200k)
Net capital gain/loss in AGI: +$192,397 (reported on 41.0% of returns)
Here:
+$192,397
State:
+$62,983
(% of AGI for various income ranges: 43.9% for AGIs below $25k, 100.7% for AGIs $25k-50k, 332.7% for AGIs $50k-75k, 653.6% for AGIs $75k-100k, 1414.2% for AGIs $100k-200k, 123023.2% for AGIs over 200k)
Profit/loss from business: +$27,212 (reported on 21.8% of returns)
Here:
+$27,212
State:
+$9,719
(% of AGI for various income ranges: 125.5% for AGIs below $25k, 402.0% for AGIs $25k-50k, 482.3% for AGIs $50k-75k, 468.2% for AGIs $75k-100k, 1658.4% for AGIs $100k-200k, 5033.2% for AGIs over 200k)
Taxable individual retirement arrangement distribution: $31,543 (reported on 16.5% of returns)
32561:
$31,543
Florida:
$24,823
(% of AGI for various income ranges: 108.8% for AGIs below $25k, 230.5% for AGIs $25k-50k, 430.7% for AGIs $50k-75k, 1031.8% for AGIs $75k-100k, 1759.8% for AGIs $100k-200k, 3605.7% for AGIs over 200k)
Self-employed (Keogh) retirement plans: $30,362 (reported on 1.8% of returns)
32561:
$30,362
Florida:
$29,694
(% of AGI for various income ranges: 100.9% for AGIs $100k-200k, 705.4% for AGIs over 200k)
Total itemized deductions: $65,177 (reported on 22.7% of returns)
Here:
$65,177
State:
$45,393
(% of AGI for various income ranges: 163.3% for AGIs below $25k, 337.7% for AGIs $25k-50k, 965.3% for AGIs $50k-75k, 1118.2% for AGIs $75k-100k, 2328.2% for AGIs $100k-200k, 17155.4% for AGIs over 200k)
Charity contributions: $32,333 (reported on 15.4% of returns)
Here:
$32,333
State:
$20,178
(% of AGI for various income ranges: 38.9% for AGIs $25k-50k, 87.7% for AGIs $50k-75k, 117.3% for AGIs $75k-100k, 348.4% for AGIs $100k-200k, 7160.7% for AGIs over 200k)
Taxes paid: $7,598 (reported on 18.5% of returns)
32561:
$7,598
State:
$6,967
(% of AGI for various income ranges: 13.9% for AGIs below $25k, 30.5% for AGIs $25k-50k, 102.7% for AGIs $50k-75k, 122.7% for AGIs $75k-100k, 283.3% for AGIs $100k-200k, 1508.2% for AGIs over 200k)
Earned income credit: $1,596 (reported on 6.2% of returns)
Here:
$1,596
State:
$2,306
(% of AGI for various income ranges: 45.1% for AGIs below $25k, 30.9% for AGIs $25k-50k)
Percentage of individuals using paid preparers for their 2020 taxes: 89.8%
Here:
90%
State:
92%
(% for various income ranges: 87.5% for AGIs below $25k, 89.1% for AGIs $25k-50k, 86.5% for AGIs $50k-75k, 90.0% for AGIs $75k-100k, 91.8% for AGIs $100k-200k, 92.4% for AGIs over 200k)
Averages for the 2012 tax year for zip code 32561, filed in 2013:
Average Adjusted Gross Income (AGI) in 2012: $133,226 (Individual Income Tax Returns)
Here:
$133,226
State:
$60,316
Salary/wage: $86,671 (reported on 75.8% of returns)
Here:
$86,671
State:
$45,277
(% of AGI for various income ranges: 71.6% for AGIs below $25k, 67.6% for AGIs $25k-50k, 59.5% for AGIs $50k-75k, 63.5% for AGIs $75k-100k, 62.9% for AGIs $100k-200k, 40.5% for AGIs over 200k)
Taxable interest for individuals: $4,579 (reported on 49.7% of returns)
This zip code:
$4,579
Florida:
$3,587
(% of AGI for various income ranges: 1.8% for AGIs below $25k, 1.6% for AGIs $25k-50k, 3.0% for AGIs $50k-75k, 1.6% for AGIs $75k-100k, 1.3% for AGIs $100k-200k, 1.7% for AGIs over 200k)
Ordinary dividends: $18,121 (reported on 37.2% of returns)
Here:
$18,121
State:
$12,831
(% of AGI for various income ranges: 6.2% for AGIs below $25k, 2.9% for AGIs $25k-50k, 4.1% for AGIs $50k-75k, 2.7% for AGIs $75k-100k, 2.8% for AGIs $100k-200k, 6.2% for AGIs over 200k)
Net capital gain/loss in AGI: +$54,411 (reported on 33.5% of returns)
Here:
+$54,411
State:
+$33,493
(% of AGI for various income ranges: 0.7% for AGIs $25k-50k, 0.9% for AGIs $50k-75k, 1.6% for AGIs $75k-100k, 2.8% for AGIs $100k-200k, 20.9% for AGIs over 200k)
Profit/loss from business: +$21,379 (reported on 18.7% of returns)
Here:
+$21,379
State:
+$10,012
(% of AGI for various income ranges: 7.6% for AGIs below $25k, 4.1% for AGIs $25k-50k, 4.7% for AGIs $50k-75k, 2.4% for AGIs $75k-100k, 3.9% for AGIs $100k-200k, 2.4% for AGIs over 200k)
Taxable individual retirement arrangement distribution: $29,992 (reported on 17.1% of returns)
32561:
$29,992
Florida:
$21,544
(% of AGI for various income ranges: 5.6% for AGIs below $25k, 3.0% for AGIs $25k-50k, 5.1% for AGIs $50k-75k, 4.7% for AGIs $75k-100k, 5.9% for AGIs $100k-200k, 3.0% for AGIs over 200k)
Self-employment retirement plans: $23,100 (reported on 1.2% of returns)
32561:
$23,100
Florida:
$20,611
(% of AGI for various income ranges: 0.3% for AGIs over 200k)
Total itemized deductions: $33,721 (13% of AGI, reported on 41.1% of returns)
Here:
$33,721
State:
$25,533
Here:
13.2% of AGI
State:
18.0% of AGI
(% of AGI for various income ranges: 15.4% for AGIs below $25k, 12.5% for AGIs $25k-50k, 12.7% for AGIs $50k-75k, 13.1% for AGIs $75k-100k, 13.7% for AGIs $100k-200k, 8.6% for AGIs over 200k)
Charity contributions: $8,243 (reported on 35.1% of returns)
Here:
$8,243
State:
$5,698
(% of AGI for various income ranges: 1.1% for AGIs below $25k, 1.4% for AGIs $25k-50k, 1.6% for AGIs $50k-75k, 2.1% for AGIs $75k-100k, 2.4% for AGIs $100k-200k, 2.3% for AGIs over 200k)
Taxes paid: $7,948 (reported on 40.9% of returns)
32561:
$7,948
State:
$6,203
(% of AGI for various income ranges: 2.2% for AGIs below $25k, 2.8% for AGIs $25k-50k, 2.6% for AGIs $50k-75k, 2.8% for AGIs $75k-100k, 3.3% for AGIs $100k-200k, 2.1% for AGIs over 200k)
Earned income credit: $1,689 (reported on 8.3% of returns)
Here:
$1,689
State:
$2,372
(% of AGI for various income ranges: 2.9% for AGIs below $25k, 0.6% for AGIs $25k-50k)
Percentage of individuals using paid preparers for their 2012 taxes: 54.7%
Here:
55%
State:
54%
(% for various income ranges: 45.1% for AGIs below $25k, 45.8% for AGIs $25k-50k, 54.4% for AGIs $50k-75k, 55.8% for AGIs $75k-100k, 60.5% for AGIs $100k-200k, 82.7% for AGIs over 200k)
Averages for the 2004 tax year for zip code 32561, filed in 2005:
Average Adjusted Gross Income (AGI) in 2004: $110,822 (Individual Income Tax Returns)
Here:
$110,822
State:
$50,523
Salary/wage: $66,956 (reported on 72.9% of returns)
Here:
$66,956
State:
$39,563
(% of AGI for various income ranges: 160.6% for AGIs below $10k, 57.7% for AGIs $10k-25k, 62.4% for AGIs $25k-50k, 59.9% for AGIs $50k-75k, 64.6% for AGIs $75k-100k, 37.5% for AGIs over 100k)
Taxable interest for individuals: $4,876 (reported on 61.3% of returns)
This zip code:
$4,876
Florida:
$3,211
(% of AGI for various income ranges: 11.7% for AGIs below $10k, 4.7% for AGIs $10k-25k, 2.7% for AGIs $25k-50k, 2.3% for AGIs $50k-75k, 3.0% for AGIs $75k-100k, 2.6% for AGIs over 100k)
Taxable dividends: $7,589 (reported on 43.5% of returns)
Here:
$7,589
State:
$6,129
(% of AGI for various income ranges: 20.4% for AGIs below $10k, 4.9% for AGIs $10k-25k, 3.4% for AGIs $25k-50k, 2.1% for AGIs $50k-75k, 2.7% for AGIs $75k-100k, 2.9% for AGIs over 100k)
Net capital gain/loss: +$54,093 (reported on 38.3% of returns)
Here:
+$54,093
State:
+$27,205
(% of AGI for various income ranges: -1.1% for AGIs below $10k, 0.7% for AGIs $10k-25k, 1.3% for AGIs $25k-50k, 2.6% for AGIs $50k-75k, 2.1% for AGIs $75k-100k, 24.4% for AGIs over 100k)
Profit/loss from business: +$12,931 (reported on 18.5% of returns)
Here:
+$12,931
State:
+$10,634
(% of AGI for various income ranges: -7.1% for AGIs below $10k, 7.8% for AGIs $10k-25k, 4.2% for AGIs $25k-50k, 3.6% for AGIs $50k-75k, 3.7% for AGIs $75k-100k, 1.5% for AGIs over 100k)
IRA payment deduction: $3,596 (reported on 4.1% of returns)
32561:
$3,596
Florida:
$3,082
(% of AGI for various income ranges: 0.5% for AGIs $10k-25k, 0.5% for AGIs $25k-50k, 0.2% for AGIs $50k-75k, 0.2% for AGIs $75k-100k, 0.1% for AGIs over 100k)
Self-employed pension: $13,584 (reported on 1.9% of returns)
Here:
$13,584
Florida:
$15,857
Total itemized deductions: $44,144 (24% of AGI, reported on 44.1% of returns)
Here:
$44,144
State:
$20,370
Here:
24.3% of AGI
State:
20.7% of AGI
(% of AGI for various income ranges: 60.6% for AGIs below $10k, 16.0% for AGIs $10k-25k, 24.5% for AGIs $25k-50k, 20.7% for AGIs $50k-75k, 25.7% for AGIs $75k-100k, 15.6% for AGIs over 100k)
Charity contributions deductions: $6,345 (3% of AGI, reported on 38.0% of returns)
Here:
$6,345
State:
$4,064
Here:
3.3% of AGI
State:
3.8% of AGI
(% of AGI for various income ranges: 2.5% for AGIs below $10k, 1.5% for AGIs $10k-25k, 2.2% for AGIs $25k-50k, 2.3% for AGIs $50k-75k, 2.7% for AGIs $75k-100k, 2.1% for AGIs over 100k)
Total tax: $24,727 (reported on 79.6% of returns)
32561:
$24,727
State:
$9,431
(% of AGI for various income ranges: 7.8% for AGIs below $10k, 4.6% for AGIs $10k-25k, 7.1% for AGIs $25k-50k, 9.2% for AGIs $50k-75k, 10.0% for AGIs $75k-100k, 20.9% for AGIs over 100k)
Earned income credit: $1,368 (reported on 6.6% of returns)
Here:
$1,368
State:
$1,808
Percentage of individuals using paid preparers for their 2004 taxes: 56.6%
Here:
57%
State:
60%
(% for various income ranges: 48.4% for AGIs below $10k, 53.4% for AGIs $10k-25k, 55.5% for AGIs $25k-50k, 53.4% for AGIs $50k-75k, 52.4% for AGIs $75k-100k, 72.2% for AGIs over 100k)
Household received Food Stamps/SNAP in the past 12 months: 97 Household did not receive Food Stamps/SNAP in the past 12 months: 4,275
Women who had a birth in the past 12 months: 60 (63 now married, 0 unmarried) Women who did not have a birth in the past 12 months: 1,851 (945 now married, 906 unmarried)
Housing units in zip code 32561 with a mortgage: 1,921 (202 second mortgage, 5 home equity loan, 180 both second mortgage and home equity loan) Houses without a mortgage: 13
Median monthly owner costs for units with a mortgage: $2,860 Median monthly owner costs for units without a mortgage: $936
Residents with income below the poverty level in 2022:
This zip code:
4.8%
Whole state:
12.7%
Residents with income below 50% of the poverty level in 2022:
This zip code:
0.8%
Whole state:
6.6%
Median number of rooms in houses and condos:
Here:
6.6
State:
5.9
Median number of rooms in apartments:
Here:
4.9
State:
4.2
Notable locations in this zip code not listed on our city pages
Notable locations in zip code 32561: Dolphin Square (A), United States Department of the Interior Biological Laboratory (B), Gulf Breeze Fire Department (C), Escambia County Fire and Rescue Station 13 (D). Display/hide their locations on the map
Churches in zip code 32561 include: Saint Anns Church (A), Saint Francis Church (B), Evangel Church (C), First Baptist Church (D), Santa Rosa Shores Baptist Church (E), Saint Sylvester Catholic Church (F), Saint Francis of Assisi Episcopal Church (G), Concord Presbyterian Church (H), Gulf Breeze United Methodist Church (I). Display/hide their locations on the map
1,580 married couples with children.
275 single-parent households (275 women).
96.1% of residents of 32561 zip code speak English at home.
1.2% of residents speak Spanish at home (40% very well, 60% well).
1.2% of residents speak other Indo-European language at home (100% very well).
0.9% of residents speak Asian or Pacific Island language at home (45% very well, 55% well).
0.4% of residents speak other language at home (100% very well).
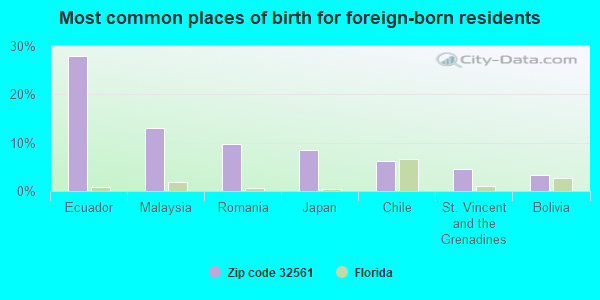
Foreign born population: 486 (5.0%) (98.5% of them are naturalized citizens)
This zip code:
5.0%
Whole state:
21.7%
28%Ecuador
13%Malaysia
10%Romania
9%Japan
6%Chile
4%St. Vincent and the Grenadines
3%Bolivia
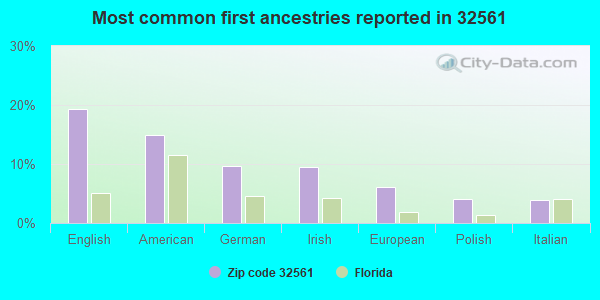
19%English
15%American
10%German
9%Irish
6%European
4%Polish
4%Italian
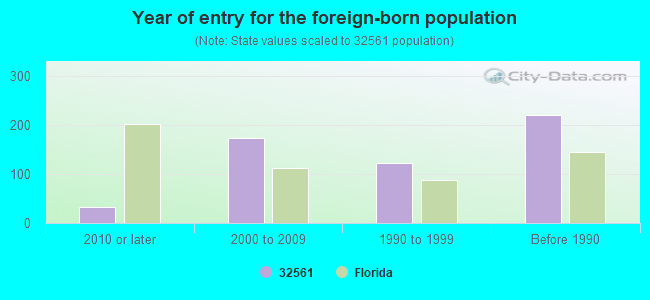
Year of entry for the foreign-born population
322010 or later
1732000 to 2009
1221990 to 1999
221Before 1990
Major facilities with environmental interests located in this zip code:
LONG, PAMELA (VILLA VENICE SUBDIVISION in GULF BREEZE, FL)
(Integrated Compliance Information System) - ICIS-04-2006-5753, ENFORCEMENT/COMPLIANCE ACTIVITY FORMAL ENFORCEMENT ACTION (Integrated Compliance Information System) - ICIS-04-2006-5753, ENFORCEMENT/COMPLIANCE ACTIVITY Alternative names: PAM LOY
GULF BREEZE HIGH SCHOOL (675 GULF BREEZE PARKWAY in GULF BREEZE, FL)
(National Center for Education Statistics) - STATE ID-0103 (Resource Conservation and Recovery Act (tracking hazardous waste)) Organizations: TONY GOMILLION, DIR (CONTACT/OWNER)
, SANTA ROSA COUNTY SCHOOL DISTRICT (SCHOOL DISTRICT)
Alternative names: SANTA ROSA CO GULF BREEZE HIGH
GULF BREEZE ELEMENTARY SCHOOL (549 GULF BREEZE PARKWAY in GULF BREEZE, FL)
(Geographic Names Information System) (National Center for Education Statistics) - STATE ID-0101 Organizations: SANTA ROSA COUNTY SCHOOL DISTRICT (SCHOOL DISTRICT)
ORIOLE BEACH ELEMENTARY SCHOOL (1260 ORIOLE BEACH RD in GULF BREEZE, FL)
(Geographic Names Information System) (National Center for Education Statistics) - STATE ID-0311 Organizations: SANTA ROSA COUNTY SCHOOL DISTRICT (SCHOOL DISTRICT)
GULF BREEZE MIDDLE SCHOOL (649 GULF BREEZE PARKWAY in GULF BREEZE, FL)
(National Center for Education Statistics) - STATE ID-0102 Organizations: SANTA ROSA COUNTY SCHOOL DISTRICT (SCHOOL DISTRICT)
PENSACOLA BEACH CHARTER SCHOOL (900 VIA DELUNA DR in PENSACOLA BEACH, FL)
(National Center for Education Statistics) - STATE ID-2108 Organizations: ESCAMBIA COUNTY SCHOOL DISTRICT (SCHOOL DISTRICT)
PENSACOLA BEACH ELEMENTARY SCHOOL (INACTI (900 VIA DE LUNA DR in PENSACOLA BEACH, FL)
(National Center for Education Statistics) - STATE ID-0931 Organizations: ESCAMBIA COUNTY SCHOOL DISTRICT (SCHOOL DISTRICT)
GULF ISLANDS NS (1801 GULF BREEZE PAR in GULF BREEZE, FL)
(Integrated Compliance Information System) - ICIS-04-1994-0374, FORMAL ENFORCEMENT ACTION
ANDREWS INSTITUTE (GULF BREEZE PKWY in GULF BREEZE, FL)
National Pollutant Discharge Elimination System NON-MAJOR (Tracking pollutant discharge elimination systems) - permit Organizations: JOHN PORTER (CONTACT/OWNER)
National Pollutant Discharge Elimination System NON-MAJOR (Tracking pollutant discharge elimination systems) - permit Organizations: JOHN PORTER (CONTACT/OWNER)
LIGHTHOUSE POINTE' UNIT NO. 5 (OLD HARBOR COVE AND WINDING SH in GULF BREEZE, FL)
National Pollutant Discharge Elimination System NON-MAJOR (Tracking pollutant discharge elimination systems) - permit Organizations: RONALD TUTTLE (CONTACT/OWNER)
SHADOW LAKES UNIT NO 3 (FAWN RIDGE DR in GULF BREEZE, FL)
National Pollutant Discharge Elimination System NON-MAJOR (Tracking pollutant discharge elimination systems) - permit Organizations: MICHAEL SABA (CONTACT/OWNER)
Housing units lacking complete kitchen facilities: 2.9%
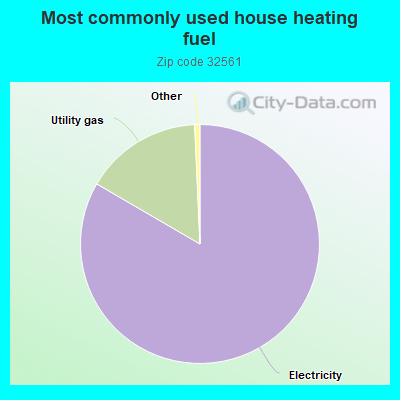
83.4%Electricity
15.9%Utility gas
Population in 1990: 27,875.
Place of birth for U.S.-born residents:
This state: 2,878
Northeast: 1,160
Midwest: 1,180
South: 3,098
West: 831
51% of the 32561 zip code residents lived in the same house 5 years ago. Out of people who lived in different houses, 32% lived in this county. Out of people who lived in different counties, 50% lived in Florida.
90% of the 32561 zip code residents lived in the same house 1 year ago. Out of people who lived in different houses, 20% moved from this county. Out of people who lived in different houses, 45% moved from different county within same state. Out of people who lived in different houses, 37% moved from different state. Out of people who lived in different houses, 2% moved from abroad.
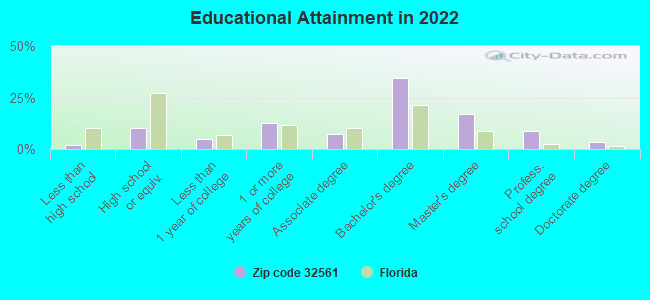
Private vs. public school enrollment:
Students in private schools in grades 1 to 8 (elementary and middle school): 178
Here:
23.8%
Florida:
15.8%
Students in private schools in grades 9 to 12 (high school): 44
Here:
6.4%
Florida:
12.9%
Students in private undergraduate colleges:
Here:
0.0%
Florida:
23.6%
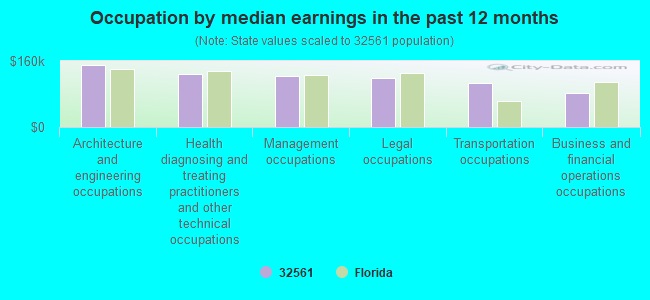
Occupation by median earnings in the past 12 months ($)
150,865Architecture and engineering occupations
127,345Health diagnosing and treating practitioners and other technical occupations
122,840Management occupations
117,650Legal occupations
106,494Transportation occupations
81,225Business and financial operations occupations
Companies with biggest federal contracts located in this zip code:
EPOCH SOFTWARE SYSTEMS INC (913 GULF BREEZE PKWY in GULF BREEZE, FL; small business) : $9,759,855 in 47 contractsfrom 1999 to 2006
Contracts for Systems Engineering Services, Maintenance, Repair and Rebuilding of Equipment -- Automatic Data Processing Equipment (Including Firmware), Software, Supplies and Support Equipment by Air Force Signed by year:2000: $424,155; 2001: $1,796,340; 2002: $2,768,587; 2003: $1,356,564; 2004: $1,292,474; 2005: $1,540,614; 2006: $416,155.
Biggest contracts:
$985,117 with Air Force for Systems Engineering Services. Signed on 2002-02-22. Completion date: 2002-12-31.
$926,918, same as above.Signed on 2002-12-20. Completion date: 2004-01-25.
$624,392, same as above.Signed on 2001-03-29. Completion date: 2001-12-31.
$417,487, same as above.Signed on 2004-10-01. Completion date: 2005-09-30.
A C M E , INC (1643 KAUAI COURT in GULF BREEZE, FL; small business) : $1,169,256 in 59 contractsfrom 1999 to 2005
Contracts for Maintenance, Repair or Alteration of Real Property -- Family Housing Facilities, Maintenance, Repair or Alteration of Real Property -- Office Buildings, Construction of Structures and Facilities -- Family Housing Facilities by Navy Signed by year:2000: $0; 2001: $79,415; 2002: $593,780; 2003: $437,839; 2004: $377,335; 2005: -$200,000; 2006: $0.
Biggest contracts:
$250,000 with Navy for Maintenance, Repair or Alteration of Real Property -- Family Housing Facilities. Signed on 2004-05-04. Completion date: 2004-09-30.
$164,965, same as above.Signed on 2002-10-17. Completion date: 2002-12-31.
$154,275, same as above.Signed on 2002-12-31. Completion date: 2003-03-31.
$130,000, same as above.Signed on 2004-02-12. Completion date: 2004-09-30.
DAVID D MCGEHEE (107 ARIOLA DRIVE in GULF BREEZE, FL; small business) : $139,470 in 7 contractsfrom 2001 to 2005
Contracts for Architect - Engineer Services (including landscaping, interior layout, and designing), Engineering and Technical Services, Other Architect and Engineering Services by U.S. Army Corps of Engineers - civil program financing only, Army Signed by year:2000: $0; 2001: $44,500; 2002: $46,970; 2003: $0; 2004: $0; 2005: $48,000; 2006: $0.
Biggest contracts:
$44,500 with U.S. Army Corps of Engineers - civil program financing only for Architect - Engineer Services (including landscaping, interior layout, and designing). Taking place in CA. Signed on 2001-07-20. Completion date: 2001-12-15.
$34,870, same as above.Signed on 2002-09-20. Completion date: 2003-01-30.
$24,000 with U.S. Army Corps of Engineers - civil program financing only for Engineering and Technical Services. Taking place in LA. Signed on 2005-09-28. Completion date: 2005-09-30.
$24,000 with Army for Engineering and Technical Services. Taking place in LA. Signed on 2005-09-28. Completion date: 2005-09-30.
STUDER GROUP, LLC, THE (913 GULF BREEZE PARKWAY, S in GULF BREEZE, FL; small business) : $68,303 in 3 contractsfrom 2005 to 2006
$61,800 with Navy for Other Education and Training Services. Signed on 2005-03-01. Completion date: 2005-03-30.
$6,505 with Army for Training Aids. Signed on 2005-09-29. Completion date: 2005-10-10.
-$2, same as above.Signed on 2006-03-03. Completion date: 2005-10-10.
MOTOROLA, INC. (1101 GULF BREEZE PKWY in GULF BREEZE, FL)
$53,981 with Navy for Radio and Television Communication Equipment, Except Airborne. Taking place in MD. Signed on 2000-09-11. Completion date: 2000-12-29.
SUNRISE HOSPITALITY OF PENSACO (14 VIA DE LUNA DRIVE in PENSACOLA BEAC, FL) : $48,101 in 2 contractsfrom 2001 to 2004
$26,000 with Office of Justice Programs for Program Management/Support Services. Signed on 2001-09-15. Completion date: 2001-09-15.
$22,101 with Army for Lodging - Hotel/Motel. Signed on 2004-08-21. Completion date: 2004-09-12.
SEPARATION SYSTEMS INC (100 NIGHTINGALE LN STE A in GULF BREEZE, FL; small business)
$38,005 with Army for Other Defense -- Applied Research and Exploratory Development (R&D). Signed on 2000-09-21. Completion date: 2000-10-31.
PANHANDLE SUPPLY, INC (116B MCCLURE DRIVE in GULF BREEZE, FL; small business)
$26,352 with Navy for Harvesting Equipment. Signed on 2004-09-30. Completion date: 2004-10-14.
MOTION MAKER INC (1403 MALDONADO DR in GULF BREEZE, FL; small business) : $16,575 in 2 contractsfrom 2002 to 2005
$9,075 with Federal Technology Service for ADP Components. Signed on 2002-11-15. Completion date: 2002-11-15.
$7,500 with Navy for Film/Video Tape Production Services. Signed on 2005-01-06. Completion date: 2005-02-28.
SAMS, JEAN (1801 GULF BREEZE PKWY #C 4 in GULF BREEZE, FL; small business)
$12,485 with U.S. Army Corps of Engineers - civil program financing only for Guard Services. Signed on 2002-10-24. Completion date: 2003-09-30.
Top industries in this zip code by the number of employees in 2005:
2002 - 2018 National Fire Incident Reporting System (NFIRS) incidents
Based on the data from the years 2002 - 2018 the average number of fire incidents per year is 83. The highest number of reported fire incidents - 224 took place in 2006, and the least - 21 in 2017. The data has a growing trend.
When looking into fire subcategories, the most reports belonged to: Outside Fires (42.6%), and Structure Fires (30.1%).
Fire incident types reported to NFIRS in Zip Code 32561


 Nearest zip codes: 32563, 32502, 32501, 32504, 32503, 32505.


 Based on the data from the years 2002 - 2018 the average number of fire incidents per year is 83. The highest number of reported fire incidents - 224 took place in 2006, and the least - 21 in 2017. The data has a growing trend.
 When looking into fire subcategories, the most reports belonged to: Outside Fires (42.6%), and Structure Fires (30.1%).