Estimated zip code population in 2022: 15,651 Zip code population in 2010: 15,447 Zip code population in 2000: 17,199
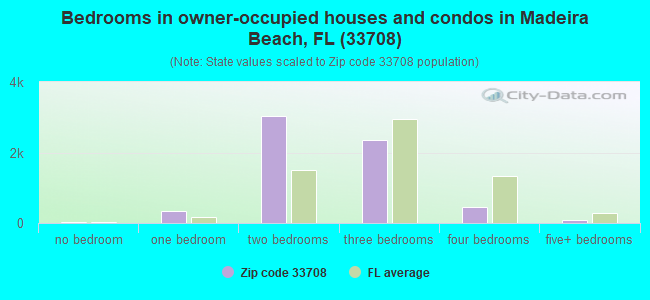
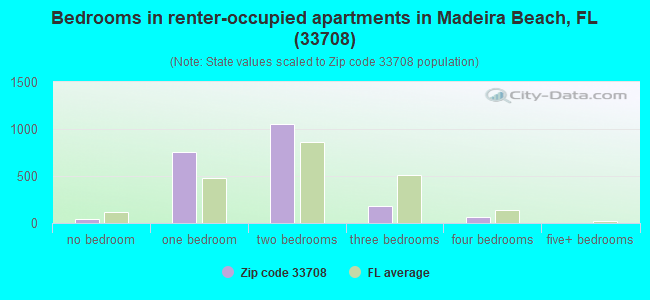
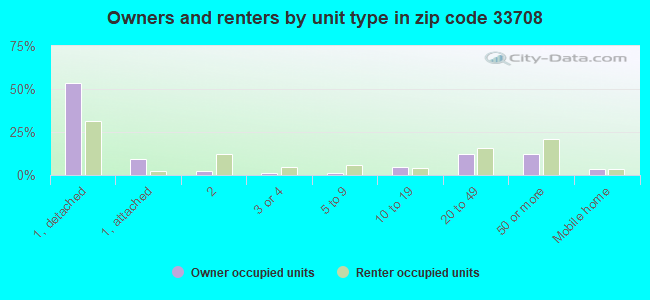
Houses and condos: 13,935 Renter-occupied apartments: 2,104
% of renters here:
25%
State:
33%
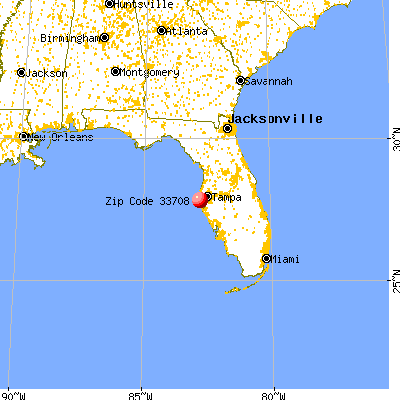
March 2022 cost of living index in zip code 33708: 102.0 (near average, U.S. average is 100)
Land area: 3.4 sq. mi. Water area: 4.7 sq. mi.
Population density: 4,588 people per square mile
(average).
OSM Map
General Map
Google Map
MSN Map
OSM Map
General Map
Google Map
MSN Map
OSM Map
General Map
Google Map
MSN Map
OSM Map
General Map
Google Map
MSN Map
Please wait while loading the map...
Real estate property taxes paid for housing units in 2022:
This zip code:
0.6% ($3,393)
Florida:
0.7% ($2,529)
Median real estate property taxes paid for housing units with mortgages in 2022: $3,623 (0.6%) Median real estate property taxes paid for housing units with no mortgage in 2022: $3,104 (0.6%)
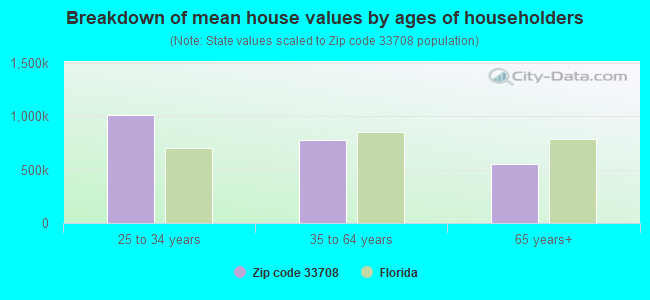
Estimated median house/condo value in 2022: $537,694
33708:
$537,694
Florida:
$354,100
According to our research of Florida and other state lists, there were 15 registered sex offenders living in 33708 zip code as of April 27, 2024. The ratio of all residents to sex offenders in zip code 33708 is 1,095 to 1. The ratio of registered sex offenders to all residents in this zip code is lower than the state average.
Median resident age:
This zip code:
61.0 years
Florida median age:
42.7 years
Average household size:
This zip code:
1.9 people
Florida:
2.5 people
Averages for the 2020 tax year for zip code 33708, filed in 2021:
Average Adjusted Gross Income (AGI) in 2020: $117,044 (Individual Income Tax Returns)
Here:
$117,044
State:
$82,200
Salary/wage: $86,294 (reported on 64.8% of returns)
Here:
$86,294
State:
$58,347
(% of AGI for various income ranges: 1095.3% for AGIs below $25k, 3110.6% for AGIs $25k-50k, 5418.0% for AGIs $50k-75k, 8134.7% for AGIs $75k-100k, 14894.0% for AGIs $100k-200k, 91295.8% for AGIs over 200k)
Taxable interest for individuals: $3,286 (reported on 45.3% of returns)
This zip code:
$3,286
Florida:
$4,272
(% of AGI for various income ranges: 49.1% for AGIs below $25k, 89.4% for AGIs $25k-50k, 167.8% for AGIs $50k-75k, 234.4% for AGIs $75k-100k, 369.6% for AGIs $100k-200k, 2275.8% for AGIs over 200k)
Ordinary dividends: $12,295 (reported on 37.1% of returns)
Here:
$12,295
State:
$15,863
(% of AGI for various income ranges: 80.1% for AGIs below $25k, 166.2% for AGIs $25k-50k, 378.4% for AGIs $50k-75k, 652.7% for AGIs $75k-100k, 1043.6% for AGIs $100k-200k, 8598.1% for AGIs over 200k)
Net capital gain/loss in AGI: +$52,762 (reported on 35.1% of returns)
Here:
+$52,762
State:
+$62,983
(% of AGI for various income ranges: 43.0% for AGIs below $25k, 110.3% for AGIs $25k-50k, 373.9% for AGIs $50k-75k, 704.4% for AGIs $75k-100k, 1966.4% for AGIs $100k-200k, 52199.2% for AGIs over 200k)
Profit/loss from business: +$21,971 (reported on 16.7% of returns)
Here:
+$21,971
State:
+$9,719
(% of AGI for various income ranges: 183.4% for AGIs below $25k, 246.1% for AGIs $25k-50k, 203.5% for AGIs $50k-75k, 459.8% for AGIs $75k-100k, 796.5% for AGIs $100k-200k, 6314.2% for AGIs over 200k)
Taxable individual retirement arrangement distribution: $28,252 (reported on 19.0% of returns)
33708:
$28,252
Florida:
$24,823
(% of AGI for various income ranges: 167.4% for AGIs below $25k, 307.5% for AGIs $25k-50k, 594.7% for AGIs $50k-75k, 1169.8% for AGIs $75k-100k, 1928.8% for AGIs $100k-200k, 6041.2% for AGIs over 200k)
Self-employed (Keogh) retirement plans: $31,425 (reported on 0.9% of returns)
33708:
$31,425
Florida:
$29,694
(% of AGI for various income ranges: 96.2% for AGIs $75k-100k, 800.4% for AGIs over 200k)
Total itemized deductions: $42,309 (reported on 12.5% of returns)
Here:
$42,309
State:
$45,393
(% of AGI for various income ranges: 130.1% for AGIs below $25k, 191.5% for AGIs $25k-50k, 436.2% for AGIs $50k-75k, 625.8% for AGIs $75k-100k, 1464.8% for AGIs $100k-200k, 9299.2% for AGIs over 200k)
Charity contributions: $12,929 (reported on 10.2% of returns)
Here:
$12,929
State:
$20,178
(% of AGI for various income ranges: 5.0% for AGIs below $25k, 17.8% for AGIs $25k-50k, 52.4% for AGIs $50k-75k, 69.6% for AGIs $75k-100k, 252.0% for AGIs $100k-200k, 3223.1% for AGIs over 200k)
Taxes paid: $7,560 (reported on 12.4% of returns)
33708:
$7,560
State:
$6,967
(% of AGI for various income ranges: 22.4% for AGIs below $25k, 38.2% for AGIs $25k-50k, 85.5% for AGIs $50k-75k, 139.3% for AGIs $75k-100k, 325.2% for AGIs $100k-200k, 1367.3% for AGIs over 200k)
Earned income credit: $1,402 (reported on 7.6% of returns)
Here:
$1,402
State:
$2,306
(% of AGI for various income ranges: 46.0% for AGIs below $25k, 22.0% for AGIs $25k-50k)
Percentage of individuals using paid preparers for their 2020 taxes: 91.2%
Here:
91%
State:
92%
(% for various income ranges: 89.7% for AGIs below $25k, 92.1% for AGIs $25k-50k, 90.9% for AGIs $50k-75k, 90.8% for AGIs $75k-100k, 91.6% for AGIs $100k-200k, 93.6% for AGIs over 200k)
Averages for the 2012 tax year for zip code 33708, filed in 2013:
Average Adjusted Gross Income (AGI) in 2012: $84,177 (Individual Income Tax Returns)
Here:
$84,177
State:
$60,316
Salary/wage: $67,166 (reported on 67.4% of returns)
Here:
$67,166
State:
$45,277
(% of AGI for various income ranges: 59.3% for AGIs below $25k, 62.0% for AGIs $25k-50k, 55.0% for AGIs $50k-75k, 54.0% for AGIs $75k-100k, 55.1% for AGIs $100k-200k, 50.5% for AGIs over 200k)
Taxable interest for individuals: $3,496 (reported on 47.5% of returns)
This zip code:
$3,496
Florida:
$3,587
(% of AGI for various income ranges: 3.3% for AGIs below $25k, 2.3% for AGIs $25k-50k, 2.0% for AGIs $50k-75k, 1.8% for AGIs $75k-100k, 2.1% for AGIs $100k-200k, 1.7% for AGIs over 200k)
Ordinary dividends: $9,357 (reported on 34.4% of returns)
Here:
$9,357
State:
$12,831
(% of AGI for various income ranges: 5.8% for AGIs below $25k, 3.3% for AGIs $25k-50k, 3.1% for AGIs $50k-75k, 3.5% for AGIs $75k-100k, 3.8% for AGIs $100k-200k, 4.0% for AGIs over 200k)
Net capital gain/loss in AGI: +$28,141 (reported on 30.6% of returns)
Here:
+$28,141
State:
+$33,493
(% of AGI for various income ranges: 0.3% for AGIs $25k-50k, 1.2% for AGIs $50k-75k, 1.7% for AGIs $75k-100k, 3.5% for AGIs $100k-200k, 20.6% for AGIs over 200k)
Profit/loss from business: +$19,078 (reported on 14.9% of returns)
Here:
+$19,078
State:
+$10,012
(% of AGI for various income ranges: 6.9% for AGIs below $25k, 3.8% for AGIs $25k-50k, 2.3% for AGIs $50k-75k, 2.6% for AGIs $75k-100k, 3.2% for AGIs $100k-200k, 3.3% for AGIs over 200k)
Taxable individual retirement arrangement distribution: $18,469 (reported on 20.4% of returns)
33708:
$18,469
Florida:
$21,544
(% of AGI for various income ranges: 7.0% for AGIs below $25k, 5.3% for AGIs $25k-50k, 5.9% for AGIs $50k-75k, 6.0% for AGIs $75k-100k, 7.7% for AGIs $100k-200k, 2.0% for AGIs over 200k)
Self-employment retirement plans: $22,960 (reported on 0.6% of returns)
33708:
$22,960
Florida:
$20,611
Total itemized deductions: $26,482 (16% of AGI, reported on 33.9% of returns)
Here:
$26,482
State:
$25,533
Here:
15.6% of AGI
State:
18.0% of AGI
(% of AGI for various income ranges: 17.9% for AGIs below $25k, 12.0% for AGIs $25k-50k, 12.9% for AGIs $50k-75k, 11.9% for AGIs $75k-100k, 12.4% for AGIs $100k-200k, 7.9% for AGIs over 200k)
Charity contributions: $5,004 (reported on 27.1% of returns)
Here:
$5,004
State:
$5,698
(% of AGI for various income ranges: 1.0% for AGIs below $25k, 0.9% for AGIs $25k-50k, 1.4% for AGIs $50k-75k, 1.4% for AGIs $75k-100k, 1.6% for AGIs $100k-200k, 1.9% for AGIs over 200k)
Taxes paid: $7,777 (reported on 33.2% of returns)
33708:
$7,777
State:
$6,203
(% of AGI for various income ranges: 3.2% for AGIs below $25k, 2.7% for AGIs $25k-50k, 3.1% for AGIs $50k-75k, 3.0% for AGIs $75k-100k, 3.6% for AGIs $100k-200k, 2.9% for AGIs over 200k)
Earned income credit: $1,462 (reported on 9.6% of returns)
Here:
$1,462
State:
$2,372
(% of AGI for various income ranges: 2.7% for AGIs below $25k, 0.3% for AGIs $25k-50k)
Percentage of individuals using paid preparers for their 2012 taxes: 52.7%
Here:
53%
State:
54%
(% for various income ranges: 46.7% for AGIs below $25k, 46.8% for AGIs $25k-50k, 54.1% for AGIs $50k-75k, 55.1% for AGIs $75k-100k, 64.9% for AGIs $100k-200k, 79.5% for AGIs over 200k)
Averages for the 2004 tax year for zip code 33708, filed in 2005:
Average Adjusted Gross Income (AGI) in 2004: $60,134 (Individual Income Tax Returns)
Here:
$60,134
State:
$50,523
Salary/wage: $44,922 (reported on 67.1% of returns)
Here:
$44,922
State:
$39,563
(% of AGI for various income ranges: 162.4% for AGIs below $10k, 57.4% for AGIs $10k-25k, 61.5% for AGIs $25k-50k, 57.7% for AGIs $50k-75k, 60.7% for AGIs $75k-100k, 40.4% for AGIs over 100k)
Taxable interest for individuals: $3,811 (reported on 60.2% of returns)
This zip code:
$3,811
Florida:
$3,211
(% of AGI for various income ranges: 21.3% for AGIs below $10k, 6.2% for AGIs $10k-25k, 4.4% for AGIs $25k-50k, 3.8% for AGIs $50k-75k, 3.3% for AGIs $75k-100k, 3.2% for AGIs over 100k)
Taxable dividends: $5,049 (reported on 39.8% of returns)
Here:
$5,049
State:
$6,129
(% of AGI for various income ranges: 20.4% for AGIs below $10k, 4.4% for AGIs $10k-25k, 3.2% for AGIs $25k-50k, 3.8% for AGIs $50k-75k, 2.9% for AGIs $75k-100k, 3.0% for AGIs over 100k)
Net capital gain/loss: +$24,632 (reported on 35.9% of returns)
Here:
+$24,632
State:
+$27,205
(% of AGI for various income ranges: -3.4% for AGIs below $10k, -0.2% for AGIs $10k-25k, 1.2% for AGIs $25k-50k, 2.5% for AGIs $50k-75k, 2.7% for AGIs $75k-100k, 26.3% for AGIs over 100k)
Profit/loss from business: +$11,690 (reported on 14.6% of returns)
Here:
+$11,690
State:
+$10,634
(% of AGI for various income ranges: 7.7% for AGIs below $10k, 4.9% for AGIs $10k-25k, 3.7% for AGIs $25k-50k, 1.7% for AGIs $50k-75k, 2.9% for AGIs $75k-100k, 2.5% for AGIs over 100k)
IRA payment deduction: $3,181 (reported on 3.9% of returns)
33708:
$3,181
Florida:
$3,082
(% of AGI for various income ranges: 0.8% for AGIs below $10k, 0.3% for AGIs $10k-25k, 0.4% for AGIs $25k-50k, 0.3% for AGIs $50k-75k, 0.2% for AGIs $75k-100k, 0.1% for AGIs over 100k)
Self-employed pension: $13,610 (reported on 0.7% of returns)
Here:
$13,610
Florida:
$15,857
Total itemized deductions: $20,391 (19% of AGI, reported on 37.3% of returns)
Here:
$20,391
State:
$20,370
Here:
19.2% of AGI
State:
20.7% of AGI
(% of AGI for various income ranges: 53.9% for AGIs below $10k, 14.9% for AGIs $10k-25k, 14.5% for AGIs $25k-50k, 14.9% for AGIs $50k-75k, 15.9% for AGIs $75k-100k, 10.0% for AGIs over 100k)
Charity contributions deductions: $4,305 (4% of AGI, reported on 31.5% of returns)
Here:
$4,305
State:
$4,064
Here:
3.7% of AGI
State:
3.8% of AGI
(% of AGI for various income ranges: 2.4% for AGIs below $10k, 1.3% for AGIs $10k-25k, 1.3% for AGIs $25k-50k, 1.7% for AGIs $50k-75k, 2.1% for AGIs $75k-100k, 2.8% for AGIs over 100k)
Total tax: $10,999 (reported on 80.2% of returns)
33708:
$10,999
State:
$9,431
(% of AGI for various income ranges: 5.7% for AGIs below $10k, 4.5% for AGIs $10k-25k, 8.0% for AGIs $25k-50k, 10.0% for AGIs $50k-75k, 11.6% for AGIs $75k-100k, 19.8% for AGIs over 100k)
Earned income credit: $1,153 (reported on 7.8% of returns)
Here:
$1,153
State:
$1,808
Percentage of individuals using paid preparers for their 2004 taxes: 60.4%
Here:
60%
State:
60%
(% for various income ranges: 57.7% for AGIs below $10k, 59.0% for AGIs $10k-25k, 55.5% for AGIs $25k-50k, 63.7% for AGIs $50k-75k, 60.8% for AGIs $75k-100k, 72.9% for AGIs over 100k)
Likely homosexual households (counted as self-reported same-sex unmarried-partner households)
Lesbian couples: 0.4% of all households
Gay men: 0.3% of all households
Household received Food Stamps/SNAP in the past 12 months: 255 Household did not receive Food Stamps/SNAP in the past 12 months: 8,225
Women who had a birth in the past 12 months: 58 (61 now married, 0 unmarried) Women who did not have a birth in the past 12 months: 1,632 (778 now married, 854 unmarried)
Housing units in zip code 33708 with a mortgage: 3,010 (324 second mortgage, 2 home equity loan, 292 both second mortgage and home equity loan) Houses without a mortgage: 186
Median monthly owner costs for units with a mortgage: $2,203 Median monthly owner costs for units without a mortgage: $914
Residents with income below the poverty level in 2022:
This zip code:
6.6%
Whole state:
12.7%
Residents with income below 50% of the poverty level in 2022:
This zip code:
3.3%
Whole state:
6.6%
Median number of rooms in houses and condos:
Here:
5.4
State:
5.9
Median number of rooms in apartments:
Here:
4.0
State:
4.2
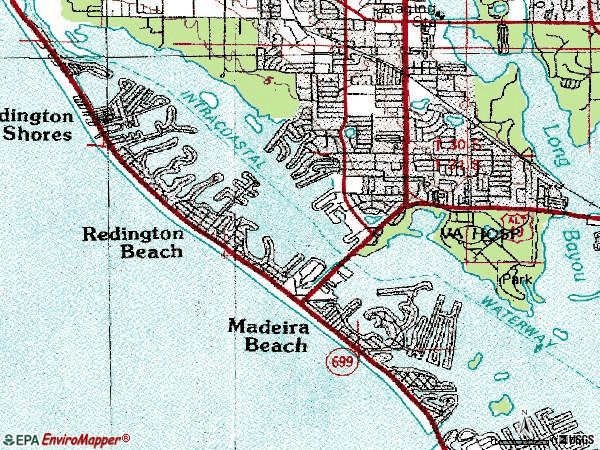
Notable locations in this zip code not listed on our city pages
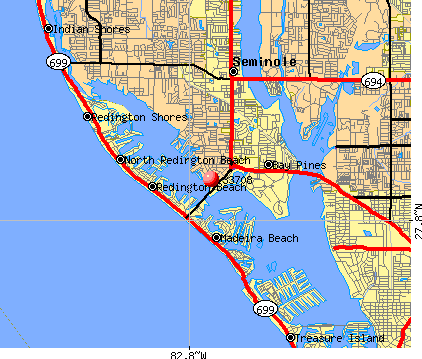
Parks in zip code 33708 include: Constitution Park (1), Del Bello Park (2), Thelma Spitzer Park (3), Rosselli Park (4), Veterans Memorial Park (5), War Veterans Park (6), Medeira Beach Access (7), Tom and Kitty Stuart Park (8), Town Park (9). Display/hide their locations on the map
Tourist attraction (not listed on the city page) : Excell Tropical Realty Inc. (Recreation Areas; 14955 Gulf Boulevard).
830 married couples with children.
167 single-parent households (81 men, 86 women).
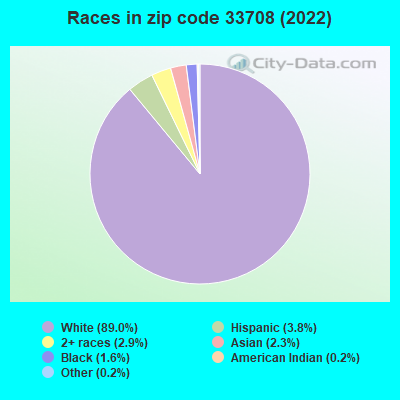
90.7% of residents of 33708 zip code speak English at home.
3.0% of residents speak Spanish at home (84% very well, 13% well, 3% not well).
4.2% of residents speak other Indo-European language at home (65% very well, 18% well, 13% not well, 4% not at all).
1.5% of residents speak Asian or Pacific Island language at home (91% very well, 7% well, 2% not well).
1.0% of residents speak other language at home (52% very well, 48% well).
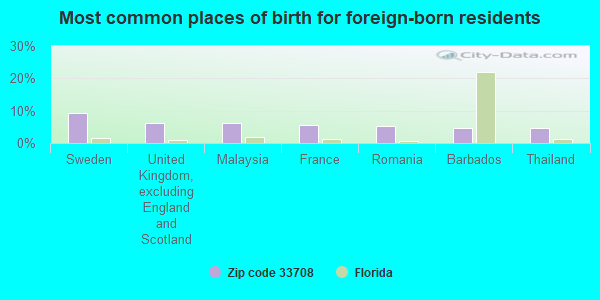
Foreign born population: 1,394 (8.9%) (68.9% of them are naturalized citizens)
This zip code:
8.9%
Whole state:
21.7%
9%Sweden
6%United Kingdom, excluding England and Scotland
6%Malaysia
6%France
5%Romania
5%Barbados
5%Thailand
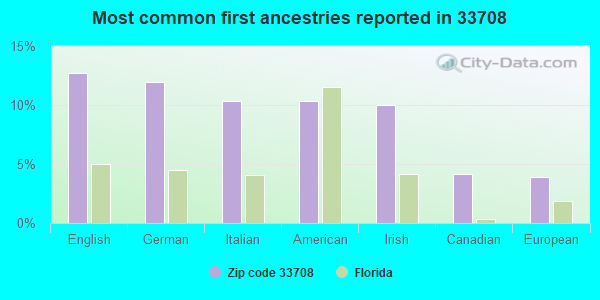
13%English
12%German
10%Italian
10%American
10%Irish
4%Canadian
4%European
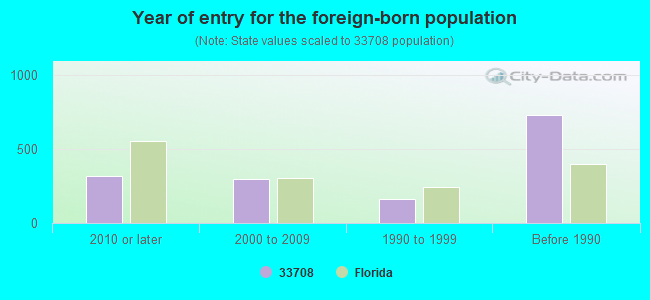
Year of entry for the foreign-born population
3172010 or later
2952000 to 2009
1601990 to 1999
731Before 1990
Major facilities with environmental interests located in this zip code:
APF INDUSTRIES INC (4800 95TH ST N in SAINT PETERSBURG, FL)
SUPERFUND (Superfund database) (Integrated Compliance Information System) - ICIS-04-1998-0052, FORMAL ENFORCEMENT ACTION (Resource Conservation and Recovery Act (tracking hazardous waste)) Business SIC and NAICS classification: ELECTROPLATING, PLATING, POLISHING, ANODIZING, AND COLORING Organizations: STEVE CORRADO (CONTACT/OWNER)
MADEIRA BEACH ELEMENTARY SCHOOL (749 MADEIRA BEACH CSWAY in MADEIRA BEACH, FL)
(Geographic Names Information System) (National Center for Education Statistics) - STATE ID-2251 Organizations: PINELLAS COUNTY SCHOOL DISTRICT (SCHOOL DISTRICT)
MADEIRA BEACH MIDDLE SCHOOL (591 MADEIRA BEACH CSWAY in MADEIRA BEACH, FL)
(Geographic Names Information System) (National Center for Education Statistics) - STATE ID-2261 Organizations: PINELLAS COUNTY SCHOOL DISTRICT (SCHOOL DISTRICT)
PHASE 1 STORMWATER MANAGEMENT (175TH AVE E TO 174TH AVE E in REDINGTON SHORES, FL)
National Pollutant Discharge Elimination System NON-MAJOR (Tracking pollutant discharge elimination systems) - permit Organizations: MIKE NADEAU (CONTACT/OWNER)
PHASE 5 STORMWATER MANAGEMENT (176TH AVE TO 183RD TER in REDINGTON SHORES, FL)
National Pollutant Discharge Elimination System NON-MAJOR (Tracking pollutant discharge elimination systems) - permit Organizations: MIKE NADEAU (CONTACT/OWNER)
ADVANCED & EMERGING TECHNOLOGIES (4855 110TH ST N in ST PETERSBURG, FL)
(Resource Conservation and Recovery Act (tracking hazardous waste)) Organizations: CHARLES FLEER, PRES (CONTACT/OWNER)
KTL TRUCKING (216 176TH AVE in REDINGTON SHORES, FL)
(Resource Conservation and Recovery Act (tracking hazardous waste)) Organizations: NON NOTIFIER (CONTACT/OWNER)
MOBIL OIL CORP SS# DLW (17425 GULF BLVD in REDINGTON SHORES, FL)
(Resource Conservation and Recovery Act (tracking hazardous waste)) Organizations: DAN HORTON (CONTACT/OWNER)
P B & S CHEMICAL CO (4685 95TH STREET NORTH in ST PETERSBURG, FL)
National Pollutant Discharge Elimination System NON-MAJOR (Tracking pollutant discharge elimination systems) - permit Organizations: BOB LYONS (CONTACT/OWNER)
BLUE RIBBON CLEANERS (13435 GULF BLVD in MADEIRA BEACH, FL)
(Resource Conservation and Recovery Act (tracking hazardous waste)) Organizations: LEE TRADOR (CONTACT/OWNER)
SEARS SERVICE CENTER (4600 PARK ST in ST PETERSBURG, FL)
(Resource Conservation and Recovery Act (tracking hazardous waste)) Organizations: MIKE CLAWSER, SUPPORT MGR (CONTACT/OWNER)
SERENO (15208 GULF BLVD in MADEIRA BEACH, FL)
National Pollutant Discharge Elimination System NON-MAJOR (Tracking pollutant discharge elimination systems) - permit Organizations: THOMAS TOSI (CONTACT/OWNER)
Housing units lacking complete plumbing facilities: 1.0% Housing units lacking complete kitchen facilities: 1.7%
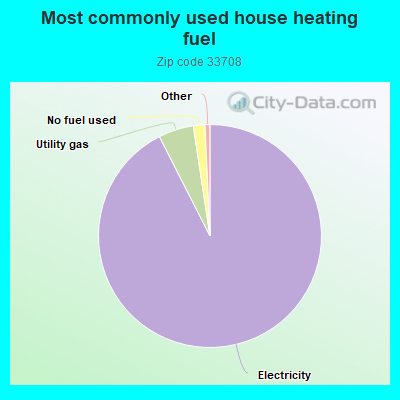
92.6%Electricity
5.1%Utility gas
1.7%No fuel used
Population in 1990: 18,018.
Place of birth for U.S.-born residents:
This state: 2,556
Northeast: 4,524
Midwest: 4,345
South: 1,961
West: 706
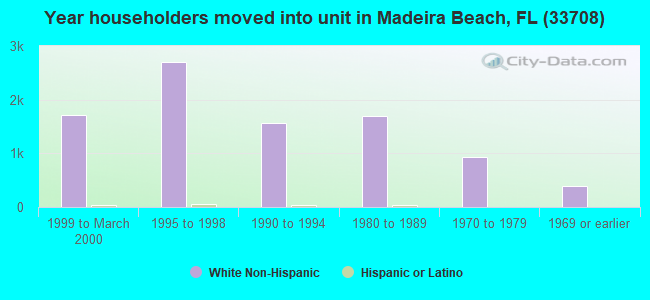
53% of the 33708 zip code residents lived in the same house 5 years ago. Out of people who lived in different houses, 50% lived in this county. Out of people who lived in different counties, 50% lived in Florida.
83% of the 33708 zip code residents lived in the same house 1 year ago. Out of people who lived in different houses, 31% moved from this county. Out of people who lived in different houses, 7% moved from different county within same state. Out of people who lived in different houses, 60% moved from different state. Out of people who lived in different houses, 6% moved from abroad.
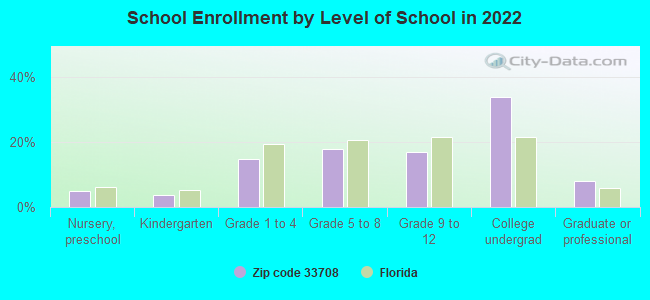
Private vs. public school enrollment:
Students in private schools in grades 1 to 8 (elementary and middle school): 128
Here:
21.6%
Florida:
15.8%
Students in private schools in grades 9 to 12 (high school): 79
Here:
25.8%
Florida:
12.9%
Students in private undergraduate colleges: 220
Here:
35.8%
Florida:
23.6%
Occupation by median earnings in the past 12 months ($)
157,776Life, physical, and social science occupations
122,581Computer and mathematical occupations
94,048Health diagnosing and treating practitioners and other technical occupations
91,328Architecture and engineering occupations
88,443Legal occupations
85,425Law enforcement workers including supervisors
Companies with federal contracts located in this zip code:
SYSNETICS (INC) (150 153RD AVE STE 300B in SAINT PETERSBU, FL; small business)
$103,180 with Army for Programming Services. Taking place in VA. Signed on 2000-09-12. Completion date: 2001-07-31.
NORTH REDINGTON BEACH ASSOCIAT (17120 GULF BLVD in SAINT PETERSBU, FL; small business) : $35,828 in 2 contractsin 2005
$35,628 with Army for Lodging - Hotel/Motel. Signed on 2005-03-09. Completion date: 2005-03-08.
$200, same as above.Signed on 2005-06-08. Completion date: 2005-03-08.
MARK RICE (652 NORMANDY RD in SAINT PETERSBU, FL; small business) : $12,792 in 3 contractsin 2005
$7,436 with Navy for Miscellaneous Communication Equipment. Taking place in CA. Signed on 2005-09-10. Completion date: 2009-09-30.
$2,680 with Navy for Miscellaneous Communication Equipment. Taking place in MD. Signed on 2005-03-02. Completion date: 2005-03-16.
$2,676 with Navy for Fiber Optic Cables. Signed on 2005-11-08. Completion date: 2005-11-23.
KIEFFER INTERNATIONAL (15400 GULF BLVD in MADEIRA BEACH, FL; small business) : $9,740 in 2 contractsin 2005
$6,445 with Navy for Medical and Surgical Instruments, Equipment, and Supplies. Signed on 2005-03-14. Completion date: 2005-02-18.
$3,295, same as above.Signed on 2005-07-31. Completion date: 2005-08-12.
Top industries in this zip code by the number of employees in 2005:
2002 - 2018 National Fire Incident Reporting System (NFIRS) incidents
Based on the data from the years 2002 - 2018 the average number of fires per year is 72. The highest number of reported fire incidents - 157 took place in 2005, and the least - 37 in 2014. The data has a declining trend.
When looking into fire subcategories, the most reports belonged to: Structure Fires (50.8%), and Outside Fires (24.9%).
Fire incident types reported to NFIRS in Zip Code 33708


 Nearest zip codes: 33772, 33744, 33776, 33777, 33709, 33778.


 Based on the data from the years 2002 - 2018 the average number of fires per year is 72. The highest number of reported fire incidents - 157 took place in 2005, and the least - 37 in 2014. The data has a declining trend.
 When looking into fire subcategories, the most reports belonged to: Structure Fires (50.8%), and Outside Fires (24.9%).