Estimated zip code population in 2022: 17,328
Zip code population in 2010: 14,115
Zip code population in 2000: 12,792
Houses and condos: 8,586
Renter-occupied apartments: 1,151
% of renters here:
15%State:
33%
March 2022 cost of living index in zip code 34951: 89.0
(less than average, U.S. average is 100)
Land area: 24.8
sq. mi.
Water area: 0.3
sq. mi.
Population density: 699 people per square mile (low).
OSM Map
General Map
Google Map
MSN Map
OSM Map
General Map
Google Map
MSN Map
OSM Map
General Map
Google Map
MSN Map
OSM Map
General Map
Google Map
MSN Map
Please wait while loading the map...
Real estate property taxes paid for housing units in 2022:
This zip code:
0.6% ($1,527)Florida:
0.7% ($2,529)
Median real estate property taxes paid for housing units with mortgages in 2022: $1,954 (0.7%)
Median real estate property taxes paid for housing units with no mortgage in 2022: $1,265 (0.7%)
Profiles of local businesses
Business Search - 14 Million verified businesses
Males: 8,711 Females: 8,616
For population 25 years and over in 34951:
High school or higher: 88.5%Bachelor's degree or higher: 20.2%Graduate or professional degree: 5.2%Unemployed: 3.4%Mean travel time to work (commute): 34.2 minutes
For population 15 years and over in 34951:
Never married: 21.9%Now married: 50.1%Separated: 2.2%Widowed: 9.7%Divorced: 16.0%
Zip code 34951 compared to state average:
Hispanic race population percentage significantly below state average. Median age significantly above state average. Foreign-born population percentage below state average. Renting percentage below state average. Length of stay since moving in above state average. Percentage of population with a bachelor's degree or higher below state average. 12,870 74.3% White 1,953 11.3% Black 1,502 8.7% Hispanic or Latino 448 2.6% Asian 434 2.5% Two or more races 95 0.5% Some other race 15 0.09% Native Hawaiian and Other 8 0.05% American Indian
Data:
Median household income ($)
Median household income (% change since 2000)
Household income diversity
Ratio of average income to average house value (%)
Ratio of average income to average rent
Median household income ($) - White
Median household income ($) - Black or African American
Median household income ($) - Asian
Median household income ($) - Hispanic or Latino
Median household income ($) - American Indian and Alaska Native
Median household income ($) - Multirace
Median household income ($) - Other Race
Median household income for houses/condos with a mortgage ($)
Median household income for apartments without a mortgage ($)
Races - White alone (%)
Races - White alone (% change since 2000)
Races - Black alone (%)
Races - Black alone (% change since 2000)
Races - American Indian alone (%)
Races - American Indian alone (% change since 2000)
Races - Asian alone (%)
Races - Asian alone (% change since 2000)
Races - Hispanic (%)
Races - Hispanic (% change since 2000)
Races - Native Hawaiian and Other Pacific Islander alone (%)
Races - Native Hawaiian and Other Pacific Islander alone (% change since 2000)
Races - Two or more races (%)
Races - Two or more races (% change since 2000)
Races - Other race alone (%)
Races - Other race alone (% change since 2000)
Racial diversity
Unemployment (%)
Unemployment (% change since 2000)
Unemployment (%) - White
Unemployment (%) - Black or African American
Unemployment (%) - Asian
Unemployment (%) - Hispanic or Latino
Unemployment (%) - American Indian and Alaska Native
Unemployment (%) - Multirace
Unemployment (%) - Other Race
Population density (people per square mile)
Population - Males (%)
Population - Females (%)
Population - Males (%) - White
Population - Males (%) - Black or African American
Population - Males (%) - Asian
Population - Males (%) - Hispanic or Latino
Population - Males (%) - American Indian and Alaska Native
Population - Males (%) - Multirace
Population - Males (%) - Other Race
Population - Females (%) - White
Population - Females (%) - Black or African American
Population - Females (%) - Asian
Population - Females (%) - Hispanic or Latino
Population - Females (%) - American Indian and Alaska Native
Population - Females (%) - Multirace
Population - Females (%) - Other Race
Coronavirus confirmed cases (Apr 27, 2024)
Deaths caused by coronavirus (Apr 27, 2024)
Coronavirus confirmed cases (per 100k population) (Apr 27, 2024)
Deaths caused by coronavirus (per 100k population) (Apr 27, 2024)
Daily increase in number of cases (Apr 27, 2024)
Weekly increase in number of cases (Apr 27, 2024)
Cases doubled (in days) (Apr 27, 2024)
Hospitalized patients (Apr 18, 2022)
Negative test results (Apr 18, 2022)
Total test results (Apr 18, 2022)
COVID Vaccine doses distributed (per 100k population) (Sep 19, 2023)
COVID Vaccine doses administered (per 100k population) (Sep 19, 2023)
COVID Vaccine doses distributed (Sep 19, 2023)
COVID Vaccine doses administered (Sep 19, 2023)
Likely homosexual households (%)
Likely homosexual households (% change since 2000)
Likely homosexual households - Lesbian couples (%)
Likely homosexual households - Lesbian couples (% change since 2000)
Likely homosexual households - Gay men (%)
Likely homosexual households - Gay men (% change since 2000)
Cost of living index
Median gross rent ($)
Median contract rent ($)
Median monthly housing costs ($)
Median house or condo value ($)
Median house or condo value ($ change since 2000)
Mean house or condo value by units in structure - 1, detached ($)
Mean house or condo value by units in structure - 1, attached ($)
Mean house or condo value by units in structure - 2 ($)
Mean house or condo value by units in structure by units in structure - 3 or 4 ($)
Mean house or condo value by units in structure - 5 or more ($)
Mean house or condo value by units in structure - Boat, RV, van, etc. ($)
Mean house or condo value by units in structure - Mobile home ($)
Median house or condo value ($) - White
Median house or condo value ($) - Black or African American
Median house or condo value ($) - Asian
Median house or condo value ($) - Hispanic or Latino
Median house or condo value ($) - American Indian and Alaska Native
Median house or condo value ($) - Multirace
Median house or condo value ($) - Other Race
Median resident age
Resident age diversity
Median resident age - Males
Median resident age - Females
Median resident age - White
Median resident age - Black or African American
Median resident age - Asian
Median resident age - Hispanic or Latino
Median resident age - American Indian and Alaska Native
Median resident age - Multirace
Median resident age - Other Race
Median resident age - Males - White
Median resident age - Males - Black or African American
Median resident age - Males - Asian
Median resident age - Males - Hispanic or Latino
Median resident age - Males - American Indian and Alaska Native
Median resident age - Males - Multirace
Median resident age - Males - Other Race
Median resident age - Females - White
Median resident age - Females - Black or African American
Median resident age - Females - Asian
Median resident age - Females - Hispanic or Latino
Median resident age - Females - American Indian and Alaska Native
Median resident age - Females - Multirace
Median resident age - Females - Other Race
Commute - mean travel time to work (minutes)
Travel time to work - Less than 5 minutes (%)
Travel time to work - Less than 5 minutes (% change since 2000)
Travel time to work - 5 to 9 minutes (%)
Travel time to work - 5 to 9 minutes (% change since 2000)
Travel time to work - 10 to 19 minutes (%)
Travel time to work - 10 to 19 minutes (% change since 2000)
Travel time to work - 20 to 29 minutes (%)
Travel time to work - 20 to 29 minutes (% change since 2000)
Travel time to work - 30 to 39 minutes (%)
Travel time to work - 30 to 39 minutes (% change since 2000)
Travel time to work - 40 to 59 minutes (%)
Travel time to work - 40 to 59 minutes (% change since 2000)
Travel time to work - 60 to 89 minutes (%)
Travel time to work - 60 to 89 minutes (% change since 2000)
Travel time to work - 90 or more minutes (%)
Travel time to work - 90 or more minutes (% change since 2000)
Marital status - Never married (%)
Marital status - Now married (%)
Marital status - Separated (%)
Marital status - Widowed (%)
Marital status - Divorced (%)
Median family income ($)
Median family income (% change since 2000)
Median non-family income ($)
Median non-family income (% change since 2000)
Median per capita income ($)
Median per capita income (% change since 2000)
Median family income ($) - White
Median family income ($) - Black or African American
Median family income ($) - Asian
Median family income ($) - Hispanic or Latino
Median family income ($) - American Indian and Alaska Native
Median family income ($) - Multirace
Median family income ($) - Other Race
Median year house/condo built
Median year apartment built
Year house built - Built 2005 or later (%)
Year house built - Built 2000 to 2004 (%)
Year house built - Built 1990 to 1999 (%)
Year house built - Built 1980 to 1989 (%)
Year house built - Built 1970 to 1979 (%)
Year house built - Built 1960 to 1969 (%)
Year house built - Built 1950 to 1959 (%)
Year house built - Built 1940 to 1949 (%)
Year house built - Built 1939 or earlier (%)
Average household size
Household density (households per square mile)
Average household size - White
Average household size - Black or African American
Average household size - Asian
Average household size - Hispanic or Latino
Average household size - American Indian and Alaska Native
Average household size - Multirace
Average household size - Other Race
Occupied housing units (%)
Vacant housing units (%)
Owner occupied housing units (%)
Renter occupied housing units (%)
Vacancy status - For rent (%)
Vacancy status - For sale only (%)
Vacancy status - Rented or sold, not occupied (%)
Vacancy status - For seasonal, recreational, or occasional use (%)
Vacancy status - For migrant workers (%)
Vacancy status - Other vacant (%)
Residents with income below the poverty level (%)
Residents with income below 50% of the poverty level (%)
Children below poverty level (%)
Poor families by family type - Married-couple family (%)
Poor families by family type - Male, no wife present (%)
Poor families by family type - Female, no husband present (%)
Poverty status for native-born residents (%)
Poverty status for foreign-born residents (%)
Poverty among high school graduates not in families (%)
Poverty among people who did not graduate high school not in families (%)
Residents with income below the poverty level (%) - White
Residents with income below the poverty level (%) - Black or African American
Residents with income below the poverty level (%) - Asian
Residents with income below the poverty level (%) - Hispanic or Latino
Residents with income below the poverty level (%) - American Indian and Alaska Native
Residents with income below the poverty level (%) - Multirace
Residents with income below the poverty level (%) - Other Race
Air pollution - Air Quality Index (AQI)
Air pollution - CO
Air pollution - NO2
Air pollution - SO2
Air pollution - Ozone
Air pollution - PM10
Air pollution - PM25
Air pollution - Pb
Crime - Murders per 100,000 population
Crime - Rapes per 100,000 population
Crime - Robberies per 100,000 population
Crime - Assaults per 100,000 population
Crime - Burglaries per 100,000 population
Crime - Thefts per 100,000 population
Crime - Auto thefts per 100,000 population
Crime - Arson per 100,000 population
Crime - City-data.com crime index
Crime - Violent crime index
Crime - Property crime index
Crime - Murders per 100,000 population (5 year average)
Crime - Rapes per 100,000 population (5 year average)
Crime - Robberies per 100,000 population (5 year average)
Crime - Assaults per 100,000 population (5 year average)
Crime - Burglaries per 100,000 population (5 year average)
Crime - Thefts per 100,000 population (5 year average)
Crime - Auto thefts per 100,000 population (5 year average)
Crime - Arson per 100,000 population (5 year average)
Crime - City-data.com crime index (5 year average)
Crime - Violent crime index (5 year average)
Crime - Property crime index (5 year average)
1996 Presidential Elections Results (%) - Democratic Party (Clinton)
1996 Presidential Elections Results (%) - Republican Party (Dole)
1996 Presidential Elections Results (%) - Other
2000 Presidential Elections Results (%) - Democratic Party (Gore)
2000 Presidential Elections Results (%) - Republican Party (Bush)
2000 Presidential Elections Results (%) - Other
2004 Presidential Elections Results (%) - Democratic Party (Kerry)
2004 Presidential Elections Results (%) - Republican Party (Bush)
2004 Presidential Elections Results (%) - Other
2008 Presidential Elections Results (%) - Democratic Party (Obama)
2008 Presidential Elections Results (%) - Republican Party (McCain)
2008 Presidential Elections Results (%) - Other
2012 Presidential Elections Results (%) - Democratic Party (Obama)
2012 Presidential Elections Results (%) - Republican Party (Romney)
2012 Presidential Elections Results (%) - Other
2016 Presidential Elections Results (%) - Democratic Party (Clinton)
2016 Presidential Elections Results (%) - Republican Party (Trump)
2016 Presidential Elections Results (%) - Other
2020 Presidential Elections Results (%) - Democratic Party (Biden)
2020 Presidential Elections Results (%) - Republican Party (Trump)
2020 Presidential Elections Results (%) - Other
Ancestries Reported - Arab (%)
Ancestries Reported - Czech (%)
Ancestries Reported - Danish (%)
Ancestries Reported - Dutch (%)
Ancestries Reported - English (%)
Ancestries Reported - French (%)
Ancestries Reported - French Canadian (%)
Ancestries Reported - German (%)
Ancestries Reported - Greek (%)
Ancestries Reported - Hungarian (%)
Ancestries Reported - Irish (%)
Ancestries Reported - Italian (%)
Ancestries Reported - Lithuanian (%)
Ancestries Reported - Norwegian (%)
Ancestries Reported - Polish (%)
Ancestries Reported - Portuguese (%)
Ancestries Reported - Russian (%)
Ancestries Reported - Scotch-Irish (%)
Ancestries Reported - Scottish (%)
Ancestries Reported - Slovak (%)
Ancestries Reported - Subsaharan African (%)
Ancestries Reported - Swedish (%)
Ancestries Reported - Swiss (%)
Ancestries Reported - Ukrainian (%)
Ancestries Reported - United States (%)
Ancestries Reported - Welsh (%)
Ancestries Reported - West Indian (%)
Ancestries Reported - Other (%)
Educational Attainment - No schooling completed (%)
Educational Attainment - Less than high school (%)
Educational Attainment - High school or equivalent (%)
Educational Attainment - Less than 1 year of college (%)
Educational Attainment - 1 or more years of college (%)
Educational Attainment - Associate degree (%)
Educational Attainment - Bachelor's degree (%)
Educational Attainment - Master's degree (%)
Educational Attainment - Professional school degree (%)
Educational Attainment - Doctorate degree (%)
School Enrollment - Nursery, preschool (%)
School Enrollment - Kindergarten (%)
School Enrollment - Grade 1 to 4 (%)
School Enrollment - Grade 5 to 8 (%)
School Enrollment - Grade 9 to 12 (%)
School Enrollment - College undergrad (%)
School Enrollment - Graduate or professional (%)
School Enrollment - Not enrolled in school (%)
School enrollment - Public schools (%)
School enrollment - Private schools (%)
School enrollment - Not enrolled (%)
Median number of rooms in houses and condos
Median number of rooms in apartments
Housing units lacking complete plumbing facilities (%)
Housing units lacking complete kitchen facilities (%)
Density of houses
Urban houses (%)
Rural houses (%)
Households with people 60 years and over (%)
Households with people 65 years and over (%)
Households with people 75 years and over (%)
Households with one or more nonrelatives (%)
Households with no nonrelatives (%)
Population in households (%)
Family households (%)
Nonfamily households (%)
Population in families (%)
Family households with own children (%)
Median number of bedrooms in owner occupied houses
Mean number of bedrooms in owner occupied houses
Median number of bedrooms in renter occupied houses
Mean number of bedrooms in renter occupied houses
Median number of vehichles in owner occupied houses
Mean number of vehichles in owner occupied houses
Median number of vehichles in renter occupied houses
Mean number of vehichles in renter occupied houses
Mortgage status - with mortgage (%)
Mortgage status - with second mortgage (%)
Mortgage status - with home equity loan (%)
Mortgage status - with both second mortgage and home equity loan (%)
Mortgage status - without a mortgage (%)
Average family size
Average family size - White
Average family size - Black or African American
Average family size - Asian
Average family size - Hispanic or Latino
Average family size - American Indian and Alaska Native
Average family size - Multirace
Average family size - Other Race
Geographical mobility - Same house 1 year ago (%)
Geographical mobility - Moved within same county (%)
Geographical mobility - Moved from different county within same state (%)
Geographical mobility - Moved from different state (%)
Geographical mobility - Moved from abroad (%)
Place of birth - Born in state of residence (%)
Place of birth - Born in other state (%)
Place of birth - Native, outside of US (%)
Place of birth - Foreign born (%)
Housing units in structures - 1, detached (%)
Housing units in structures - 1, attached (%)
Housing units in structures - 2 (%)
Housing units in structures - 3 or 4 (%)
Housing units in structures - 5 to 9 (%)
Housing units in structures - 10 to 19 (%)
Housing units in structures - 20 to 49 (%)
Housing units in structures - 50 or more (%)
Housing units in structures - Mobile home (%)
Housing units in structures - Boat, RV, van, etc. (%)
House/condo owner moved in on average (years ago)
Renter moved in on average (years ago)
Year householder moved into unit - Moved in 1999 to March 2000 (%)
Year householder moved into unit - Moved in 1995 to 1998 (%)
Year householder moved into unit - Moved in 1990 to 1994 (%)
Year householder moved into unit - Moved in 1980 to 1989 (%)
Year householder moved into unit - Moved in 1970 to 1979 (%)
Year householder moved into unit - Moved in 1969 or earlier (%)
Means of transportation to work - Drove car alone (%)
Means of transportation to work - Carpooled (%)
Means of transportation to work - Public transportation (%)
Means of transportation to work - Bus or trolley bus (%)
Means of transportation to work - Streetcar or trolley car (%)
Means of transportation to work - Subway or elevated (%)
Means of transportation to work - Railroad (%)
Means of transportation to work - Ferryboat (%)
Means of transportation to work - Taxicab (%)
Means of transportation to work - Motorcycle (%)
Means of transportation to work - Bicycle (%)
Means of transportation to work - Walked (%)
Means of transportation to work - Other means (%)
Working at home (%)
Industry diversity
Most Common Industries - Agriculture, forestry, fishing and hunting, and mining (%)
Most Common Industries - Agriculture, forestry, fishing and hunting (%)
Most Common Industries - Mining, quarrying, and oil and gas extraction (%)
Most Common Industries - Construction (%)
Most Common Industries - Manufacturing (%)
Most Common Industries - Wholesale trade (%)
Most Common Industries - Retail trade (%)
Most Common Industries - Transportation and warehousing, and utilities (%)
Most Common Industries - Transportation and warehousing (%)
Most Common Industries - Utilities (%)
Most Common Industries - Information (%)
Most Common Industries - Finance and insurance, and real estate and rental and leasing (%)
Most Common Industries - Finance and insurance (%)
Most Common Industries - Real estate and rental and leasing (%)
Most Common Industries - Professional, scientific, and management, and administrative and waste management services (%)
Most Common Industries - Professional, scientific, and technical services (%)
Most Common Industries - Management of companies and enterprises (%)
Most Common Industries - Administrative and support and waste management services (%)
Most Common Industries - Educational services, and health care and social assistance (%)
Most Common Industries - Educational services (%)
Most Common Industries - Health care and social assistance (%)
Most Common Industries - Arts, entertainment, and recreation, and accommodation and food services (%)
Most Common Industries - Arts, entertainment, and recreation (%)
Most Common Industries - Accommodation and food services (%)
Most Common Industries - Other services, except public administration (%)
Most Common Industries - Public administration (%)
Occupation diversity
Most Common Occupations - Management, business, science, and arts occupations (%)
Most Common Occupations - Management, business, and financial occupations (%)
Most Common Occupations - Management occupations (%)
Most Common Occupations - Business and financial operations occupations (%)
Most Common Occupations - Computer, engineering, and science occupations (%)
Most Common Occupations - Computer and mathematical occupations (%)
Most Common Occupations - Architecture and engineering occupations (%)
Most Common Occupations - Life, physical, and social science occupations (%)
Most Common Occupations - Education, legal, community service, arts, and media occupations (%)
Most Common Occupations - Community and social service occupations (%)
Most Common Occupations - Legal occupations (%)
Most Common Occupations - Education, training, and library occupations (%)
Most Common Occupations - Arts, design, entertainment, sports, and media occupations (%)
Most Common Occupations - Healthcare practitioners and technical occupations (%)
Most Common Occupations - Health diagnosing and treating practitioners and other technical occupations (%)
Most Common Occupations - Health technologists and technicians (%)
Most Common Occupations - Service occupations (%)
Most Common Occupations - Healthcare support occupations (%)
Most Common Occupations - Protective service occupations (%)
Most Common Occupations - Fire fighting and prevention, and other protective service workers including supervisors (%)
Most Common Occupations - Law enforcement workers including supervisors (%)
Most Common Occupations - Food preparation and serving related occupations (%)
Most Common Occupations - Building and grounds cleaning and maintenance occupations (%)
Most Common Occupations - Personal care and service occupations (%)
Most Common Occupations - Sales and office occupations (%)
Most Common Occupations - Sales and related occupations (%)
Most Common Occupations - Office and administrative support occupations (%)
Most Common Occupations - Natural resources, construction, and maintenance occupations (%)
Most Common Occupations - Farming, fishing, and forestry occupations (%)
Most Common Occupations - Construction and extraction occupations (%)
Most Common Occupations - Installation, maintenance, and repair occupations (%)
Most Common Occupations - Production, transportation, and material moving occupations (%)
Most Common Occupations - Production occupations (%)
Most Common Occupations - Transportation occupations (%)
Most Common Occupations - Material moving occupations (%)
People in Group quarters - Institutionalized population (%)
People in Group quarters - Correctional institutions (%)
People in Group quarters - Federal prisons and detention centers (%)
People in Group quarters - Halfway houses (%)
People in Group quarters - Local jails and other confinement facilities (including police lockups) (%)
People in Group quarters - Military disciplinary barracks (%)
People in Group quarters - State prisons (%)
People in Group quarters - Other types of correctional institutions (%)
People in Group quarters - Nursing homes (%)
People in Group quarters - Hospitals/wards, hospices, and schools for the handicapped (%)
People in Group quarters - Hospitals/wards and hospices for chronically ill (%)
People in Group quarters - Hospices or homes for chronically ill (%)
People in Group quarters - Military hospitals or wards for chronically ill (%)
People in Group quarters - Other hospitals or wards for chronically ill (%)
People in Group quarters - Hospitals or wards for drug/alcohol abuse (%)
People in Group quarters - Mental (Psychiatric) hospitals or wards (%)
People in Group quarters - Schools, hospitals, or wards for the mentally retarded (%)
People in Group quarters - Schools, hospitals, or wards for the physically handicapped (%)
People in Group quarters - Institutions for the deaf (%)
People in Group quarters - Institutions for the blind (%)
People in Group quarters - Orthopedic wards and institutions for the physically handicapped (%)
People in Group quarters - Wards in general hospitals for patients who have no usual home elsewhere (%)
People in Group quarters - Wards in military hospitals for patients who have no usual home elsewhere (%)
People in Group quarters - Juvenile institutions (%)
People in Group quarters - Long-term care (%)
People in Group quarters - Homes for abused, dependent, and neglected children (%)
People in Group quarters - Residential treatment centers for emotionally disturbed children (%)
People in Group quarters - Training schools for juvenile delinquents (%)
People in Group quarters - Short-term care, detention or diagnostic centers for delinquent children (%)
People in Group quarters - Type of juvenile institution unknown (%)
People in Group quarters - Noninstitutionalized population (%)
People in Group quarters - College dormitories (includes college quarters off campus) (%)
People in Group quarters - Military quarters (%)
People in Group quarters - On base (%)
People in Group quarters - Barracks, unaccompanied personnel housing (UPH), (Enlisted/Officer), ;and similar group living quarters for military personnel (%)
People in Group quarters - Transient quarters for temporary residents (%)
People in Group quarters - Military ships (%)
People in Group quarters - Group homes (%)
People in Group quarters - Homes or halfway houses for drug/alcohol abuse (%)
People in Group quarters - Homes for the mentally ill (%)
People in Group quarters - Homes for the mentally retarded (%)
People in Group quarters - Homes for the physically handicapped (%)
People in Group quarters - Other group homes (%)
People in Group quarters - Religious group quarters (%)
People in Group quarters - Dormitories (%)
People in Group quarters - Agriculture workers' dormitories on farms (%)
People in Group quarters - Job Corps and vocational training facilities (%)
People in Group quarters - Other workers' dormitories (%)
People in Group quarters - Crews of maritime vessels (%)
People in Group quarters - Other nonhousehold living situations (%)
People in Group quarters - Other noninstitutional group quarters (%)
Residents speaking English at home (%)
Residents speaking English at home - Born in the United States (%)
Residents speaking English at home - Native, born elsewhere (%)
Residents speaking English at home - Foreign born (%)
Residents speaking Spanish at home (%)
Residents speaking Spanish at home - Born in the United States (%)
Residents speaking Spanish at home - Native, born elsewhere (%)
Residents speaking Spanish at home - Foreign born (%)
Residents speaking other language at home (%)
Residents speaking other language at home - Born in the United States (%)
Residents speaking other language at home - Native, born elsewhere (%)
Residents speaking other language at home - Foreign born (%)
Class of Workers - Employee of private company (%)
Class of Workers - Self-employed in own incorporated business (%)
Class of Workers - Private not-for-profit wage and salary workers (%)
Class of Workers - Local government workers (%)
Class of Workers - State government workers (%)
Class of Workers - Federal government workers (%)
Class of Workers - Self-employed workers in own not incorporated business and Unpaid family workers (%)
House heating fuel used in houses and condos - Utility gas (%)
House heating fuel used in houses and condos - Bottled, tank, or LP gas (%)
House heating fuel used in houses and condos - Electricity (%)
House heating fuel used in houses and condos - Fuel oil, kerosene, etc. (%)
House heating fuel used in houses and condos - Coal or coke (%)
House heating fuel used in houses and condos - Wood (%)
House heating fuel used in houses and condos - Solar energy (%)
House heating fuel used in houses and condos - Other fuel (%)
House heating fuel used in houses and condos - No fuel used (%)
House heating fuel used in apartments - Utility gas (%)
House heating fuel used in apartments - Bottled, tank, or LP gas (%)
House heating fuel used in apartments - Electricity (%)
House heating fuel used in apartments - Fuel oil, kerosene, etc. (%)
House heating fuel used in apartments - Coal or coke (%)
House heating fuel used in apartments - Wood (%)
House heating fuel used in apartments - Solar energy (%)
House heating fuel used in apartments - Other fuel (%)
House heating fuel used in apartments - No fuel used (%)
Armed forces status - In Armed Forces (%)
Armed forces status - Civilian (%)
Armed forces status - Civilian - Veteran (%)
Armed forces status - Civilian - Nonveteran (%)
Fatal accidents locations in years 2005-2021
Fatal accidents locations in 2005
Fatal accidents locations in 2006
Fatal accidents locations in 2007
Fatal accidents locations in 2008
Fatal accidents locations in 2009
Fatal accidents locations in 2010
Fatal accidents locations in 2011
Fatal accidents locations in 2012
Fatal accidents locations in 2013
Fatal accidents locations in 2014
Fatal accidents locations in 2015
Fatal accidents locations in 2016
Fatal accidents locations in 2017
Fatal accidents locations in 2018
Fatal accidents locations in 2019
Fatal accidents locations in 2020
Fatal accidents locations in 2021
Alcohol use - People drinking some alcohol every month (%)
Alcohol use - People not drinking at all (%)
Alcohol use - Average days/month drinking alcohol
Alcohol use - Average drinks/week
Alcohol use - Average days/year people drink much
Audiometry - Average condition of hearing (%)
Audiometry - People that can hear a whisper from across a quiet room (%)
Audiometry - People that can hear normal voice from across a quiet room (%)
Audiometry - Ears ringing, roaring, buzzing (%)
Audiometry - Had a job exposure to loud noise (%)
Audiometry - Had off-work exposure to loud noise (%)
Blood Pressure & Cholesterol - Has high blood pressure (%)
Blood Pressure & Cholesterol - Checking blood pressure at home (%)
Blood Pressure & Cholesterol - Frequently checking blood cholesterol (%)
Blood Pressure & Cholesterol - Has high cholesterol level (%)
Consumer Behavior - Money monthly spent on food at supermarket/grocery store
Consumer Behavior - Money monthly spent on food at other stores
Consumer Behavior - Money monthly spent on eating out
Consumer Behavior - Money monthly spent on carryout/delivered foods
Consumer Behavior - Income spent on food at supermarket/grocery store (%)
Consumer Behavior - Income spent on food at other stores (%)
Consumer Behavior - Income spent on eating out (%)
Consumer Behavior - Income spent on carryout/delivered foods (%)
Current Health Status - General health condition (%)
Current Health Status - Blood donors (%)
Current Health Status - Has blood ever tested for HIV virus (%)
Current Health Status - Left-handed people (%)
Dermatology - People using sunscreen (%)
Diabetes - Diabetics (%)
Diabetes - Had a blood test for high blood sugar (%)
Diabetes - People taking insulin (%)
Diet Behavior & Nutrition - Diet health (%)
Diet Behavior & Nutrition - Milk product consumption (# of products/month)
Diet Behavior & Nutrition - Meals not home prepared (#/week)
Diet Behavior & Nutrition - Meals from fast food or pizza place (#/week)
Diet Behavior & Nutrition - Ready-to-eat foods (#/month)
Diet Behavior & Nutrition - Frozen meals/pizza (#/month)
Drug Use - People that ever used marijuana or hashish (%)
Drug Use - Ever used hard drugs (%)
Drug Use - Ever used any form of cocaine (%)
Drug Use - Ever used heroin (%)
Drug Use - Ever used methamphetamine (%)
Health Insurance - People covered by health insurance (%)
Kidney Conditions-Urology - Avg. # of times urinating at night
Medical Conditions - People with asthma (%)
Medical Conditions - People with anemia (%)
Medical Conditions - People with psoriasis (%)
Medical Conditions - People with overweight (%)
Medical Conditions - Elderly people having difficulties in thinking or remembering (%)
Medical Conditions - People who ever received blood transfusion (%)
Medical Conditions - People having trouble seeing even with glass/contacts (%)
Medical Conditions - People with arthritis (%)
Medical Conditions - People with gout (%)
Medical Conditions - People with congestive heart failure (%)
Medical Conditions - People with coronary heart disease (%)
Medical Conditions - People with angina pectoris (%)
Medical Conditions - People who ever had heart attack (%)
Medical Conditions - People who ever had stroke (%)
Medical Conditions - People with emphysema (%)
Medical Conditions - People with thyroid problem (%)
Medical Conditions - People with chronic bronchitis (%)
Medical Conditions - People with any liver condition (%)
Medical Conditions - People who ever had cancer or malignancy (%)
Mental Health - People who have little interest in doing things (%)
Mental Health - People feeling down, depressed, or hopeless (%)
Mental Health - People who have trouble sleeping or sleeping too much (%)
Mental Health - People feeling tired or having little energy (%)
Mental Health - People with poor appetite or overeating (%)
Mental Health - People feeling bad about themself (%)
Mental Health - People who have trouble concentrating on things (%)
Mental Health - People moving or speaking slowly or too fast (%)
Mental Health - People having thoughts they would be better off dead (%)
Oral Health - Average years since last visit a dentist
Oral Health - People embarrassed because of mouth (%)
Oral Health - People with gum disease (%)
Oral Health - General health of teeth and gums (%)
Oral Health - Average days a week using dental floss/device
Oral Health - Average days a week using mouthwash for dental problem
Oral Health - Average number of teeth
Pesticide Use - Households using pesticides to control insects (%)
Pesticide Use - Households using pesticides to kill weeds (%)
Physical Activity - People doing vigorous-intensity work activities (%)
Physical Activity - People doing moderate-intensity work activities (%)
Physical Activity - People walking or bicycling (%)
Physical Activity - People doing vigorous-intensity recreational activities (%)
Physical Activity - People doing moderate-intensity recreational activities (%)
Physical Activity - Average hours a day doing sedentary activities
Physical Activity - Average hours a day watching TV or videos
Physical Activity - Average hours a day using computer
Physical Functioning - People having limitations keeping them from working (%)
Physical Functioning - People limited in amount of work they can do (%)
Physical Functioning - People that need special equipment to walk (%)
Physical Functioning - People experiencing confusion/memory problems (%)
Physical Functioning - People requiring special healthcare equipment (%)
Prescription Medications - Average number of prescription medicines taking
Preventive Aspirin Use - Adults 40+ taking low-dose aspirin (%)
Reproductive Health - Vaginal deliveries (%)
Reproductive Health - Cesarean deliveries (%)
Reproductive Health - Deliveries resulted in a live birth (%)
Reproductive Health - Pregnancies resulted in a delivery (%)
Reproductive Health - Women breastfeeding newborns (%)
Reproductive Health - Women that had a hysterectomy (%)
Reproductive Health - Women that had both ovaries removed (%)
Reproductive Health - Women that have ever taken birth control pills (%)
Reproductive Health - Women taking birth control pills (%)
Reproductive Health - Women that have ever used Depo-Provera or injectables (%)
Reproductive Health - Women that have ever used female hormones (%)
Sexual Behavior - People 18+ that ever had sex (vaginal, anal, or oral) (%)
Sexual Behavior - Males 18+ that ever had vaginal sex with a woman (%)
Sexual Behavior - Males 18+ that ever performed oral sex on a woman (%)
Sexual Behavior - Males 18+ that ever had anal sex with a woman (%)
Sexual Behavior - Males 18+ that ever had any sex with a man (%)
Sexual Behavior - Females 18+ that ever had vaginal sex with a man (%)
Sexual Behavior - Females 18+ that ever performed oral sex on a man (%)
Sexual Behavior - Females 18+ that ever had anal sex with a man (%)
Sexual Behavior - Females 18+ that ever had any kind of sex with a woman (%)
Sexual Behavior - Average age people first had sex
Sexual Behavior - Average number of female sex partners in lifetime (males 18+)
Sexual Behavior - Average number of female vaginal sex partners in lifetime (males 18+)
Sexual Behavior - Average age people first performed oral sex on a woman (18+)
Sexual Behavior - Average number of woman performed oral sex on in lifetime (18+)
Sexual Behavior - Average number of male sex partners in lifetime (males 18+)
Sexual Behavior - Average number of male anal sex partners in lifetime (males 18+)
Sexual Behavior - Average age people first performed oral sex on a man (18+)
Sexual Behavior - Average number of male oral sex partners in lifetime (18+)
Sexual Behavior - People using protection when performing oral sex (%)
Sexual Behavior - Average number of times people have vaginal or anal sex a year
Sexual Behavior - People having sex without condom (%)
Sexual Behavior - Average number of male sex partners in lifetime (females 18+)
Sexual Behavior - Average number of male vaginal sex partners in lifetime (females 18+)
Sexual Behavior - Average number of female sex partners in lifetime (females 18+)
Sexual Behavior - Circumcised males 18+ (%)
Sleep Disorders - Average hours sleeping at night
Sleep Disorders - People that has trouble sleeping (%)
Smoking-Cigarette Use - People smoking cigarettes (%)
Taste & Smell - People 40+ having problems with smell (%)
Taste & Smell - People 40+ having problems with taste (%)
Taste & Smell - People 40+ that ever had wisdom teeth removed (%)
Taste & Smell - People 40+ that ever had tonsils teeth removed (%)
Taste & Smell - People 40+ that ever had a loss of consciousness because of a head injury (%)
Taste & Smell - People 40+ that ever had a broken nose or other serious injury to face or skull (%)
Taste & Smell - People 40+ that ever had two or more sinus infections (%)
Weight - Average height (inches)
Weight - Average weight (pounds)
Weight - Average BMI
Weight - People that are obese (%)
Weight - People that ever were obese (%)
Weight - People trying to lose weight (%)
Urban population: 13,008
Rural population: 4,319
Estimated median house/condo value in 2022: $241,641
34951:
$241,641Florida:
$354,100
According to our research of Florida and other state lists, there were 27 registered sex offenders living in 34951 zip code as of April 26, 2024 . The ratio of all residents to sex offenders in zip code 34951 is 563 to 1.The ratio of registered sex offenders to all residents in this zip code is near the state average.
Median resident age: This zip code:
56.1 yearsFlorida median age:
42.7 years
Average household size: This zip code:
2.3 peopleFlorida:
2.5 people
Averages for the 2020 tax year for zip code 34951, filed in 2021:
Average Adjusted Gross Income (AGI) in 2020: $50,772 (Individual Income Tax Returns) Here:
$50,772State:
$82,200
Salary/wage: $44,598 (reported on 70.8% of returns )Here:
$44,598State:
$58,347
(% of AGI for various income ranges: 1028.3% for AGIs below $25k , 3275.3% for AGIs $25k-50k , 5738.7% for AGIs $50k-75k , 8451.7% for AGIs $75k-100k , 14229.3% for AGIs $100k-200k , 53992.5% for AGIs over 200k ) Taxable interest for individuals: $1,614 (reported on 25.7% of returns )This zip code:
$1,614Florida:
$4,272
(% of AGI for various income ranges: 17.0% for AGIs below $25k , 27.5% for AGIs $25k-50k , 67.0% for AGIs $50k-75k , 78.3% for AGIs $75k-100k , 149.0% for AGIs $100k-200k , 2127.5% for AGIs over 200k ) Ordinary dividends: $4,840 (reported on 17.7% of returns )(% of AGI for various income ranges: 30.2% for AGIs below $25k , 50.3% for AGIs $25k-50k , 116.5% for AGIs $50k-75k , 198.3% for AGIs $75k-100k , 369.5% for AGIs $100k-200k , 4382.5% for AGIs over 200k ) Net capital gain/loss in AGI: +$11,329 (reported on 15.4% of returns )Here:
+$11,329State:
+$62,983
(% of AGI for various income ranges: 14.2% for AGIs below $25k , 19.4% for AGIs $25k-50k , 57.7% for AGIs $50k-75k , 256.4% for AGIs $75k-100k , 986.9% for AGIs $100k-200k , 17617.5% for AGIs over 200k ) Profit/loss from business: +$6,379 (reported on 15.6% of returns )Here:
+$6,379State:
+$9,719
(% of AGI for various income ranges: 114.8% for AGIs below $25k , 88.6% for AGIs $25k-50k , 156.5% for AGIs $50k-75k , 192.9% for AGIs $75k-100k , 191.7% for AGIs $100k-200k , 2295.0% for AGIs over 200k ) Taxable individual retirement arrangement distribution: $17,470 (reported on 14.2% of returns )34951:
$17,470Florida:
$24,823
(% of AGI for various income ranges: 110.8% for AGIs below $25k , 154.5% for AGIs $25k-50k , 353.5% for AGIs $50k-75k , 635.2% for AGIs $75k-100k , 1389.3% for AGIs $100k-200k , 6770.0% for AGIs over 200k ) Total itemized deductions: $33,848 (reported on 3.5% of returns )Here:
$33,848State:
$45,393
(% of AGI for various income ranges: 21.1% for AGIs below $25k , 105.1% for AGIs $25k-50k , 181.7% for AGIs $50k-75k , 284.8% for AGIs $75k-100k , 497.6% for AGIs $100k-200k , 5220.0% for AGIs over 200k ) Charity contributions: $8,996 (reported on 3.0% of returns )(% of AGI for various income ranges: 13.1% for AGIs $25k-50k , 25.1% for AGIs $50k-75k , 64.8% for AGIs $75k-100k , 106.4% for AGIs $100k-200k , 2282.5% for AGIs over 200k ) Taxes paid: $5,474 (reported on 3.5% of returns )(% of AGI for various income ranges: 2.8% for AGIs below $25k , 14.0% for AGIs $25k-50k , 36.6% for AGIs $50k-75k , 60.5% for AGIs $75k-100k , 86.9% for AGIs $100k-200k , 637.5% for AGIs over 200k ) Earned income credit: $2,246 (reported on 17.3% of returns )(% of AGI for various income ranges: 98.0% for AGIs below $25k , 59.8% for AGIs $25k-50k ) Percentage of individuals using paid preparers for their 2020 taxes: 93.2%(% for various income ranges: 91.2% for AGIs below $25k , 94.6% for AGIs $25k-50k , 94.1% for AGIs $50k-75k , 94.0% for AGIs $75k-100k , 94.6% for AGIs $100k-200k , 92.9% for AGIs over 200k )
Averages for the 2012 tax year for zip code 34951, filed in 2013:
Average Adjusted Gross Income (AGI) in 2012: $42,007 (Individual Income Tax Returns) Here:
$42,007State:
$60,316
Salary/wage: $35,959 (reported on 70.3% of returns )Here:
$35,959State:
$45,277
(% of AGI for various income ranges: 59.0% for AGIs below $25k , 66.2% for AGIs $25k-50k , 64.9% for AGIs $50k-75k , 65.0% for AGIs $75k-100k , 62.2% for AGIs $100k-200k , 24.6% for AGIs over 200k ) Taxable interest for individuals: $1,970 (reported on 33.7% of returns )This zip code:
$1,970Florida:
$3,587
(% of AGI for various income ranges: 2.0% for AGIs below $25k , 1.2% for AGIs $25k-50k , 1.2% for AGIs $50k-75k , 1.0% for AGIs $75k-100k , 1.9% for AGIs $100k-200k , 3.2% for AGIs over 200k ) Ordinary dividends: $4,494 (reported on 22.4% of returns )(% of AGI for various income ranges: 3.0% for AGIs below $25k , 1.7% for AGIs $25k-50k , 2.0% for AGIs $50k-75k , 2.1% for AGIs $75k-100k , 3.2% for AGIs $100k-200k , 2.9% for AGIs over 200k ) Net capital gain/loss in AGI: +$3,577 (reported on 16.8% of returns )Here:
+$3,577State:
+$33,493
(% of AGI for various income ranges: 0.2% for AGIs $25k-50k , 0.2% for AGIs $50k-75k , 0.8% for AGIs $75k-100k , 1.6% for AGIs $100k-200k , 10.5% for AGIs over 200k ) Profit/loss from business: +$7,222 (reported on 13.1% of returns )Here:
+$7,222State:
+$10,012
(% of AGI for various income ranges: 8.7% for AGIs below $25k , 1.7% for AGIs $25k-50k , 0.8% for AGIs $50k-75k , 1.3% for AGIs $75k-100k , 1.7% for AGIs $100k-200k ) Taxable individual retirement arrangement distribution: $12,153 (reported on 18.1% of returns )34951:
$12,153Florida:
$21,544
(% of AGI for various income ranges: 5.7% for AGIs below $25k , 4.6% for AGIs $25k-50k , 4.1% for AGIs $50k-75k , 5.6% for AGIs $75k-100k , 9.2% for AGIs $100k-200k ) Total itemized deductions: $19,772 (26% of AGI, reported on 18.5% of returns )Here:
$19,772State:
$25,533
Here:
25.5% of AGIState:
18.0% of AGI
(% of AGI for various income ranges: 8.4% for AGIs below $25k , 8.8% for AGIs $25k-50k , 8.6% for AGIs $50k-75k , 8.7% for AGIs $75k-100k , 8.7% for AGIs $100k-200k , 9.4% for AGIs over 200k ) Charity contributions: $3,582 (reported on 14.5% of returns )(% of AGI for various income ranges: 0.6% for AGIs below $25k , 1.0% for AGIs $25k-50k , 1.2% for AGIs $50k-75k , 1.3% for AGIs $75k-100k , 1.8% for AGIs $100k-200k , 1.7% for AGIs over 200k ) Taxes paid: $3,699 (reported on 18.1% of returns )(% of AGI for various income ranges: 1.2% for AGIs below $25k , 1.3% for AGIs $25k-50k , 1.5% for AGIs $50k-75k , 1.6% for AGIs $75k-100k , 2.0% for AGIs $100k-200k , 2.3% for AGIs over 200k ) Earned income credit: $2,151 (reported on 19.0% of returns )(% of AGI for various income ranges: 5.7% for AGIs below $25k , 0.8% for AGIs $25k-50k ) Percentage of individuals using paid preparers for their 2012 taxes: 49.2%(% for various income ranges: 46.3% for AGIs below $25k , 47.6% for AGIs $25k-50k , 51.8% for AGIs $50k-75k , 54.2% for AGIs $75k-100k , 62.2% for AGIs $100k-200k , 80.0% for AGIs over 200k )
Averages for the 2004 tax year for zip code 34951, filed in 2005:
Average Adjusted Gross Income (AGI) in 2004: $38,183 (Individual Income Tax Returns) Here:
$38,183State:
$50,523
Salary/wage: $32,543 (reported on 70.6% of returns )Here:
$32,543State:
$39,563
(% of AGI for various income ranges: 115.9% for AGIs below $10k , 55.3% for AGIs $10k-25k , 65.9% for AGIs $25k-50k , 67.0% for AGIs $50k-75k , 67.6% for AGIs $75k-100k , 42.2% for AGIs over 100k ) Taxable interest for individuals: $2,168 (reported on 48.0% of returns )This zip code:
$2,168Florida:
$3,211
(% of AGI for various income ranges: 10.7% for AGIs below $10k , 5.1% for AGIs $10k-25k , 2.8% for AGIs $25k-50k , 2.1% for AGIs $50k-75k , 1.5% for AGIs $75k-100k , 2.2% for AGIs over 100k ) Taxable dividends: $3,386 (reported on 30.2% of returns )(% of AGI for various income ranges: 8.9% for AGIs below $10k , 3.2% for AGIs $10k-25k , 1.8% for AGIs $25k-50k , 1.9% for AGIs $50k-75k , 1.9% for AGIs $75k-100k , 4.2% for AGIs over 100k ) Net capital gain/loss: +$9,943 (reported on 23.2% of returns )Here:
+$9,943State:
+$27,205
(% of AGI for various income ranges: -8.3% for AGIs below $10k , -1.0% for AGIs $10k-25k , 1.1% for AGIs $25k-50k , 2.5% for AGIs $50k-75k , 3.3% for AGIs $75k-100k , 21.5% for AGIs over 100k ) Profit/loss from business: +$7,505 (reported on 12.2% of returns )Here:
+$7,505State:
+$10,634
(% of AGI for various income ranges: 6.8% for AGIs below $10k , 4.2% for AGIs $10k-25k , 2.4% for AGIs $25k-50k , 1.6% for AGIs $50k-75k , 1.5% for AGIs $75k-100k , 2.4% for AGIs over 100k ) IRA payment deduction: $3,399 (reported on 2.7% of returns )34951:
$3,399Florida:
$3,082
(% of AGI for various income ranges: 0.3% for AGIs $10k-25k , 0.3% for AGIs $25k-50k , 0.2% for AGIs $50k-75k , 0.3% for AGIs $75k-100k , 0.1% for AGIs over 100k ) Self-employed pension: $4,182 (reported on 0.2% of returns )Here:
$4,182Florida:
$15,857
Total itemized deductions: $16,517 (27% of AGI, reported on 24.4% of returns )Here:
$16,517State:
$20,370
Here:
27.2% of AGIState:
20.7% of AGI
(% of AGI for various income ranges: 24.7% for AGIs below $10k , 10.3% for AGIs $10k-25k , 11.3% for AGIs $25k-50k , 11.7% for AGIs $50k-75k , 9.3% for AGIs $75k-100k , 8.5% for AGIs over 100k ) Charity contributions deductions: $2,757 (4% of AGI, reported on 19.9% of returns )Here:
4.3% of AGIState:
3.8% of AGI
(% of AGI for various income ranges: 0.9% for AGIs below $10k , 0.9% for AGIs $10k-25k , 1.1% for AGIs $25k-50k , 1.4% for AGIs $50k-75k , 1.5% for AGIs $75k-100k , 2.1% for AGIs over 100k ) Total tax: $4,949 (reported on 75.0% of returns )(% of AGI for various income ranges: 3.5% for AGIs below $10k , 3.5% for AGIs $10k-25k , 6.6% for AGIs $25k-50k , 8.8% for AGIs $50k-75k , 11.2% for AGIs $75k-100k , 17.3% for AGIs over 100k ) Earned income credit: $1,616 (reported on 12.7% of returns )Percentage of individuals using paid preparers for their 2004 taxes: 60.3%(% for various income ranges: 54.0% for AGIs below $10k , 61.6% for AGIs $10k-25k , 60.6% for AGIs $25k-50k , 60.9% for AGIs $50k-75k , 61.6% for AGIs $75k-100k , 70.3% for AGIs over 100k )
Estimated median household income in 2022: This zip code:
$58,031Florida:
$69,303
Nearest zip codes: 34946 ,
32962 ,
32968 ,
34947 ,
32960 ,
34950 .
Lakewood Park Zip Code Map
Percentage of family households: This zip code:
31.4%Florida:
41.2%
Percentage of households with unmarried partners: This zip code:
6.1%Florida:
46.7%
Likely homosexual households (counted as self-reported same-sex unmarried-partner households)
Lesbian couples: 0.0% of all households Gay men: 0.2% of all households
Household received Food Stamps/SNAP in the past 12 months: 744Household did not receive Food Stamps/SNAP in the past 12 months: 6,807
Women who had a birth in the past 12 months: 234 (105 now married , 122 unmarried) Women who did not have a birth in the past 12 months: 2,364 (657 now married , 1,705 unmarried)
Housing units in zip code 34951 with a mortgage: 2,869 (234
second mortgage , 226
both second mortgage and home equity loan )
Houses without a mortgage: 83
Median monthly owner costs for units with a mortgage: $1,323
Median monthly owner costs for units without a mortgage: $406
Residents with income below the poverty level in 2022:
This zip code:
12.5%Whole state:
12.7%
Residents with income below 50% of the poverty level in 2022:
This zip code:
6.0%Whole state:
6.6%
Median number of rooms in houses and condos: Median number of rooms in apartments:
Year house built (houses)
24 2020 or later983 2010 to 20191,723 2000 to 20091,598 1990 to 19992,605 1980 to 1989986 1970 to 1979226 1960 to 1969191 1950 to 19590 1940 to 194990 1939 or earlier
Zip code 34951 household income distribution in 2022 364 Less than $10,000147 $10,000 to $14,999298 $15,000 to $19,999619 $20,000 to $24,999306 $25,000 to $29,999242 $30,000 to $34,999240 $35,000 to $39,999432 $40,000 to $44,999450 $45,000 to $49,999851 $50,000 to $59,999922 $60,000 to $74,999899 $75,000 to $99,999673 $100,000 to $124,999335 $125,000 to $149,999441 $150,000 to $199,999246 $200,000 or moreEstimate of home value of owner-occupied houses/condos in 2022 in zip code 34951 184 Less than $10,000146 $10,000 to $14,999118 $15,000 to $19,999234 $20,000 to $24,999112 $25,000 to $29,999129 $30,000 to $34,99959 $35,000 to $39,999194 $40,000 to $49,99932 $50,000 to $59,99965 $60,000 to $69,99935 $70,000 to $79,999138 $80,000 to $89,99927 $90,000 to $99,999123 $100,000 to $124,999261 $125,000 to $149,999302 $150,000 to $174,999317 $175,000 to $199,999697 $200,000 to $249,999522 $250,000 to $299,9991,187 $300,000 to $399,999355 $400,000 to $499,999211 $500,000 to $749,99962 $750,000 to $999,99915 $1,000,000 to $1,499,99932 $2,000,000 or moreRent paid by renters in 2022 in zip code 34951 37 $150 to $19950 $300 to $34913 $450 to $49917 $550 to $59930 $650 to $69979 $700 to $74915 $750 to $799129 $800 to $899149 $900 to $999140 $1,000 to $1,249157 $1,250 to $1,499154 $1,500 to $1,99963 No cash rent
Median gross rent in 2022: $1,205.
Median price asked for vacant for-sale houses and condos in 2022: $282,017.
Estimated median house (or condo) value in 2022 for: White Non-Hispanic householders: $298,258Black or African American householders: $216,847American Indian or Alaska Native householders: $240,530Asian householders: $740,095Some other race householders: $203,526Two or more races householders: $338,593Hispanic or Latino householders: $234,240Estimated median house or condo value in 2022: $241,641
34951:
$241,641Florida:
$354,100
Lower value quartile - upper value quartile: $107,900 - $351,158
Mean price in 2022: Detached houses: $227,075Here:
$227,075State:
$500,941
Townhouses or other attached units: $566,609Here:
$566,609State:
$370,869
In 5-or-more-unit structures: $469,615Here:
$469,615State:
$447,145
Mobile homes: $66,293Here:
$66,293State:
$113,202
Housing units in structures:
One, detached: 6,091One, attached: 111Two: 533 or 4: 2055 to 9: 19110 to 19: 2120 to 49: 4650 or more: 41Mobile homes: 1,738Boats, RVs, vans, etc.: 23Unemployment : 3.4%
Means of transportation to work in zip code 34951 81.0% 5,811 Drove a car alone8.7% 621 Carpooled0.0% 2 Bus or trolley bus0.4% 27 Bicycle0.9% 61 Other means5.4% 391 Worked at homeTravel time to work (commute) in zip code 34951 107 Less than 5 minutes212 5 to 9 minutes388 10 to 14 minutes881 15 to 19 minutes1,430 20 to 24 minutes505 25 to 29 minutes1,055 30 to 34 minutes112 35 to 39 minutes589 40 to 44 minutes170 45 to 59 minutes608 60 to 89 minutes479 90 or more minutes
Percentage of zip code residents living and working in this county: 51.9%
Household type by relationship:
Households: 17,328
Male householders: 4,432 (1,253 living alone ), Female householders: 3,094 (1,051 living alone )3,591 spouses (3,470 opposite-sex spouses ), 826 unmarried partners , (778 opposite-sex unmarried partners ), 3,339 children (3,167 natural , 107 adopted , 71 stepchildren ), 267 grandchildren , 245 brothers or sisters , 273 parents , 0 foster children , 416 other relatives , 880 non-relatives In group quarters: 35 (-1 institutionalized population )
Size of family households: 2,815 2-persons , 786 3-persons , 445 4-persons , 133 5-persons , 89 6-persons , 179 7-or-more-persons
Size of nonfamily households: 2,301 1-person , 707 2-persons , 22 3-persons , 96 4-persons
1,318 married couples with children. single-parent households (171 men , 729 women ).
86.6% of residents of 34951 zip code speak English at home. of residents speak Spanish at home (62% very well, 17% well, 21% not well ).of residents speak other Indo-European language at home (52% very well, 46% well, 3% not well ).of residents speak Asian or Pacific Island language at home (15% very well, 38% well, 47% not well ).of residents speak other language at home (100% very well ).
Foreign born population: 1,834 (10.6%)
(65.2%
of them are naturalized citizens )
This zip code:
10.6%Whole state:
21.7%
13% Barbados 11% Honduras 9% Greece 9% Chile 8% Malaysia 4% Denmark 4% Eritrea 28% American 10% Italian 9% English 7% Irish 7% German 4% European 2% Polish
Year of entry for the foreign-born population
280 2010 or later 242 2000 to 2009 285 1990 to 1999 1,035 Before 1990
Facilities with environmental interests located in this zip code:
LAKEWOOD PARK ELEMENTARY SCHOOL (7800 INDRIO RD in FORT PIERCE, FL)
(Geographic Names Information System) (National Center for Education Statistics) - STATE ID-0231 Organizations: ST. LUCIE COUNTY SCHOOL DISTRICT (SCHOOL DISTRICT)
LAKEWOOD PARK AT CAPRON TRAILS (5990 EMERSON AVE in FT PIERCE, FL)
National Pollutant Discharge Elimination System NON-MAJOR (Tracking pollutant discharge elimination systems) - permit Organizations: JOSEPH CERRONE (CONTACT/OWNER)
Alternative names: SWEETWATER BY DEL WEBB PHASE I
MIKEL LOGISTICS (WHEELER TERRACE in FORT PIERCE, FL)
National Pollutant Discharge Elimination System NON-MAJOR (Tracking pollutant discharge elimination systems) - permit Organizations: WALTER HOBIN (CONTACT/OWNER)
OAKBRIDGE SUBDIVISION (6026 INDRIO RD. # 1 in FT. PEIRCE, FL)
National Pollutant Discharge Elimination System NON-MAJOR (Tracking pollutant discharge elimination systems) - permit Organizations: MICHAEL CHAFFIN (CONTACT/OWNER)
PORTOFINO SHORES (INTERSECTION 713 & INDIAN PINE in PORT ST. LUCIE, FL)
National Pollutant Discharge Elimination System NON-MAJOR (Tracking pollutant discharge elimination systems) - permit Organizations: EDWARD ABBO (CONTACT/OWNER)
SEMINOLE ACRES SUBDIVISION (SEMINOLE ROAD in FORT PIERCE, FL)
National Pollutant Discharge Elimination System NON-MAJOR (Tracking pollutant discharge elimination systems) - permit Organizations: JEFFREY HARDWICK (CONTACT/OWNER)
AMOCO SERVICE STATION #60508 (1889 N US HWY 1 in FORT PIERCE, FL)
Small Quantity Generators, between 100 kg and 1000 kg of hazardous waste/month (Resource Conservation and Recovery Act (tracking hazardous waste)) - notification Organizations: ACA MGMNT SERV (CONTACT/OWNER)
AFFORDABLE POOL SERVICE (5215 TURNPIKE FEEDER RD in FT PIERCE, FL)
COMPLIANCE ACTIVITY (Tracking inspections of insecticide, fungicide, and rodenticide, and toxic substances)
95.8% Electricity 2.3% Utility gas 1.4% No fuel used
Population in 1990: 6,821. Population change in the 1990s: +5,971 (+87.5%).
Place of birth for U.S.-born residents:
This state: 5,921Northeast: 4,548Midwest: 2,651South: 1,684West: 533
60% of the 34951 zip code residents lived in the same house 5 years ago.
Out of people who lived in different houses, 46% lived in this county.
Out of people who lived in different counties, 50% lived in Florida.
90% of the 34951 zip code residents lived in the same house 1 year ago.
Out of people who lived in different houses, 44% moved from this county.
Out of people who lived in different houses, 34% moved from different county within same state.
Out of people who lived in different houses, 17% moved from different state.
Out of people who lived in different houses, 4% moved from abroad.
Private vs. public school enrollment:
Students in private schools in grades 1 to 8 (elementary and middle school): 283
Students in private schools in grades 9 to 12 (high school): 220
Students in private undergraduate colleges: 16
Occupation by median earnings in the past 12 months ($)
82,403 Computer and mathematical occupations 80,224 Arts, design, entertainment, sports, and media occupations 77,904 Law enforcement workers including supervisors 71,538 Management occupations 53,627 Fire fighting and prevention, and other protective service workers including supervisors 44,864 Construction and extraction occupations
Companies with federal contracts located in this zip code:
NJB PROVISIONS, INC (7445 COMMERCIAL CIR in FORT PIERCE, FL; small business) in 21 contracts from 2004 to 2005
Contracts for Fruits and Vegetables by Defense Logistics AgencySigned by year: 2000: $0; 2001: $0; 2002: $0; 2003: $0; 2004: $71,950; 2005: $69,883; 2006: $0.
Biggest contracts: with Defense Logistics Agency for Fruits and Vegetables. Signed on 2004-10-27. Completion date: 2004-10-27.
, same as above. Signed on 2004-10-29. Completion date: 2004-10-29.
, same as above. Signed on 2004-10-07. Completion date: 2004-10-07.
, same as above. Signed on 2005-10-05. Completion date: 2005-10-05.
Top industries in this zip code by the number of employees in 2005:
Wholesale Trade: Other Miscellaneous Nondurable Goods Merchant Wholesalers (100-249 employees: 1 establishment)Wholesale Trade: Fresh Fruit and Vegetable Merchant Wholesalers (50-99: 1, 10-19: 1)Information: Software Publishers (50-99: 1)Real Estate and Rental and Leasing: Lessors of Other Real Estate Property (20-49: 2)Accommodation and Food Services: Limited-Service Restaurants (20-49: 1, 10-19: 1, 5-9: 1)Arts, Entertainment, and Recreation: Golf Courses and Country Clubs (20-49: 1, 10-19: 1, 5-9: 1)Wholesale Trade: Service Establishment Equipment and Supplies Merchant Wholesalers (20-49: 1, 10-19: 1)
People in group quarters in 2010:
21 people in group homes intended for adults
3 people in residential treatment centers for adults
People in group quarters in 2000:
42 people in other noninstitutional group quarters
Fatal accident statistics in 2014:
Fatal accident count: 4Vehicles involved in fatal accidents: 7Fatal accidents caused by drunken drivers: 1Fatalities: 5Persons involved in fatal accidents: 9Pedestrians involved in fatal accidents: 1
Fatal accident statistics in 2013:
Fatal accident count: 1Vehicles involved in fatal accidents: 2Fatal accidents caused by drunken drivers: 0Fatalities: 2Persons involved in fatal accidents: 5Pedestrians involved in fatal accidents: 0
Home Mortgage Disclosure Act Aggregated Statistics For Year 2009(Based on 2 full and 4 partial tracts) A) FHA, FSA/RHS & VA B) Conventional C) Refinancings D) Home Improvement Loans F) Non-occupant Loans on G) Loans On Manufactured Number Average Value Number Average Value Number Average Value Number Average Value Number Average Value Number Average Value
LOANS ORIGINATED 102 $86,099 58 $69,184 85 $104,433 18 $9,704 31 $68,608 6 $39,388 APPLICATIONS APPROVED, NOT ACCEPTED 8 $89,865 4 $87,758 11 $91,218 4 $15,625 3 $84,293 0 $0 APPLICATIONS DENIED 34 $75,212 40 $66,262 97 $111,965 37 $11,647 24 $91,003 8 $25,576 APPLICATIONS WITHDRAWN 12 $91,263 11 $89,873 64 $101,953 0 $0 9 $87,686 0 $0 FILES CLOSED FOR INCOMPLETENESS 3 $67,723 2 $54,420 10 $148,103 1 $52,250 2 $195,705 0 $0
Aggregated Statistics For Year 2008(Based on 2 full and 4 partial tracts) A) FHA, FSA/RHS & VA B) Conventional C) Refinancings D) Home Improvement Loans F) Non-occupant Loans on G) Loans On Manufactured Number Average Value Number Average Value Number Average Value Number Average Value Number Average Value Number Average Value
LOANS ORIGINATED 86 $116,732 96 $109,170 131 $105,208 26 $16,055 44 $114,812 1 $20,080 APPLICATIONS APPROVED, NOT ACCEPTED 1 $183,040 13 $113,822 43 $120,452 5 $39,482 13 $114,525 1 $39,710 APPLICATIONS DENIED 29 $126,715 64 $134,858 151 $143,126 27 $49,642 47 $147,019 7 $32,637 APPLICATIONS WITHDRAWN 10 $139,864 15 $110,939 70 $125,951 4 $120,818 15 $131,675 0 $0 FILES CLOSED FOR INCOMPLETENESS 1 $98,540 7 $132,351 26 $146,086 0 $0 2 $105,965 0 $0
Aggregated Statistics For Year 2007(Based on 2 full and 4 partial tracts) A) FHA, FSA/RHS & VA B) Conventional C) Refinancings D) Home Improvement Loans F) Non-occupant Loans on G) Loans On Manufactured Number Average Value Number Average Value Number Average Value Number Average Value Number Average Value Number Average Value
LOANS ORIGINATED 25 $168,812 256 $144,788 480 $139,088 54 $62,745 113 $154,749 11 $42,656 APPLICATIONS APPROVED, NOT ACCEPTED 2 $176,735 59 $138,770 132 $141,832 10 $51,341 25 $170,264 1 $31,860 APPLICATIONS DENIED 12 $190,398 119 $180,264 465 $184,554 71 $83,385 92 $196,713 7 $42,241 APPLICATIONS WITHDRAWN 0 $0 35 $163,041 182 $151,248 9 $87,730 9 $181,067 1 $145,000 FILES CLOSED FOR INCOMPLETENESS 0 $0 8 $206,186 67 $159,987 1 $34,580 5 $157,262 0 $0
Aggregated Statistics For Year 2006(Based on 2 full and 4 partial tracts) A) FHA, FSA/RHS & VA B) Conventional C) Refinancings D) Home Improvement Loans F) Non-occupant Loans on G) Loans On Manufactured Number Average Value Number Average Value Number Average Value Number Average Value Number Average Value Number Average Value
LOANS ORIGINATED 26 $200,818 831 $145,388 669 $141,096 137 $78,321 381 $150,144 16 $40,616 APPLICATIONS APPROVED, NOT ACCEPTED 2 $203,695 154 $141,942 178 $133,574 22 $25,235 90 $160,204 7 $41,626 APPLICATIONS DENIED 2 $248,625 332 $151,951 418 $160,599 75 $98,617 142 $164,881 13 $28,087 APPLICATIONS WITHDRAWN 2 $123,815 118 $145,027 349 $143,435 26 $138,023 72 $162,137 2 $62,625 FILES CLOSED FOR INCOMPLETENESS 0 $0 25 $145,856 111 $166,245 3 $152,237 16 $142,369 0 $0
Aggregated Statistics For Year 2005(Based on 2 full and 4 partial tracts) A) FHA, FSA/RHS & VA B) Conventional C) Refinancings D) Home Improvement Loans F) Non-occupant Loans on G) Loans On Manufactured Number Average Value Number Average Value Number Average Value Number Average Value Number Average Value Number Average Value
LOANS ORIGINATED 11 $183,206 1,070 $146,663 795 $126,021 126 $56,612 442 $155,134 19 $59,013 APPLICATIONS APPROVED, NOT ACCEPTED 2 $158,760 119 $152,879 127 $123,749 21 $65,672 44 $145,786 7 $61,894 APPLICATIONS DENIED 2 $351,470 351 $144,107 372 $134,043 65 $74,055 122 $151,446 14 $50,037 APPLICATIONS WITHDRAWN 2 $187,720 134 $146,895 366 $139,329 43 $85,682 51 $144,748 1 $65,250 FILES CLOSED FOR INCOMPLETENESS 4 $148,278 34 $136,439 56 $135,569 8 $43,185 20 $120,753 0 $0
Aggregated Statistics For Year 2004(Based on 2 full and 4 partial tracts) A) FHA, FSA/RHS & VA B) Conventional C) Refinancings D) Home Improvement Loans F) Non-occupant Loans on G) Loans On Manufactured Number Average Value Number Average Value Number Average Value Number Average Value Number Average Value Number Average Value
LOANS ORIGINATED 46 $134,244 707 $119,322 596 $96,314 123 $65,225 290 $110,348 23 $45,080 APPLICATIONS APPROVED, NOT ACCEPTED 0 $0 87 $124,630 83 $97,162 13 $55,036 32 $130,194 4 $36,192 APPLICATIONS DENIED 5 $157,682 132 $125,113 336 $106,614 96 $36,163 44 $124,619 16 $42,373 APPLICATIONS WITHDRAWN 6 $123,813 88 $133,958 236 $103,066 26 $41,623 23 $116,398 2 $58,560 FILES CLOSED FOR INCOMPLETENESS 4 $100,848 37 $137,915 78 $96,489 7 $21,420 12 $132,878 0 $0
Aggregated Statistics For Year 2003(Based on 2 full and 4 partial tracts) A) FHA, FSA/RHS & VA B) Conventional C) Refinancings D) Home Improvement Loans E) Loans on Dwellings For 5+ Families F) Non-occupant Loans on Number Average Value Number Average Value Number Average Value Number Average Value Number Average Value Number Average Value
LOANS ORIGINATED 60 $113,863 402 $79,395 818 $77,925 56 $32,327 2 $249,625 127 $74,828 APPLICATIONS APPROVED, NOT ACCEPTED 2 $107,840 32 $92,838 142 $79,494 13 $25,431 0 $0 7 $77,266 APPLICATIONS DENIED 8 $77,134 94 $70,636 465 $79,064 103 $19,137 0 $0 23 $60,414 APPLICATIONS WITHDRAWN 2 $88,865 48 $97,650 162 $82,058 8 $19,720 0 $0 11 $89,437 FILES CLOSED FOR INCOMPLETENESS 4 $92,860 7 $77,934 29 $78,239 3 $19,670 0 $0 0 $0
Aggregated Statistics For Year 2002(Based on 2 full and 4 partial tracts) A) FHA, FSA/RHS & VA B) Conventional C) Refinancings D) Home Improvement Loans F) Non-occupant Loans on Number Average Value Number Average Value Number Average Value Number Average Value Number Average Value
LOANS ORIGINATED 82 $83,636 403 $75,000 490 $72,248 85 $14,166 96 $61,874 APPLICATIONS APPROVED, NOT ACCEPTED 2 $77,885 36 $63,464 153 $65,291 11 $15,961 14 $57,716 APPLICATIONS DENIED 10 $89,665 56 $75,157 319 $63,724 78 $14,726 17 $34,306 APPLICATIONS WITHDRAWN 2 $48,925 30 $59,742 160 $69,555 17 $30,797 11 $58,318 FILES CLOSED FOR INCOMPLETENESS 6 $78,215 3 $118,033 40 $64,804 0 $0 0 $0
Aggregated Statistics For Year 2001(Based on 2 full and 4 partial tracts) A) FHA, FSA/RHS & VA B) Conventional C) Refinancings D) Home Improvement Loans F) Non-occupant Loans on Number Average Value Number Average Value Number Average Value Number Average Value Number Average Value
LOANS ORIGINATED 92 $79,409 261 $68,252 313 $66,385 68 $13,056 66 $60,465 APPLICATIONS APPROVED, NOT ACCEPTED 2 $80,880 22 $62,050 54 $60,061 15 $21,957 6 $65,555 APPLICATIONS DENIED 3 $57,977 54 $53,800 243 $56,872 61 $10,939 11 $60,881 APPLICATIONS WITHDRAWN 4 $33,950 19 $72,261 118 $64,035 12 $30,787 9 $63,002 FILES CLOSED FOR INCOMPLETENESS 0 $0 2 $72,890 28 $70,557 0 $0 2 $64,905
Aggregated Statistics For Year 2000(Based on 2 full and 4 partial tracts) A) FHA, FSA/RHS & VA B) Conventional C) Refinancings D) Home Improvement Loans F) Non-occupant Loans on Number Average Value Number Average Value Number Average Value Number Average Value Number Average Value
LOANS ORIGINATED 75 $75,090 271 $63,539 166 $45,945 140 $11,724 35 $50,077 APPLICATIONS APPROVED, NOT ACCEPTED 0 $0 33 $50,122 34 $56,490 15 $15,572 6 $39,940 APPLICATIONS DENIED 9 $86,486 69 $62,604 158 $51,281 106 $14,571 2 $77,885 APPLICATIONS WITHDRAWN 2 $82,875 24 $70,543 84 $53,588 12 $25,702 5 $27,612 FILES CLOSED FOR INCOMPLETENESS 0 $0 16 $76,348 22 $58,533 2 $4,990 1 $32,350
Aggregated Statistics For Year 1999(Based on 2 full and 2 partial tracts) A) FHA, FSA/RHS & VA B) Conventional C) Refinancings D) Home Improvement Loans F) Non-occupant Loans on Number Average Value Number Average Value Number Average Value Number Average Value Number Average Value
LOANS ORIGINATED 38 $75,908 138 $65,192 177 $55,059 61 $11,430 43 $55,414 APPLICATIONS APPROVED, NOT ACCEPTED 1 $63,820 14 $48,749 34 $54,803 3 $16,953 4 $44,168 APPLICATIONS DENIED 3 $67,143 36 $50,642 110 $52,310 47 $13,471 7 $35,313 APPLICATIONS WITHDRAWN 2 $75,290 7 $70,691 72 $59,740 12 $27,907 3 $36,697 FILES CLOSED FOR INCOMPLETENESS 0 $0 3 $69,343 18 $80,646 0 $0 0 $0
Detailed HMDA statistics for the following Tracts:
0008.00
,
0011.01 ,
0011.02
Private Mortgage Insurance Companies Aggregated Statistics For Year 2009(Based on 2 full and 4 partial tracts) A) Conventional B) Refinancings C) Non-occupant Loans on Number Average Value Number Average Value Number Average Value
LOANS ORIGINATED 3 $85,047 0 $0 0 $0 APPLICATIONS APPROVED, NOT ACCEPTED 6 $177,640 0 $0 1 $66,590 APPLICATIONS DENIED 0 $0 1 $160,620 0 $0 APPLICATIONS WITHDRAWN 0 $0 0 $0 0 $0 FILES CLOSED FOR INCOMPLETENESS 0 $0 0 $0 0 $0
Aggregated Statistics For Year 2008(Based on 2 full and 4 partial tracts) A) Conventional B) Refinancings C) Non-occupant Loans on Number Average Value Number Average Value Number Average Value
LOANS ORIGINATED 48 $118,753 9 $171,820 12 $100,658 APPLICATIONS APPROVED, NOT ACCEPTED 17 $156,067 18 $202,738 5 $225,128 APPLICATIONS DENIED 6 $145,138 0 $0 0 $0 APPLICATIONS WITHDRAWN 1 $202,750 2 $227,660 3 $175,360 FILES CLOSED FOR INCOMPLETENESS 3 $212,980 0 $0 2 $181,640
Aggregated Statistics For Year 2007(Based on 2 full and 4 partial tracts) A) Conventional B) Refinancings C) Non-occupant Loans on Number Average Value Number Average Value Number Average Value
LOANS ORIGINATED 90 $165,313 37 $194,461 17 $183,328 APPLICATIONS APPROVED, NOT ACCEPTED 19 $191,115 20 $196,198 5 $185,924 APPLICATIONS DENIED 4 $229,130 6 $208,687 0 $0 APPLICATIONS WITHDRAWN 7 $117,249 12 $190,381 4 $121,818 FILES CLOSED FOR INCOMPLETENESS 0 $0 1 $200,770 1 $200,770
Aggregated Statistics For Year 2006(Based on 2 full and 4 partial tracts) A) Conventional B) Refinancings C) Non-occupant Loans on Number Average Value Number Average Value Number Average Value
LOANS ORIGINATED 96 $186,640 13 $179,364 20 $157,835 APPLICATIONS APPROVED, NOT ACCEPTED 16 $191,816 4 $194,708 7 $181,767 APPLICATIONS DENIED 6 $169,153 0 $0 2 $129,030 APPLICATIONS WITHDRAWN 6 $116,158 0 $0 2 $122,815 FILES CLOSED FOR INCOMPLETENESS 1 $218,620 0 $0 1 $218,620
Aggregated Statistics For Year 2005(Based on 2 full and 4 partial tracts) A) Conventional B) Refinancings C) Non-occupant Loans on Number Average Value Number Average Value Number Average Value
LOANS ORIGINATED 247 $177,494 28 $171,039 89 $176,962 APPLICATIONS APPROVED, NOT ACCEPTED 41 $151,666 8 $156,765 15 $147,462 APPLICATIONS DENIED 7 $173,537 0 $0 1 $234,230 APPLICATIONS WITHDRAWN 14 $204,466 0 $0 5 $205,642 FILES CLOSED FOR INCOMPLETENESS 0 $0 2 $206,690 0 $0
Aggregated Statistics For Year 2004(Based on 2 full and 4 partial tracts) A) Conventional B) Refinancings C) Non-occupant Loans on D) Loans On Manufactured Number Average Value Number Average Value Number Average Value Number Average Value
LOANS ORIGINATED 320 $146,894 34 $114,416 122 $140,524 0 $0 APPLICATIONS APPROVED, NOT ACCEPTED 43 $131,486 28 $93,641 16 $129,631 0 $0 APPLICATIONS DENIED 11 $131,305 0 $0 10 $140,673 1 $56,440 APPLICATIONS WITHDRAWN 69 $163,367 4 $118,322 29 $157,770 0 $0 FILES CLOSED FOR INCOMPLETENESS 2 $115,825 0 $0 0 $0 0 $0
Aggregated Statistics For Year 2003(Based on 2 full and 4 partial tracts) A) Conventional B) Refinancings C) Non-occupant Loans on Number Average Value Number Average Value Number Average Value
LOANS ORIGINATED 154 $95,419 88 $93,822 51 $84,687 APPLICATIONS APPROVED, NOT ACCEPTED 24 $92,196 21 $81,169 6 $44,600 APPLICATIONS DENIED 8 $105,591 9 $110,929 4 $95,358 APPLICATIONS WITHDRAWN 13 $92,058 10 $67,698 2 $89,865 FILES CLOSED FOR INCOMPLETENESS 2 $111,830 2 $125,810 0 $0
Aggregated Statistics For Year 2002(Based on 2 full and 4 partial tracts) A) Conventional B) Refinancings C) Non-occupant Loans on Number Average Value Number Average Value Number Average Value
LOANS ORIGINATED 148 $80,532 48 $84,852 20 $79,213 APPLICATIONS APPROVED, NOT ACCEPTED 17 $69,991 24 $73,722 2 $73,890 APPLICATIONS DENIED 15 $63,249 2 $73,890 10 $58,113 APPLICATIONS WITHDRAWN 9 $48,483 2 $89,865 0 $0 FILES CLOSED FOR INCOMPLETENESS 0 $0 0 $0 0 $0
Aggregated Statistics For Year 2001(Based on 2 full and 4 partial tracts) A) Conventional B) Refinancings C) Non-occupant Loans on Number Average Value Number Average Value Number Average Value
LOANS ORIGINATED 85 $76,237 38 $76,049 19 $58,744 APPLICATIONS APPROVED, NOT ACCEPTED 22 $60,459 10 $74,688 4 $50,425 APPLICATIONS DENIED 10 $41,737 4 $96,355 2 $35,945 APPLICATIONS WITHDRAWN 0 $0 10 $75,686 0 $0 FILES CLOSED FOR INCOMPLETENESS 0 $0 0 $0 0 $0
Aggregated Statistics For Year 2000(Based on 2 full and 4 partial tracts) A) Conventional B) Refinancings C) Non-occupant Loans on Number Average Value Number Average Value Number Average Value
LOANS ORIGINATED 83 $72,838 6 $75,220 4 $62,802 APPLICATIONS APPROVED, NOT ACCEPTED 3 $100,057 6 $71,227 0 $0 APPLICATIONS DENIED 26 $66,669 12 $68,897 6 $49,925 APPLICATIONS WITHDRAWN 10 $79,481 0 $0 0 $0 FILES CLOSED FOR INCOMPLETENESS 2 $92,860 0 $0 0 $0
Aggregated Statistics For Year 1999(Based on 2 full and 2 partial tracts) A) Conventional B) Refinancings C) Non-occupant Loans on Number Average Value Number Average Value Number Average Value
LOANS ORIGINATED 45 $78,220 17 $63,119 6 $61,853 APPLICATIONS APPROVED, NOT ACCEPTED 4 $72,080 2 $85,335 0 $0 APPLICATIONS DENIED 19 $65,930 1 $57,490 0 $0 APPLICATIONS WITHDRAWN 3 $62,887 3 $71,683 0 $0 FILES CLOSED FOR INCOMPLETENESS 1 $56,840 0 $0 0 $0
Detailed PMIC statistics for the following Tracts:
0008.00
,
0011.01 ,
0011.02
2002 - 2018 National Fire Incident Reporting System (NFIRS) incidents See full 2006 National Fire Incident Reporting System statistics for zip code 34951, Florida
Most common first names in zip code 34951 among deceased individuals Name Count Lived (average)
John 115 77.4 years William 95 74.9 years Robert 86 72.5 years Joseph 77 79.7 years Mary 76 80.5 years James 70 77.0 years George 58 77.7 years Charles 55 78.4 years Dorothy 45 80.0 years Helen 40 81.9 years
Most common last names in zip code 34951 among deceased individuals Last name Count Lived (average)
Smith 25 80.7 years Wilson 16 80.7 years Johnson 11 74.8 years Miller 10 69.5 years Martin 10 79.4 years Williams 10 74.2 years White 10 80.0 years Davis 8 77.0 years Brown 8 84.9 years Stewart 7 86.7 years
Businesses in zip code 34951
Name Count Name Count
Advance Auto Parts 1 MasterBrand Cabinets 2 CVS 1 McDonald's 1 Decora Cabinetry 1 Subway 1 Dunkin Donuts 1 U-Haul 1 FedEx 1 UPS 1 H&R Block 1

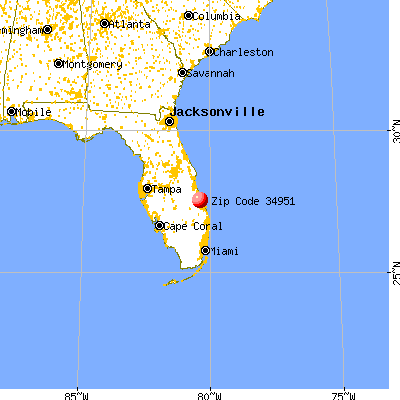


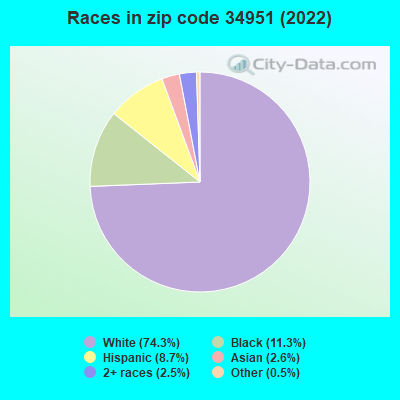


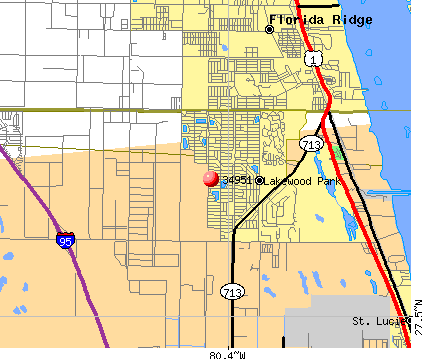 Nearest zip codes: 34946, 32962, 32968, 34947, 32960, 34950.
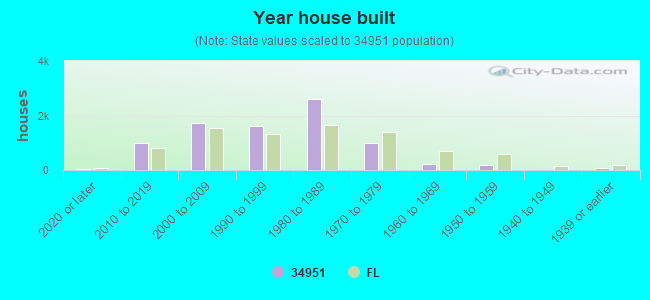


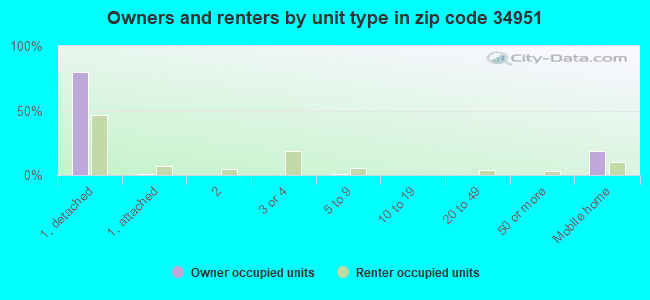
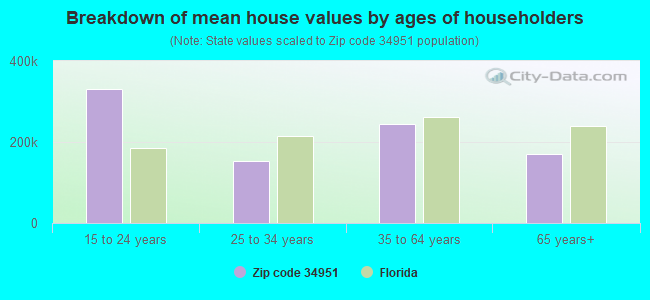


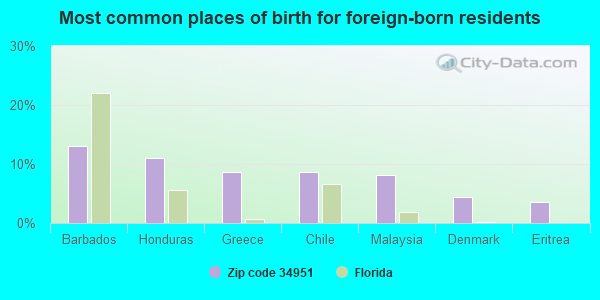
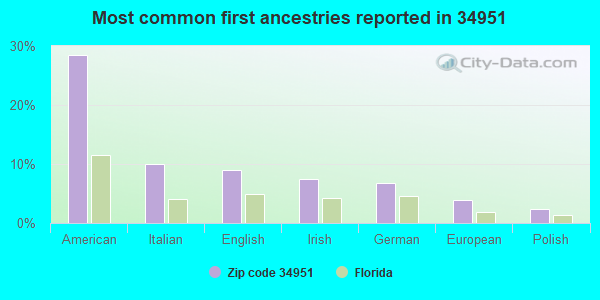
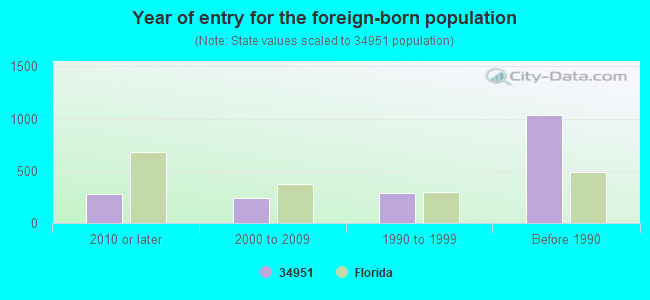


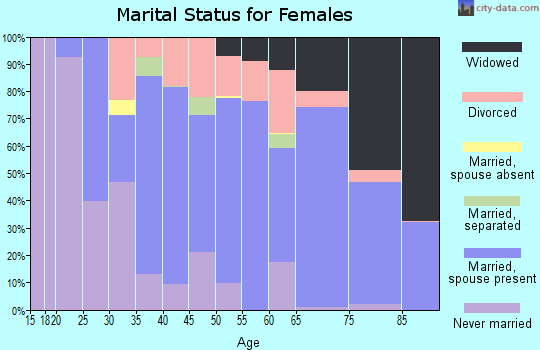
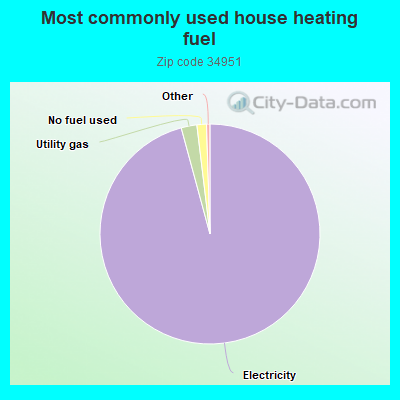
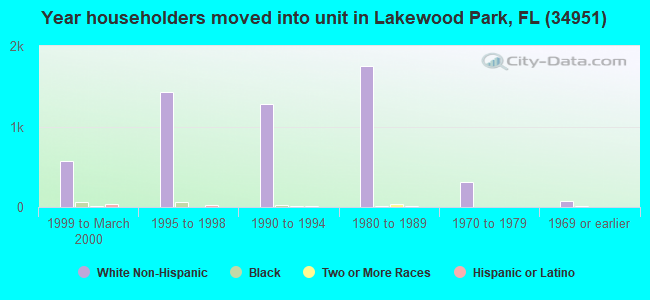
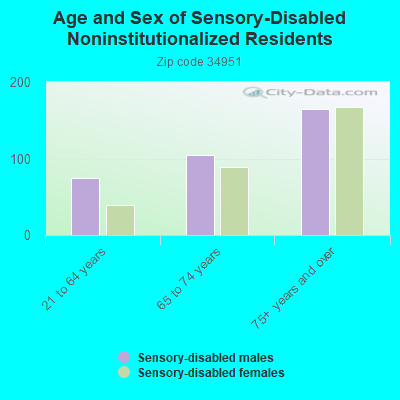
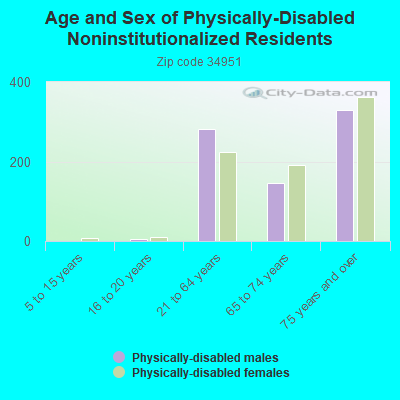
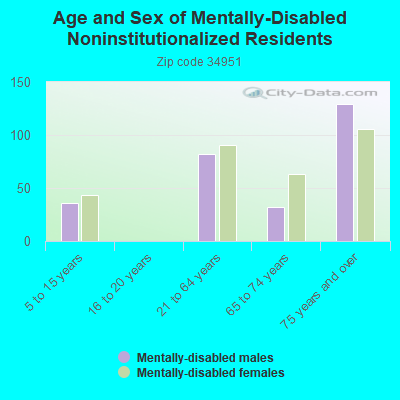
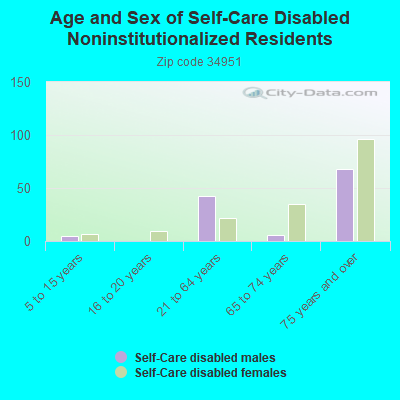
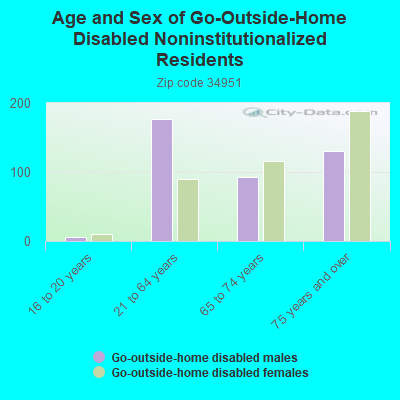
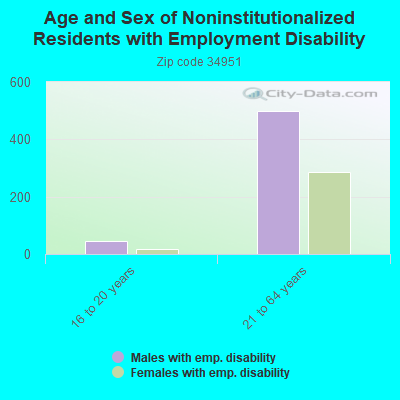
 Based on the data from the years 2002 - 2018 the average number of fire incidents per year is 33. The highest number of reported fires - 69 took place in 2005, and the least - 0 in 2009. The data has a decreasing trend.
 When looking into fire subcategories, the most reports belonged to: Outside Fires (68.1%), and Mobile Property/Vehicle Fires (16.6%).