Estimated zip code population in 2022: 37,121 Zip code population in 2010: 32,390 Zip code population in 2000: 26,955
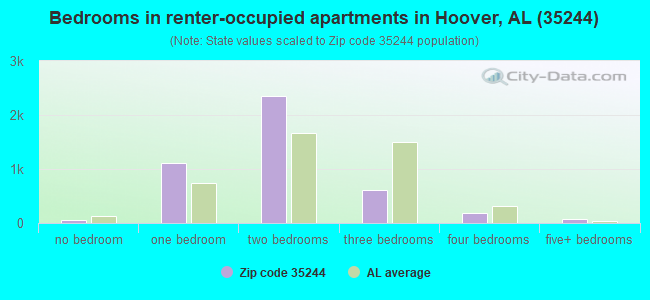
Houses and condos: 15,436 Renter-occupied apartments: 4,394
% of renters here:
30%
State:
30%
March 2022 cost of living index in zip code 35244: 89.2 (less than average, U.S. average is 100)
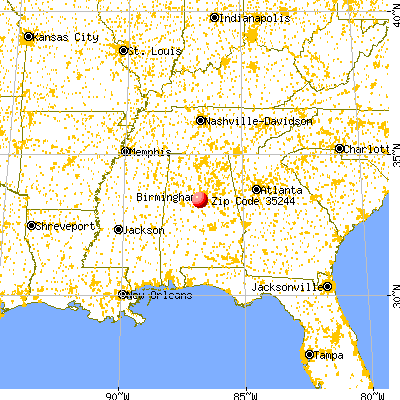
Land area: 21.7 sq. mi. Water area: 0.6 sq. mi.
Population density: 1,712 people per square mile
(low).
OSM Map
General Map
Google Map
MSN Map
OSM Map
General Map
Google Map
MSN Map
OSM Map
General Map
Google Map
MSN Map
OSM Map
General Map
Google Map
MSN Map
Please wait while loading the map...
Real estate property taxes paid for housing units in 2022:
This zip code:
0.5% ($2,094)
Alabama:
0.4% ($718)
Median real estate property taxes paid for housing units with mortgages in 2022: $2,191 (0.5%) Median real estate property taxes paid for housing units with no mortgage in 2022: $1,958 (0.6%)
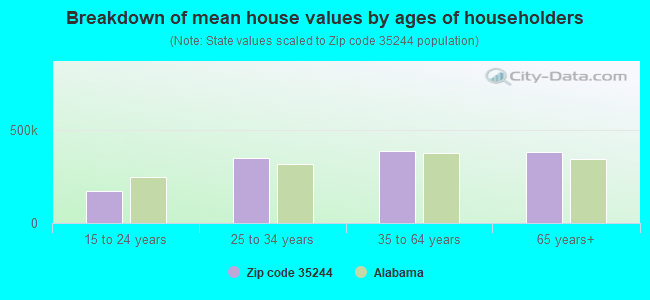
Estimated median house/condo value in 2022: $399,784
35244:
$399,784
Alabama:
$200,900
According to our research of Alabama and other state lists, there were 6 registered sex offenders living in 35244 zip code as of April 27, 2024. The ratio of all residents to sex offenders in zip code 35244 is 5,619 to 1. The ratio of registered sex offenders to all residents in this zip code is much lower than the state average.
Median resident age:
This zip code:
38.6 years
Alabama median age:
39.6 years
Average household size:
This zip code:
2.5 people
Alabama:
2.5 people
Averages for the 2020 tax year for zip code 35244, filed in 2021:
Average Adjusted Gross Income (AGI) in 2020: $105,282 (Individual Income Tax Returns)
Here:
$105,282
State:
$63,984
Salary/wage: $87,545 (reported on 83.2% of returns)
Here:
$87,545
State:
$52,834
(% of AGI for various income ranges: 1226.1% for AGIs below $25k, 3862.9% for AGIs $25k-50k, 6863.1% for AGIs $50k-75k, 9943.0% for AGIs $75k-100k, 19690.9% for AGIs $100k-200k, 81137.9% for AGIs over 200k)
Taxable interest for individuals: $1,946 (reported on 38.5% of returns)
This zip code:
$1,946
Alabama:
$1,615
(% of AGI for various income ranges: 19.6% for AGIs below $25k, 30.8% for AGIs $25k-50k, 58.2% for AGIs $50k-75k, 72.1% for AGIs $75k-100k, 160.2% for AGIs $100k-200k, 1070.2% for AGIs over 200k)
Ordinary dividends: $7,058 (reported on 29.9% of returns)
Here:
$7,058
State:
$7,660
(% of AGI for various income ranges: 44.8% for AGIs below $25k, 73.1% for AGIs $25k-50k, 156.3% for AGIs $50k-75k, 320.4% for AGIs $75k-100k, 453.1% for AGIs $100k-200k, 2923.7% for AGIs over 200k)
Net capital gain/loss in AGI: +$19,332 (reported on 27.3% of returns)
Here:
+$19,332
State:
+$23,528
(% of AGI for various income ranges: 23.5% for AGIs below $25k, 46.6% for AGIs $25k-50k, 86.7% for AGIs $50k-75k, 207.0% for AGIs $75k-100k, 622.4% for AGIs $100k-200k, 11809.5% for AGIs over 200k)
Profit/loss from business: +$17,012 (reported on 19.8% of returns)
Here:
+$17,012
State:
+$9,534
(% of AGI for various income ranges: 94.6% for AGIs below $25k, 84.9% for AGIs $25k-50k, 225.2% for AGIs $50k-75k, 300.6% for AGIs $75k-100k, 824.3% for AGIs $100k-200k, 4760.3% for AGIs over 200k)
Taxable individual retirement arrangement distribution: $30,972 (reported on 11.4% of returns)
35244:
$30,972
Alabama:
$19,004
(% of AGI for various income ranges: 63.0% for AGIs below $25k, 154.6% for AGIs $25k-50k, 341.6% for AGIs $50k-75k, 582.9% for AGIs $75k-100k, 1113.0% for AGIs $100k-200k, 3311.6% for AGIs over 200k)
Self-employed (Keogh) retirement plans: $24,124 (reported on 1.0% of returns)
35244:
$24,124
Alabama:
$26,467
(% of AGI for various income ranges: 43.0% for AGIs $100k-200k, 509.0% for AGIs over 200k)
Total itemized deductions: $38,223 (reported on 17.1% of returns)
Here:
$38,223
State:
$37,338
(% of AGI for various income ranges: 81.8% for AGIs below $25k, 165.3% for AGIs $25k-50k, 462.5% for AGIs $50k-75k, 794.2% for AGIs $75k-100k, 1602.6% for AGIs $100k-200k, 9225.0% for AGIs over 200k)
Charity contributions: $16,321 (reported on 15.5% of returns)
Here:
$16,321
State:
$18,005
(% of AGI for various income ranges: 6.0% for AGIs below $25k, 27.3% for AGIs $25k-50k, 91.4% for AGIs $50k-75k, 210.2% for AGIs $75k-100k, 509.0% for AGIs $100k-200k, 4608.2% for AGIs over 200k)
Taxes paid: $7,711 (reported on 17.0% of returns)
35244:
$7,711
State:
$6,484
(% of AGI for various income ranges: 6.4% for AGIs below $25k, 23.0% for AGIs $25k-50k, 82.2% for AGIs $50k-75k, 168.0% for AGIs $75k-100k, 393.0% for AGIs $100k-200k, 1702.4% for AGIs over 200k)
Earned income credit: $2,106 (reported on 8.4% of returns)
Here:
$2,106
State:
$2,628
(% of AGI for various income ranges: 66.0% for AGIs below $25k, 51.8% for AGIs $25k-50k)
Percentage of individuals using paid preparers for their 2020 taxes: 92.7%
Here:
93%
State:
93%
(% for various income ranges: 90.7% for AGIs below $25k, 93.0% for AGIs $25k-50k, 91.9% for AGIs $50k-75k, 92.8% for AGIs $75k-100k, 93.5% for AGIs $100k-200k, 95.3% for AGIs over 200k)
Averages for the 2012 tax year for zip code 35244, filed in 2013:
Average Adjusted Gross Income (AGI) in 2012: $92,325 (Individual Income Tax Returns)
Here:
$92,325
State:
$52,001
Salary/wage: $77,467 (reported on 85.6% of returns)
Here:
$77,467
State:
$43,822
(% of AGI for various income ranges: 78.4% for AGIs below $25k, 81.9% for AGIs $25k-50k, 74.5% for AGIs $50k-75k, 75.5% for AGIs $75k-100k, 78.5% for AGIs $100k-200k, 62.3% for AGIs over 200k)
Taxable interest for individuals: $1,922 (reported on 42.4% of returns)
This zip code:
$1,922
Alabama:
$1,592
(% of AGI for various income ranges: 1.7% for AGIs below $25k, 0.7% for AGIs $25k-50k, 1.0% for AGIs $50k-75k, 0.9% for AGIs $75k-100k, 0.7% for AGIs $100k-200k, 1.0% for AGIs over 200k)
Ordinary dividends: $5,882 (reported on 30.1% of returns)
Here:
$5,882
State:
$5,697
(% of AGI for various income ranges: 2.6% for AGIs below $25k, 1.6% for AGIs $25k-50k, 1.9% for AGIs $50k-75k, 1.6% for AGIs $75k-100k, 1.5% for AGIs $100k-200k, 2.3% for AGIs over 200k)
Net capital gain/loss in AGI: +$14,389 (reported on 24.1% of returns)
Here:
+$14,389
State:
+$13,286
(% of AGI for various income ranges: 0.2% for AGIs $25k-50k, 0.6% for AGIs $50k-75k, 0.5% for AGIs $75k-100k, 0.9% for AGIs $100k-200k, 8.6% for AGIs over 200k)
Profit/loss from business: +$18,892 (reported on 17.8% of returns)
Here:
+$18,892
State:
+$9,151
(% of AGI for various income ranges: 7.1% for AGIs below $25k, 2.6% for AGIs $25k-50k, 2.8% for AGIs $50k-75k, 2.6% for AGIs $75k-100k, 2.8% for AGIs $100k-200k, 4.7% for AGIs over 200k)
Taxable individual retirement arrangement distribution: $22,865 (reported on 12.4% of returns)
35244:
$22,865
Alabama:
$14,992
(% of AGI for various income ranges: 3.7% for AGIs below $25k, 3.1% for AGIs $25k-50k, 3.8% for AGIs $50k-75k, 4.6% for AGIs $75k-100k, 3.7% for AGIs $100k-200k, 1.9% for AGIs over 200k)
Self-employment retirement plans: $20,678 (reported on 1.2% of returns)
35244:
$20,678
Alabama:
$20,904
(% of AGI for various income ranges: 0.2% for AGIs $25k-50k, 0.1% for AGIs $100k-200k, 0.5% for AGIs over 200k)
Total itemized deductions: $26,046 (18% of AGI, reported on 50.7% of returns)
Here:
$26,046
State:
$21,388
Here:
17.6% of AGI
State:
20.1% of AGI
(% of AGI for various income ranges: 17.2% for AGIs below $25k, 13.6% for AGIs $25k-50k, 16.6% for AGIs $50k-75k, 17.1% for AGIs $75k-100k, 16.1% for AGIs $100k-200k, 11.6% for AGIs over 200k)
Charity contributions: $6,697 (reported on 46.1% of returns)
Here:
$6,697
State:
$5,925
(% of AGI for various income ranges: 1.8% for AGIs below $25k, 2.2% for AGIs $25k-50k, 3.1% for AGIs $50k-75k, 3.2% for AGIs $75k-100k, 3.7% for AGIs $100k-200k, 3.5% for AGIs over 200k)
Taxes paid: $7,947 (reported on 50.7% of returns)
35244:
$7,947
State:
$5,272
(% of AGI for various income ranges: 2.0% for AGIs below $25k, 2.3% for AGIs $25k-50k, 3.8% for AGIs $50k-75k, 4.4% for AGIs $75k-100k, 5.0% for AGIs $100k-200k, 4.5% for AGIs over 200k)
Earned income credit: $2,075 (reported on 9.8% of returns)
Here:
$2,075
State:
$2,646
(% of AGI for various income ranges: 4.7% for AGIs below $25k, 0.8% for AGIs $25k-50k)
Percentage of individuals using paid preparers for their 2012 taxes: 50.4%
Here:
50%
State:
60%
(% for various income ranges: 46.1% for AGIs below $25k, 47.4% for AGIs $25k-50k, 51.3% for AGIs $50k-75k, 49.7% for AGIs $75k-100k, 51.5% for AGIs $100k-200k, 67.4% for AGIs over 200k)
Averages for the 2004 tax year for zip code 35244, filed in 2005:
Average Adjusted Gross Income (AGI) in 2004: $82,852 (Individual Income Tax Returns)
Here:
$82,852
State:
$42,302
Salary/wage: $71,626 (reported on 85.9% of returns)
Here:
$71,626
State:
$36,626
(% of AGI for various income ranges: 196.6% for AGIs below $10k, 74.7% for AGIs $10k-25k, 82.3% for AGIs $25k-50k, 80.4% for AGIs $50k-75k, 80.6% for AGIs $75k-100k, 70.5% for AGIs over 100k)
Taxable interest for individuals: $1,937 (reported on 54.1% of returns)
This zip code:
$1,937
Alabama:
$1,827
(% of AGI for various income ranges: 12.7% for AGIs below $10k, 3.4% for AGIs $10k-25k, 1.6% for AGIs $25k-50k, 1.5% for AGIs $50k-75k, 1.2% for AGIs $75k-100k, 1.1% for AGIs over 100k)
Taxable dividends: $3,349 (reported on 38.2% of returns)
Here:
$3,349
State:
$4,206
(% of AGI for various income ranges: 11.6% for AGIs below $10k, 2.8% for AGIs $10k-25k, 1.4% for AGIs $25k-50k, 1.6% for AGIs $50k-75k, 1.2% for AGIs $75k-100k, 1.5% for AGIs over 100k)
Net capital gain/loss: +$15,730 (reported on 31.4% of returns)
Here:
+$15,730
State:
+$13,031
(% of AGI for various income ranges: -0.6% for AGIs below $10k, 0.1% for AGIs $10k-25k, 0.5% for AGIs $25k-50k, 0.7% for AGIs $50k-75k, 1.1% for AGIs $75k-100k, 8.5% for AGIs over 100k)
Profit/loss from business: +$19,882 (reported on 16.8% of returns)
Here:
+$19,882
State:
+$8,302
(% of AGI for various income ranges: 6.9% for AGIs below $10k, 6.7% for AGIs $10k-25k, 3.1% for AGIs $25k-50k, 3.7% for AGIs $50k-75k, 3.7% for AGIs $75k-100k, 4.1% for AGIs over 100k)
IRA payment deduction: $3,483 (reported on 3.1% of returns)
35244:
$3,483
Alabama:
$3,006
(% of AGI for various income ranges: 0.7% for AGIs below $10k, 0.2% for AGIs $10k-25k, 0.2% for AGIs $25k-50k, 0.2% for AGIs $50k-75k, 0.2% for AGIs $75k-100k, 0.1% for AGIs over 100k)
Self-employed pension: $17,818 (reported on 1.6% of returns)
Here:
$17,818
Alabama:
$17,165
(% of AGI for various income ranges: 0.0% for AGIs $25k-50k, 0.2% for AGIs $50k-75k, 0.2% for AGIs $75k-100k, 0.4% for AGIs over 100k)
Total itemized deductions: $23,159 (18% of AGI, reported on 55.1% of returns)
Here:
$23,159
State:
$17,623
Here:
18.0% of AGI
State:
20.8% of AGI
(% of AGI for various income ranges: 41.8% for AGIs below $10k, 16.3% for AGIs $10k-25k, 18.5% for AGIs $25k-50k, 19.2% for AGIs $50k-75k, 19.9% for AGIs $75k-100k, 13.5% for AGIs over 100k)
Charity contributions deductions: $5,394 (4% of AGI, reported on 51.6% of returns)
Here:
$5,394
State:
$4,768
Here:
4.1% of AGI
State:
5.4% of AGI
(% of AGI for various income ranges: 3.1% for AGIs below $10k, 2.1% for AGIs $10k-25k, 2.6% for AGIs $25k-50k, 3.7% for AGIs $50k-75k, 3.9% for AGIs $75k-100k, 3.3% for AGIs over 100k)
Total tax: $15,687 (reported on 82.3% of returns)
35244:
$15,687
State:
$6,905
(% of AGI for various income ranges: 6.5% for AGIs below $10k, 4.9% for AGIs $10k-25k, 7.5% for AGIs $25k-50k, 9.2% for AGIs $50k-75k, 10.2% for AGIs $75k-100k, 18.9% for AGIs over 100k)
Earned income credit: $1,531 (reported on 5.9% of returns)
Here:
$1,531
State:
$2,048
Percentage of individuals using paid preparers for their 2004 taxes: 52.7%
Here:
53%
State:
65%
(% for various income ranges: 44.5% for AGIs below $10k, 54.4% for AGIs $10k-25k, 53.2% for AGIs $25k-50k, 53.4% for AGIs $50k-75k, 50.5% for AGIs $75k-100k, 57.4% for AGIs over 100k)
Likely homosexual households (counted as self-reported same-sex unmarried-partner households)
Lesbian couples: 0.0% of all households
Gay men: 0.0% of all households
Household received Food Stamps/SNAP in the past 12 months: 436 Household did not receive Food Stamps/SNAP in the past 12 months: 14,268
Women who had a birth in the past 12 months: 720 (731 now married, 61 unmarried) Women who did not have a birth in the past 12 months: 7,792 (3,998 now married, 3,786 unmarried)
Housing units in zip code 35244 with a mortgage: 7,406 (758 second mortgage, 5 home equity loan, 559 both second mortgage and home equity loan) Houses without a mortgage: 105
Median monthly owner costs for units with a mortgage: $1,970 Median monthly owner costs for units without a mortgage: $544
Residents with income below the poverty level in 2022:
This zip code:
4.3%
Whole state:
16.2%
Residents with income below 50% of the poverty level in 2022:
This zip code:
2.2%
Whole state:
8.6%
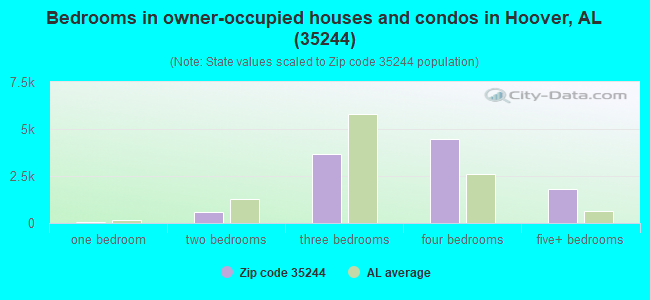
Median number of rooms in houses and condos:
Here:
7.8
State:
6.5
Median number of rooms in apartments:
Here:
4.4
State:
4.7
Notable locations in this zip code not listed on our city pages
Notable locations in zip code 35244: Riverchase Country Club (A), Riverchase Stables (B), Camp Andrews (C), Chase Lake Country Club (D), Hoover Fire Department Station 6 (E), Hoover Fire Department Station 3 (F). Display/hide their locations on the map
Shopping Centers: The Plaza of Rivechase Shopping Center (1), Palladian Place Shopping Center (2), Southgate Village Shopping Center (3), Valleydale Village Shopping Center (4), Loehmann Village Shopping Center (5), The Galleries at Riverchase Shopping Center (6), Riverchase Galleria Shopping Center (7). Display/hide their locations on the map
Churches in zip code 35244 include: Cahaba Valley Church (A), Bryan Presbyterian Memorial Church (B), Riverchase United Methodist Church (C), Mars Hill Church (D). Display/hide their locations on the map
Lakes and reservoirs: Acton Lake (A), Rutherford Lakes (B), Johnsons Lake (C), Guytons Lake (D), Rutherford Lake Number Two (E), Rutherford Lake Number One (F), Indian Valley Lake (G), Paradise Lake (H). Display/hide their locations on the map
6,991 married couples with children.
1,434 single-parent households (447 men, 987 women).
88.0% of residents of 35244 zip code speak English at home.
3.8% of residents speak Spanish at home (67% very well, 16% well, 15% not well, 1% not at all).
5.1% of residents speak other Indo-European language at home (69% very well, 23% well, 6% not well, 1% not at all).
2.6% of residents speak Asian or Pacific Island language at home (68% very well, 29% well, 3% not well).
1.0% of residents speak other language at home (94% very well, 6% well).
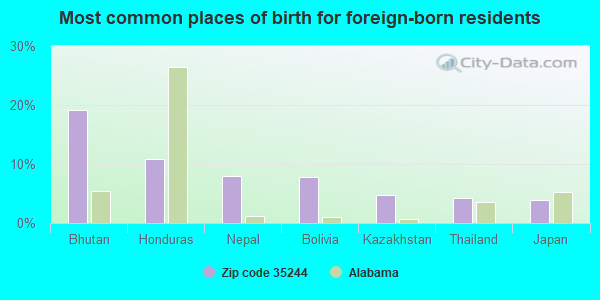
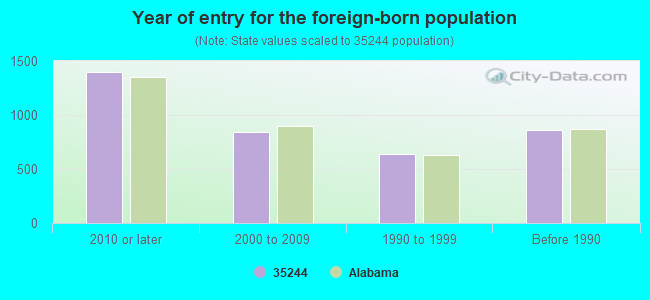
Foreign born population: 3,401 (9.2%) (53.0% of them are naturalized citizens)
This zip code:
9.2%
Whole state:
3.8%
19%Bhutan
11%Honduras
8%Nepal
8%Bolivia
5%Kazakhstan
4%Thailand
4%Japan
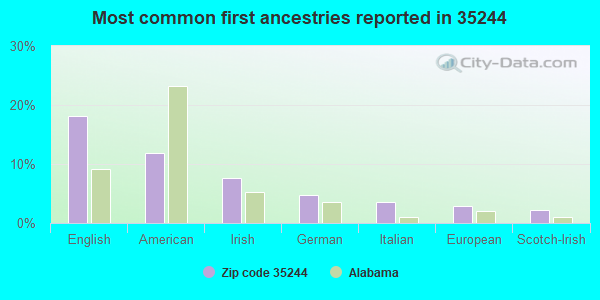
18%English
12%American
8%Irish
5%German
4%Italian
3%European
2%Scotch-Irish
Year of entry for the foreign-born population
1,3952010 or later
8462000 to 2009
6401990 to 1999
864Before 1990
Public elementary/middle school in in zip code 35244 not listed on the city page:
Major facilities with environmental interests located in this zip code:
BIOCRYST PHARMACEUTICALS INC (2190 PARKWAY LAKE DRIVE in BIRMINGHAM, AL)
HAZARDOUS WASTE BIENNIAL REPORTER (Resource Conservation and Recovery Act (tracking hazardous waste)) Large Quantity Generators, more that 1000 kg of hazardous waste/month (Resource Conservation and Recovery Act (tracking hazardous waste)) - notification
ROBERT F BUMPUS MIDDLE SCHOOL (1730 LAKE CYRUS CLUB DR in HOOVER, AL)
(National Center for Education Statistics) - STATE ID-0415 Organizations: HOOVER CITY (SCHOOL DISTRICT)
CANABA RIVER WASTEWATER TREATMENT PLANT (VEONA DANIELS DRRIVE in HOOVER, AL)
(Integrated Compliance Information System) - ICIS-04-1995-0112, FORMAL ENFORCEMENT ACTION Alternative names: CANABA RIVER WWTP
CAHABA RIVER WWTP (3900 VEONA DANIELS ROAD in BIRMINGHAM, AL)
National Pollutant Discharge Elimination System MAJOR (Tracking pollutant discharge elimination systems) - permit Business SIC classification: SEWERAGE SYSTEMS Organizations: JEFFERSON COUNTY COMMISSION (CONTACT/OPERATOR)
Alternative names: CAHABA RIVER SEWAGE TREATMENT PLANT, CAHABA RIVER WASTEWATER TREATMENT PLANT, JEFFERSON CO CAHABA RIVER WWTP, JEFFERSON COUNTY COMMISSION
PORTRAIT INNOVATIONS (180 MAIN STREET in HOOVER, AL)
Small Quantity Generators, between 100 kg and 1000 kg of hazardous waste/month (Resource Conservation and Recovery Act (tracking hazardous waste)) Organizations: JOHNNY GROSSO (CONTACT/OPERATOR)
, PORTRAIT INNOVATIONS INC (CONTACT/OWNER)
RIVERCHASE BAPTIST CHURCH (MICHAEL WILSON in HOOVER, AL)
National Pollutant Discharge Elimination System NON-MAJOR (Tracking pollutant discharge elimination systems) - permit Business SIC classification: HEAVY CONSTRUCTION
MATERIAL DELIVERY SERVICE (100 CHASE PARK S SUITE 228 in BIRMINGHAM, AL)
(Resource Conservation and Recovery Act (tracking hazardous waste)) Organizations: OPERNAME (CONTACT/OPERATOR)
, OPER NAME (CONTACT/OWNER)
BP 227 FORMER AMOCO 227 (QUALITY PETROLEUM OF ALABAMA in BIRMINGHAM, AL)
National Pollutant Discharge Elimination System NON-MAJOR (Tracking pollutant discharge elimination systems) - permit Business SIC classification: GASOLINE SERVICE STATIONS Alternative names: QUALITY PETRO BP227 FRM AMOCO
CAR CARE INC (2048B VALLEYDALE TERRACE in BIRMINGHAM, AL)
Small Quantity Generators, between 100 kg and 1000 kg of hazardous waste/month (Resource Conservation and Recovery Act (tracking hazardous waste)) Business NAICS classification: GENERAL AUTOMOTIVE REPAIR. Organizations: MIKE BARRETT (CONTACT/OPERATOR)
, MICHAEL R & JAIMEE BARRETT (CONTACT/OWNER)
CARMAX AUTO SUPER STORES (STORE NO 7224 in HOOVER, AL)
National Pollutant Discharge Elimination System NON-MAJOR (Tracking pollutant discharge elimination systems) - permit Business SIC classification: MOTOR VEHICLE DEALERS (NEW AND USED) Organizations: CARMAX AUTO SUPER STORES 7224 (CONTACT/OWNER)
Alternative names: CARMAX AUTO SUPER STORES 7224
CHASE CORPORATE CENTER (CARTER MANAGEMENT AND LEASING in BIRMINGHAM, AL)
National Pollutant Discharge Elimination System NON-MAJOR (Tracking pollutant discharge elimination systems) - permit Business SIC classification: OPERATORS OF NONRESIDENTIAL BUILDINGS
PENSKE AUTO CENTER (1767 HIGHWAY 31 S BLDG A in BIRMINGHAM, AL)
(Resource Conservation and Recovery Act (tracking hazardous waste)) Organizations: PENSKE AUTO CENTER INC (CONTACT/OWNER)
Housing units lacking complete plumbing facilities: 0.3% Housing units lacking complete kitchen facilities: 0.8%
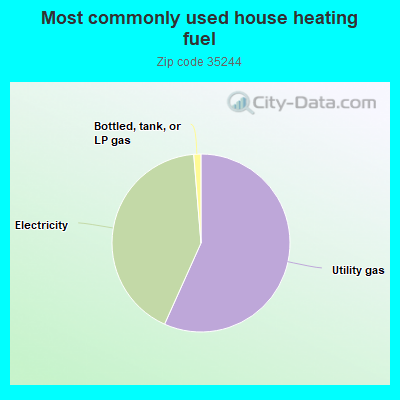
56.6%Utility gas
41.9%Electricity
1.3%Bottled, tank, or LP gas
Population in 1990: 9,758. Population change in the 1990s: +17,197 (+176.2%).
Place of birth for U.S.-born residents:
This state: 21,205
Northeast: 1,236
Midwest: 2,574
South: 7,400
West: 1,157
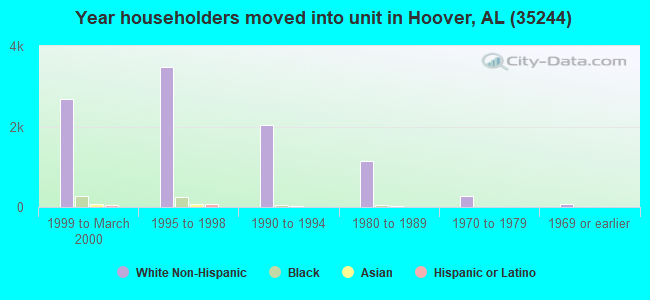
43% of the 35244 zip code residents lived in the same house 5 years ago. Out of people who lived in different houses, 32% lived in this county. Out of people who lived in different counties, 50% lived in Alabama.
88% of the 35244 zip code residents lived in the same house 1 year ago. Out of people who lived in different houses, 35% moved from this county. Out of people who lived in different houses, 36% moved from different county within same state. Out of people who lived in different houses, 31% moved from different state. Out of people who lived in different houses, 1% moved from abroad.
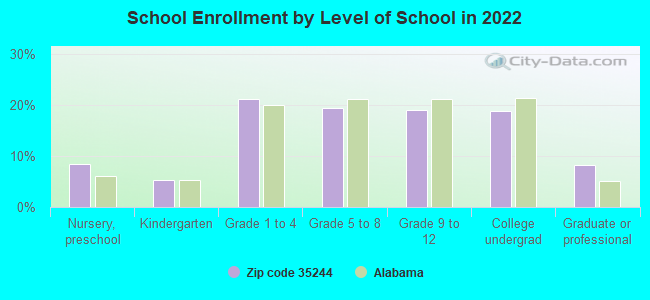
Private vs. public school enrollment:
Students in private schools in grades 1 to 8 (elementary and middle school): 436
Here:
12.1%
Alabama:
14.7%
Students in private schools in grades 9 to 12 (high school): 155
Here:
9.2%
Alabama:
16.3%
Students in private undergraduate colleges: 319
Here:
18.9%
Alabama:
14.6%
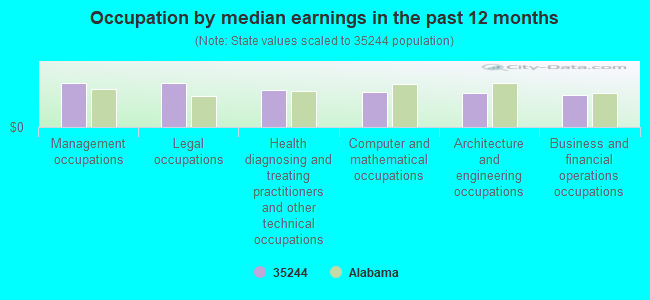
Occupation by median earnings in the past 12 months ($)
112,397Management occupations
111,297Legal occupations
95,718Health diagnosing and treating practitioners and other technical occupations
89,022Computer and mathematical occupations
86,249Architecture and engineering occupations
82,463Business and financial operations occupations
Companies with biggest federal contracts located in this zip code:
HARBERT INTERNATIONAL, INC (1 RIVERCHASE PKWY S in BIRMINGHAM, AL) : $3,518,364 in 27 contractsfrom 1999 to 2000
Contracts for Construction of Structures and Facilities -- Miscellaneous Buildings by Navy Signed by year:2000: $3,477,130; 2001: $0; 2002: $0; 2003: $0; 2004: $0; 2005: $0; 2006: $0.
Biggest contracts:
$1,737,000 with Navy for Construction of Structures and Facilities -- Miscellaneous Buildings. Taking place in SC. Signed on 2000-04-05. Completion date: 2001-05-30.
$1,330,000, same as above.Signed on 2000-02-02. Completion date: 2001-01-03.
$91,347, same as above.Signed on 2000-05-31. Completion date: 2000-09-02.
$81,347, same as above.Signed on 2000-08-25. Completion date: 2000-11-30.
DUNCAN & THOMPSON CONSTRUCTION (516 MINERAL TRACE SUITE D in HOOVER, AL; small business) : $1,295,000 in 3 contractsfrom 2000 to 2001
$1,295,000 with Army for Construction of Structures and Facilities -- Office Buildings. Signed on 2000-12-12. Completion date: 2001-12-11.
$45,883 with Army for Maintenance, Repair or Alteration of Real Property -- Other Administrative Facilities and Service Buildings. Signed on 2001-08-09. Completion date: 2001-10-01.
-$45,883 with Army for Maintenance, Repair or Alteration of Real Property -- Other Industrial Buildings. Signed on 2001-06-21. Completion date: 2001-08-31.
LANIER WORLDWIDE INC (2100 RIVE CHASE CTR in BIRMINGHAM, AL) : $320,748 in 7 contractsfrom 2000 to 2002
Contracts for Installation of Equipment -- Service and Trade Equipment, Office Type Sound Recording and Reproducing Machines by Department of Veterans Affairs Signed by year:2000: $240,000; 2001: $42,000; 2002: $38,748; 2003: $0; 2004: $0; 2005: $0; 2006: $0.
Biggest contracts:
$154,000 with Department of Veterans Affairs for Installation of Equipment -- Service and Trade Equipment. Signed on 2000-01-15. Completion date: 2000-06-15.
$50,000, same as above.Signed on 2000-04-15. Completion date: 2000-06-15.
$42,000 with Department of Veterans Affairs for Office Type Sound Recording and Reproducing Machines. Signed on 2001-10-15. Completion date: 2002-09-15.
$38,748, same as above.Signed on 2002-10-15. Completion date: 2003-09-15.
BUSINESS SYSTEMS & CONSULTANTS (113 LITTLE VALLEY CT in BIRMINGHAM, AL; small business) : $307,635 in 17 contractsfrom 2001 to 2006
Contracts for Office Information System Equipment, ADP Software, ADP Central Processing Unit (CPU, Computer), Digital, Maintenance, Repair and Rebuilding of Equipment -- Office Machines, Text Processing Systems and Visible Record Equipment, and moreby Air Force, Financial Management Service, Department of Veterans Affairs, Federal Technology Service, and others Signed by year:2000: $0; 2001: $130,910; 2002: $0; 2003: $0; 2004: $25,188; 2005: $71,965; 2006: $79,572.
Biggest contracts:
$83,910 with Air Force for Office Information System Equipment. Signed on 2001-09-30. Completion date: 2001-10-26.
$71,665 with Financial Management Service for ADP Software. Signed on 2006-01-31. Completion date: 2007-01-20.
$47,000 with Department of Veterans Affairs for ADP Central Processing Unit (CPU, Computer), Digital. Signed on 2001-12-15. Completion date: 2001-12-15.
$41,192 with Federal Technology Service for ADP Software. Taking place in FL. Signed on 2005-10-06. Completion date: 2005-11-06.
LA QUINTA INNS INC (120 RIVERCHASE PKWY E in BIRMINGHAM, AL; small business) : $211,535 in 8 contractsfrom 2003 to 2006
Contracts for Lodging - Hotel/Motel by Army Signed by year:2000: $0; 2001: $0; 2002: $0; 2003: $55,000; 2004: $0; 2005: $130,115; 2006: $26,420.
Biggest contracts:
$81,900 with Army for Lodging - Hotel/Motel. Signed on 2005-10-26. Completion date: 2005-11-20.
$55,000, same as above.Signed on 2003-02-13. Completion date: 2004-02-17.
$35,100, same as above.Signed on 2005-10-27. Completion date: 2005-10-16.
$26,420, same as above.Signed on 2006-02-28. Completion date: 2006-02-13.
TECHNICAL & EDUCATIONAL TRAINI (2076 VALLEYDALE TER in BIRMINGHAM, AL) : $167,423 in 8 contractsfrom 2000 to 2006
Contracts for Miscellaneous Weapons, ADP Input/Output and Storage Devices, Office Supplies, Miscellaneous Prefabricated Structures, and moreby Army, Navy, U.S. Army Corps of Engineers - civil program financing only, Bureau of Prisoners/Federal Prison System, and others Signed by year:2000: $33,882; 2001: $0; 2002: $0; 2003: $0; 2004: $42,490; 2005: $34,148; 2006: $56,903.
Biggest contracts:
$42,490 with Army for Miscellaneous Weapons. Signed on 2004-09-14. Completion date: 2004-11-30.
$41,760 with Army for ADP Input/Output and Storage Devices. Taking place in MS. Signed on 2006-01-19. Completion date: 2006-01-23.
$33,882 with Navy for Office Supplies. Signed on 2000-12-04. Completion date: 2001-01-18.
$14,824 with U.S. Army Corps of Engineers - civil program financing only for Miscellaneous Prefabricated Structures. Signed on 2005-09-08. Completion date: 2005-09-29.
WYNFREY HOTEL LTD (1000 RIVERCHASE GALLERIA in BIRMINGHAM, AL) : $90,247 in 5 contractsfrom 2004 to 2005
Contracts for Lodging - Hotel/Motel by Army Signed by year:2000: $0; 2001: $0; 2002: $0; 2003: $0; 2004: $28,000; 2005: $62,247; 2006: $0.
Biggest contracts:
$49,830 with Army for Lodging - Hotel/Motel. Signed on 2005-10-17. Completion date: 2005-10-22.
$28,000, same as above.Signed on 2004-10-24. Completion date: 2004-10-30.
$10,000, same as above.Signed on 2005-07-12. Completion date: 2005-08-18.
$2,417, same as above.Signed on 2005-08-10. Completion date: 2005-08-18.
SOUTHERN COMMERCIAL WATERPROOF (509 MINERAL TRACE in BIRMINGHAM, AL) : $84,919 in 2 contractsfrom 2001 to 2002
$96,319 with Navy for Maintenance, Repair or Alteration of Real Property -- Other Airfield Structures. Taking place in GA. Signed on 2001-06-22. Completion date: 2001-10-19.
-$11,400, same as above.Signed on 2002-04-24. Completion date: 2001-10-19.
SNAP-ON INCORPORATED (2195 PARKWAY LAKE DR in BIRMINGHAM, AL)
$81,415 with Air Force for Sets, Kits, and Outfits of Hand Tools. Taking place in WI. Signed on 2000-01-21. Completion date: 2000-05-27.
HARDIN MACHINE TOOLS INC (5220 VALLEYBROOK CIR in BIRMINGHAM, AL; small business) : $81,272 in 2 contractsin 2004
$44,372 with Army for Lathes. Signed on 2004-12-27. Completion date: 2005-02-22.
$36,900 with Army for Maintenance, Repair and Rebuilding of Equipment -- Metalworking Machinery. Signed on 2004-08-25. Completion date: 2004-09-20.
Top industries in this zip code by the number of employees in 2005:
2002 - 2018 National Fire Incident Reporting System (NFIRS) incidents
Based on the data from the years 2002 - 2018 the average number of fire incidents per year is 32. The highest number of fire incidents - 96 took place in 2006, and the least - 1 in 2011. The data has a rising trend.
When looking into fire subcategories, the most reports belonged to: Outside Fires (46.7%), and Structure Fires (30.9%).
Fire incident types reported to NFIRS in Zip Code 35244


 Nearest zip codes: 35226, 35216, 35124, 35211, 35209, 35229.


 (Students: 699, Location: 853 WILLOW OAK DR, Grades: 6-8)
 Based on the data from the years 2002 - 2018 the average number of fire incidents per year is 32. The highest number of fire incidents - 96 took place in 2006, and the least - 1 in 2011. The data has a rising trend.
 When looking into fire subcategories, the most reports belonged to: Outside Fires (46.7%), and Structure Fires (30.9%).