Bessemer, Alabama Submit your own pictures of this city and show them to the world
OSM Map
General Map
Google Map
MSN Map
OSM Map
General Map
Google Map
MSN Map
OSM Map
General Map
Google Map
MSN Map
OSM Map
General Map
Google Map
MSN Map
Please wait while loading the map...
Population in 2022: 25,264 (94% urban, 6% rural). Population change since 2000: -14.9%Males: 11,704 Females: 13,560
March 2022 cost of living index in Bessemer: 87.0 (less than average, U.S. average is 100) Percentage of residents living in poverty in 2022: 32.0%for White Non-Hispanic residents , 29.8% for Black residents , 69.9% for Hispanic or Latino residents , 24.6% for American Indian residents , 68.5% for other race residents , 77.3% for two or more races residents )
Profiles of local businesses
Business Search - 14 Million verified businesses
Data:
Median household income ($)
Median household income (% change since 2000)
Household income diversity
Ratio of average income to average house value (%)
Ratio of average income to average rent
Median household income ($) - White
Median household income ($) - Black or African American
Median household income ($) - Asian
Median household income ($) - Hispanic or Latino
Median household income ($) - American Indian and Alaska Native
Median household income ($) - Multirace
Median household income ($) - Other Race
Median household income for houses/condos with a mortgage ($)
Median household income for apartments without a mortgage ($)
Races - White alone (%)
Races - White alone (% change since 2000)
Races - Black alone (%)
Races - Black alone (% change since 2000)
Races - American Indian alone (%)
Races - American Indian alone (% change since 2000)
Races - Asian alone (%)
Races - Asian alone (% change since 2000)
Races - Hispanic (%)
Races - Hispanic (% change since 2000)
Races - Native Hawaiian and Other Pacific Islander alone (%)
Races - Native Hawaiian and Other Pacific Islander alone (% change since 2000)
Races - Two or more races (%)
Races - Two or more races (% change since 2000)
Races - Other race alone (%)
Races - Other race alone (% change since 2000)
Racial diversity
Unemployment (%)
Unemployment (% change since 2000)
Unemployment (%) - White
Unemployment (%) - Black or African American
Unemployment (%) - Asian
Unemployment (%) - Hispanic or Latino
Unemployment (%) - American Indian and Alaska Native
Unemployment (%) - Multirace
Unemployment (%) - Other Race
Population density (people per square mile)
Population - Males (%)
Population - Females (%)
Population - Males (%) - White
Population - Males (%) - Black or African American
Population - Males (%) - Asian
Population - Males (%) - Hispanic or Latino
Population - Males (%) - American Indian and Alaska Native
Population - Males (%) - Multirace
Population - Males (%) - Other Race
Population - Females (%) - White
Population - Females (%) - Black or African American
Population - Females (%) - Asian
Population - Females (%) - Hispanic or Latino
Population - Females (%) - American Indian and Alaska Native
Population - Females (%) - Multirace
Population - Females (%) - Other Race
Coronavirus confirmed cases (Apr 27, 2024)
Deaths caused by coronavirus (Apr 27, 2024)
Coronavirus confirmed cases (per 100k population) (Apr 27, 2024)
Deaths caused by coronavirus (per 100k population) (Apr 27, 2024)
Daily increase in number of cases (Apr 27, 2024)
Weekly increase in number of cases (Apr 27, 2024)
Cases doubled (in days) (Apr 27, 2024)
Hospitalized patients (Apr 18, 2022)
Negative test results (Apr 18, 2022)
Total test results (Apr 18, 2022)
COVID Vaccine doses distributed (per 100k population) (Sep 19, 2023)
COVID Vaccine doses administered (per 100k population) (Sep 19, 2023)
COVID Vaccine doses distributed (Sep 19, 2023)
COVID Vaccine doses administered (Sep 19, 2023)
Likely homosexual households (%)
Likely homosexual households (% change since 2000)
Likely homosexual households - Lesbian couples (%)
Likely homosexual households - Lesbian couples (% change since 2000)
Likely homosexual households - Gay men (%)
Likely homosexual households - Gay men (% change since 2000)
Cost of living index
Median gross rent ($)
Median contract rent ($)
Median monthly housing costs ($)
Median house or condo value ($)
Median house or condo value ($ change since 2000)
Mean house or condo value by units in structure - 1, detached ($)
Mean house or condo value by units in structure - 1, attached ($)
Mean house or condo value by units in structure - 2 ($)
Mean house or condo value by units in structure by units in structure - 3 or 4 ($)
Mean house or condo value by units in structure - 5 or more ($)
Mean house or condo value by units in structure - Boat, RV, van, etc. ($)
Mean house or condo value by units in structure - Mobile home ($)
Median house or condo value ($) - White
Median house or condo value ($) - Black or African American
Median house or condo value ($) - Asian
Median house or condo value ($) - Hispanic or Latino
Median house or condo value ($) - American Indian and Alaska Native
Median house or condo value ($) - Multirace
Median house or condo value ($) - Other Race
Median resident age
Resident age diversity
Median resident age - Males
Median resident age - Females
Median resident age - White
Median resident age - Black or African American
Median resident age - Asian
Median resident age - Hispanic or Latino
Median resident age - American Indian and Alaska Native
Median resident age - Multirace
Median resident age - Other Race
Median resident age - Males - White
Median resident age - Males - Black or African American
Median resident age - Males - Asian
Median resident age - Males - Hispanic or Latino
Median resident age - Males - American Indian and Alaska Native
Median resident age - Males - Multirace
Median resident age - Males - Other Race
Median resident age - Females - White
Median resident age - Females - Black or African American
Median resident age - Females - Asian
Median resident age - Females - Hispanic or Latino
Median resident age - Females - American Indian and Alaska Native
Median resident age - Females - Multirace
Median resident age - Females - Other Race
Commute - mean travel time to work (minutes)
Travel time to work - Less than 5 minutes (%)
Travel time to work - Less than 5 minutes (% change since 2000)
Travel time to work - 5 to 9 minutes (%)
Travel time to work - 5 to 9 minutes (% change since 2000)
Travel time to work - 10 to 19 minutes (%)
Travel time to work - 10 to 19 minutes (% change since 2000)
Travel time to work - 20 to 29 minutes (%)
Travel time to work - 20 to 29 minutes (% change since 2000)
Travel time to work - 30 to 39 minutes (%)
Travel time to work - 30 to 39 minutes (% change since 2000)
Travel time to work - 40 to 59 minutes (%)
Travel time to work - 40 to 59 minutes (% change since 2000)
Travel time to work - 60 to 89 minutes (%)
Travel time to work - 60 to 89 minutes (% change since 2000)
Travel time to work - 90 or more minutes (%)
Travel time to work - 90 or more minutes (% change since 2000)
Marital status - Never married (%)
Marital status - Now married (%)
Marital status - Separated (%)
Marital status - Widowed (%)
Marital status - Divorced (%)
Median family income ($)
Median family income (% change since 2000)
Median non-family income ($)
Median non-family income (% change since 2000)
Median per capita income ($)
Median per capita income (% change since 2000)
Median family income ($) - White
Median family income ($) - Black or African American
Median family income ($) - Asian
Median family income ($) - Hispanic or Latino
Median family income ($) - American Indian and Alaska Native
Median family income ($) - Multirace
Median family income ($) - Other Race
Median year house/condo built
Median year apartment built
Year house built - Built 2005 or later (%)
Year house built - Built 2000 to 2004 (%)
Year house built - Built 1990 to 1999 (%)
Year house built - Built 1980 to 1989 (%)
Year house built - Built 1970 to 1979 (%)
Year house built - Built 1960 to 1969 (%)
Year house built - Built 1950 to 1959 (%)
Year house built - Built 1940 to 1949 (%)
Year house built - Built 1939 or earlier (%)
Average household size
Household density (households per square mile)
Average household size - White
Average household size - Black or African American
Average household size - Asian
Average household size - Hispanic or Latino
Average household size - American Indian and Alaska Native
Average household size - Multirace
Average household size - Other Race
Occupied housing units (%)
Vacant housing units (%)
Owner occupied housing units (%)
Renter occupied housing units (%)
Vacancy status - For rent (%)
Vacancy status - For sale only (%)
Vacancy status - Rented or sold, not occupied (%)
Vacancy status - For seasonal, recreational, or occasional use (%)
Vacancy status - For migrant workers (%)
Vacancy status - Other vacant (%)
Residents with income below the poverty level (%)
Residents with income below 50% of the poverty level (%)
Children below poverty level (%)
Poor families by family type - Married-couple family (%)
Poor families by family type - Male, no wife present (%)
Poor families by family type - Female, no husband present (%)
Poverty status for native-born residents (%)
Poverty status for foreign-born residents (%)
Poverty among high school graduates not in families (%)
Poverty among people who did not graduate high school not in families (%)
Residents with income below the poverty level (%) - White
Residents with income below the poverty level (%) - Black or African American
Residents with income below the poverty level (%) - Asian
Residents with income below the poverty level (%) - Hispanic or Latino
Residents with income below the poverty level (%) - American Indian and Alaska Native
Residents with income below the poverty level (%) - Multirace
Residents with income below the poverty level (%) - Other Race
Air pollution - Air Quality Index (AQI)
Air pollution - CO
Air pollution - NO2
Air pollution - SO2
Air pollution - Ozone
Air pollution - PM10
Air pollution - PM25
Air pollution - Pb
Crime - Murders per 100,000 population
Crime - Rapes per 100,000 population
Crime - Robberies per 100,000 population
Crime - Assaults per 100,000 population
Crime - Burglaries per 100,000 population
Crime - Thefts per 100,000 population
Crime - Auto thefts per 100,000 population
Crime - Arson per 100,000 population
Crime - City-data.com crime index
Crime - Violent crime index
Crime - Property crime index
Crime - Murders per 100,000 population (5 year average)
Crime - Rapes per 100,000 population (5 year average)
Crime - Robberies per 100,000 population (5 year average)
Crime - Assaults per 100,000 population (5 year average)
Crime - Burglaries per 100,000 population (5 year average)
Crime - Thefts per 100,000 population (5 year average)
Crime - Auto thefts per 100,000 population (5 year average)
Crime - Arson per 100,000 population (5 year average)
Crime - City-data.com crime index (5 year average)
Crime - Violent crime index (5 year average)
Crime - Property crime index (5 year average)
1996 Presidential Elections Results (%) - Democratic Party (Clinton)
1996 Presidential Elections Results (%) - Republican Party (Dole)
1996 Presidential Elections Results (%) - Other
2000 Presidential Elections Results (%) - Democratic Party (Gore)
2000 Presidential Elections Results (%) - Republican Party (Bush)
2000 Presidential Elections Results (%) - Other
2004 Presidential Elections Results (%) - Democratic Party (Kerry)
2004 Presidential Elections Results (%) - Republican Party (Bush)
2004 Presidential Elections Results (%) - Other
2008 Presidential Elections Results (%) - Democratic Party (Obama)
2008 Presidential Elections Results (%) - Republican Party (McCain)
2008 Presidential Elections Results (%) - Other
2012 Presidential Elections Results (%) - Democratic Party (Obama)
2012 Presidential Elections Results (%) - Republican Party (Romney)
2012 Presidential Elections Results (%) - Other
2016 Presidential Elections Results (%) - Democratic Party (Clinton)
2016 Presidential Elections Results (%) - Republican Party (Trump)
2016 Presidential Elections Results (%) - Other
2020 Presidential Elections Results (%) - Democratic Party (Biden)
2020 Presidential Elections Results (%) - Republican Party (Trump)
2020 Presidential Elections Results (%) - Other
Ancestries Reported - Arab (%)
Ancestries Reported - Czech (%)
Ancestries Reported - Danish (%)
Ancestries Reported - Dutch (%)
Ancestries Reported - English (%)
Ancestries Reported - French (%)
Ancestries Reported - French Canadian (%)
Ancestries Reported - German (%)
Ancestries Reported - Greek (%)
Ancestries Reported - Hungarian (%)
Ancestries Reported - Irish (%)
Ancestries Reported - Italian (%)
Ancestries Reported - Lithuanian (%)
Ancestries Reported - Norwegian (%)
Ancestries Reported - Polish (%)
Ancestries Reported - Portuguese (%)
Ancestries Reported - Russian (%)
Ancestries Reported - Scotch-Irish (%)
Ancestries Reported - Scottish (%)
Ancestries Reported - Slovak (%)
Ancestries Reported - Subsaharan African (%)
Ancestries Reported - Swedish (%)
Ancestries Reported - Swiss (%)
Ancestries Reported - Ukrainian (%)
Ancestries Reported - United States (%)
Ancestries Reported - Welsh (%)
Ancestries Reported - West Indian (%)
Ancestries Reported - Other (%)
Educational Attainment - No schooling completed (%)
Educational Attainment - Less than high school (%)
Educational Attainment - High school or equivalent (%)
Educational Attainment - Less than 1 year of college (%)
Educational Attainment - 1 or more years of college (%)
Educational Attainment - Associate degree (%)
Educational Attainment - Bachelor's degree (%)
Educational Attainment - Master's degree (%)
Educational Attainment - Professional school degree (%)
Educational Attainment - Doctorate degree (%)
School Enrollment - Nursery, preschool (%)
School Enrollment - Kindergarten (%)
School Enrollment - Grade 1 to 4 (%)
School Enrollment - Grade 5 to 8 (%)
School Enrollment - Grade 9 to 12 (%)
School Enrollment - College undergrad (%)
School Enrollment - Graduate or professional (%)
School Enrollment - Not enrolled in school (%)
School enrollment - Public schools (%)
School enrollment - Private schools (%)
School enrollment - Not enrolled (%)
Median number of rooms in houses and condos
Median number of rooms in apartments
Housing units lacking complete plumbing facilities (%)
Housing units lacking complete kitchen facilities (%)
Density of houses
Urban houses (%)
Rural houses (%)
Households with people 60 years and over (%)
Households with people 65 years and over (%)
Households with people 75 years and over (%)
Households with one or more nonrelatives (%)
Households with no nonrelatives (%)
Population in households (%)
Family households (%)
Nonfamily households (%)
Population in families (%)
Family households with own children (%)
Median number of bedrooms in owner occupied houses
Mean number of bedrooms in owner occupied houses
Median number of bedrooms in renter occupied houses
Mean number of bedrooms in renter occupied houses
Median number of vehichles in owner occupied houses
Mean number of vehichles in owner occupied houses
Median number of vehichles in renter occupied houses
Mean number of vehichles in renter occupied houses
Mortgage status - with mortgage (%)
Mortgage status - with second mortgage (%)
Mortgage status - with home equity loan (%)
Mortgage status - with both second mortgage and home equity loan (%)
Mortgage status - without a mortgage (%)
Average family size
Average family size - White
Average family size - Black or African American
Average family size - Asian
Average family size - Hispanic or Latino
Average family size - American Indian and Alaska Native
Average family size - Multirace
Average family size - Other Race
Geographical mobility - Same house 1 year ago (%)
Geographical mobility - Moved within same county (%)
Geographical mobility - Moved from different county within same state (%)
Geographical mobility - Moved from different state (%)
Geographical mobility - Moved from abroad (%)
Place of birth - Born in state of residence (%)
Place of birth - Born in other state (%)
Place of birth - Native, outside of US (%)
Place of birth - Foreign born (%)
Housing units in structures - 1, detached (%)
Housing units in structures - 1, attached (%)
Housing units in structures - 2 (%)
Housing units in structures - 3 or 4 (%)
Housing units in structures - 5 to 9 (%)
Housing units in structures - 10 to 19 (%)
Housing units in structures - 20 to 49 (%)
Housing units in structures - 50 or more (%)
Housing units in structures - Mobile home (%)
Housing units in structures - Boat, RV, van, etc. (%)
House/condo owner moved in on average (years ago)
Renter moved in on average (years ago)
Year householder moved into unit - Moved in 1999 to March 2000 (%)
Year householder moved into unit - Moved in 1995 to 1998 (%)
Year householder moved into unit - Moved in 1990 to 1994 (%)
Year householder moved into unit - Moved in 1980 to 1989 (%)
Year householder moved into unit - Moved in 1970 to 1979 (%)
Year householder moved into unit - Moved in 1969 or earlier (%)
Means of transportation to work - Drove car alone (%)
Means of transportation to work - Carpooled (%)
Means of transportation to work - Public transportation (%)
Means of transportation to work - Bus or trolley bus (%)
Means of transportation to work - Streetcar or trolley car (%)
Means of transportation to work - Subway or elevated (%)
Means of transportation to work - Railroad (%)
Means of transportation to work - Ferryboat (%)
Means of transportation to work - Taxicab (%)
Means of transportation to work - Motorcycle (%)
Means of transportation to work - Bicycle (%)
Means of transportation to work - Walked (%)
Means of transportation to work - Other means (%)
Working at home (%)
Industry diversity
Most Common Industries - Agriculture, forestry, fishing and hunting, and mining (%)
Most Common Industries - Agriculture, forestry, fishing and hunting (%)
Most Common Industries - Mining, quarrying, and oil and gas extraction (%)
Most Common Industries - Construction (%)
Most Common Industries - Manufacturing (%)
Most Common Industries - Wholesale trade (%)
Most Common Industries - Retail trade (%)
Most Common Industries - Transportation and warehousing, and utilities (%)
Most Common Industries - Transportation and warehousing (%)
Most Common Industries - Utilities (%)
Most Common Industries - Information (%)
Most Common Industries - Finance and insurance, and real estate and rental and leasing (%)
Most Common Industries - Finance and insurance (%)
Most Common Industries - Real estate and rental and leasing (%)
Most Common Industries - Professional, scientific, and management, and administrative and waste management services (%)
Most Common Industries - Professional, scientific, and technical services (%)
Most Common Industries - Management of companies and enterprises (%)
Most Common Industries - Administrative and support and waste management services (%)
Most Common Industries - Educational services, and health care and social assistance (%)
Most Common Industries - Educational services (%)
Most Common Industries - Health care and social assistance (%)
Most Common Industries - Arts, entertainment, and recreation, and accommodation and food services (%)
Most Common Industries - Arts, entertainment, and recreation (%)
Most Common Industries - Accommodation and food services (%)
Most Common Industries - Other services, except public administration (%)
Most Common Industries - Public administration (%)
Occupation diversity
Most Common Occupations - Management, business, science, and arts occupations (%)
Most Common Occupations - Management, business, and financial occupations (%)
Most Common Occupations - Management occupations (%)
Most Common Occupations - Business and financial operations occupations (%)
Most Common Occupations - Computer, engineering, and science occupations (%)
Most Common Occupations - Computer and mathematical occupations (%)
Most Common Occupations - Architecture and engineering occupations (%)
Most Common Occupations - Life, physical, and social science occupations (%)
Most Common Occupations - Education, legal, community service, arts, and media occupations (%)
Most Common Occupations - Community and social service occupations (%)
Most Common Occupations - Legal occupations (%)
Most Common Occupations - Education, training, and library occupations (%)
Most Common Occupations - Arts, design, entertainment, sports, and media occupations (%)
Most Common Occupations - Healthcare practitioners and technical occupations (%)
Most Common Occupations - Health diagnosing and treating practitioners and other technical occupations (%)
Most Common Occupations - Health technologists and technicians (%)
Most Common Occupations - Service occupations (%)
Most Common Occupations - Healthcare support occupations (%)
Most Common Occupations - Protective service occupations (%)
Most Common Occupations - Fire fighting and prevention, and other protective service workers including supervisors (%)
Most Common Occupations - Law enforcement workers including supervisors (%)
Most Common Occupations - Food preparation and serving related occupations (%)
Most Common Occupations - Building and grounds cleaning and maintenance occupations (%)
Most Common Occupations - Personal care and service occupations (%)
Most Common Occupations - Sales and office occupations (%)
Most Common Occupations - Sales and related occupations (%)
Most Common Occupations - Office and administrative support occupations (%)
Most Common Occupations - Natural resources, construction, and maintenance occupations (%)
Most Common Occupations - Farming, fishing, and forestry occupations (%)
Most Common Occupations - Construction and extraction occupations (%)
Most Common Occupations - Installation, maintenance, and repair occupations (%)
Most Common Occupations - Production, transportation, and material moving occupations (%)
Most Common Occupations - Production occupations (%)
Most Common Occupations - Transportation occupations (%)
Most Common Occupations - Material moving occupations (%)
People in Group quarters - Institutionalized population (%)
People in Group quarters - Correctional institutions (%)
People in Group quarters - Federal prisons and detention centers (%)
People in Group quarters - Halfway houses (%)
People in Group quarters - Local jails and other confinement facilities (including police lockups) (%)
People in Group quarters - Military disciplinary barracks (%)
People in Group quarters - State prisons (%)
People in Group quarters - Other types of correctional institutions (%)
People in Group quarters - Nursing homes (%)
People in Group quarters - Hospitals/wards, hospices, and schools for the handicapped (%)
People in Group quarters - Hospitals/wards and hospices for chronically ill (%)
People in Group quarters - Hospices or homes for chronically ill (%)
People in Group quarters - Military hospitals or wards for chronically ill (%)
People in Group quarters - Other hospitals or wards for chronically ill (%)
People in Group quarters - Hospitals or wards for drug/alcohol abuse (%)
People in Group quarters - Mental (Psychiatric) hospitals or wards (%)
People in Group quarters - Schools, hospitals, or wards for the mentally retarded (%)
People in Group quarters - Schools, hospitals, or wards for the physically handicapped (%)
People in Group quarters - Institutions for the deaf (%)
People in Group quarters - Institutions for the blind (%)
People in Group quarters - Orthopedic wards and institutions for the physically handicapped (%)
People in Group quarters - Wards in general hospitals for patients who have no usual home elsewhere (%)
People in Group quarters - Wards in military hospitals for patients who have no usual home elsewhere (%)
People in Group quarters - Juvenile institutions (%)
People in Group quarters - Long-term care (%)
People in Group quarters - Homes for abused, dependent, and neglected children (%)
People in Group quarters - Residential treatment centers for emotionally disturbed children (%)
People in Group quarters - Training schools for juvenile delinquents (%)
People in Group quarters - Short-term care, detention or diagnostic centers for delinquent children (%)
People in Group quarters - Type of juvenile institution unknown (%)
People in Group quarters - Noninstitutionalized population (%)
People in Group quarters - College dormitories (includes college quarters off campus) (%)
People in Group quarters - Military quarters (%)
People in Group quarters - On base (%)
People in Group quarters - Barracks, unaccompanied personnel housing (UPH), (Enlisted/Officer), ;and similar group living quarters for military personnel (%)
People in Group quarters - Transient quarters for temporary residents (%)
People in Group quarters - Military ships (%)
People in Group quarters - Group homes (%)
People in Group quarters - Homes or halfway houses for drug/alcohol abuse (%)
People in Group quarters - Homes for the mentally ill (%)
People in Group quarters - Homes for the mentally retarded (%)
People in Group quarters - Homes for the physically handicapped (%)
People in Group quarters - Other group homes (%)
People in Group quarters - Religious group quarters (%)
People in Group quarters - Dormitories (%)
People in Group quarters - Agriculture workers' dormitories on farms (%)
People in Group quarters - Job Corps and vocational training facilities (%)
People in Group quarters - Other workers' dormitories (%)
People in Group quarters - Crews of maritime vessels (%)
People in Group quarters - Other nonhousehold living situations (%)
People in Group quarters - Other noninstitutional group quarters (%)
Residents speaking English at home (%)
Residents speaking English at home - Born in the United States (%)
Residents speaking English at home - Native, born elsewhere (%)
Residents speaking English at home - Foreign born (%)
Residents speaking Spanish at home (%)
Residents speaking Spanish at home - Born in the United States (%)
Residents speaking Spanish at home - Native, born elsewhere (%)
Residents speaking Spanish at home - Foreign born (%)
Residents speaking other language at home (%)
Residents speaking other language at home - Born in the United States (%)
Residents speaking other language at home - Native, born elsewhere (%)
Residents speaking other language at home - Foreign born (%)
Class of Workers - Employee of private company (%)
Class of Workers - Self-employed in own incorporated business (%)
Class of Workers - Private not-for-profit wage and salary workers (%)
Class of Workers - Local government workers (%)
Class of Workers - State government workers (%)
Class of Workers - Federal government workers (%)
Class of Workers - Self-employed workers in own not incorporated business and Unpaid family workers (%)
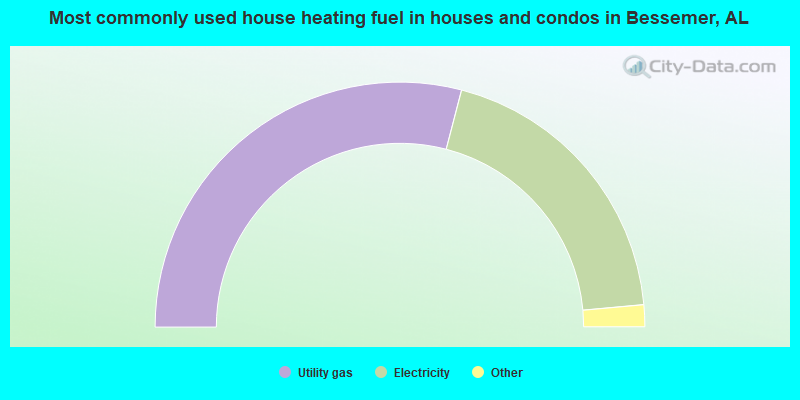
House heating fuel used in houses and condos - Utility gas (%)
House heating fuel used in houses and condos - Bottled, tank, or LP gas (%)
House heating fuel used in houses and condos - Electricity (%)
House heating fuel used in houses and condos - Fuel oil, kerosene, etc. (%)
House heating fuel used in houses and condos - Coal or coke (%)
House heating fuel used in houses and condos - Wood (%)
House heating fuel used in houses and condos - Solar energy (%)
House heating fuel used in houses and condos - Other fuel (%)
House heating fuel used in houses and condos - No fuel used (%)
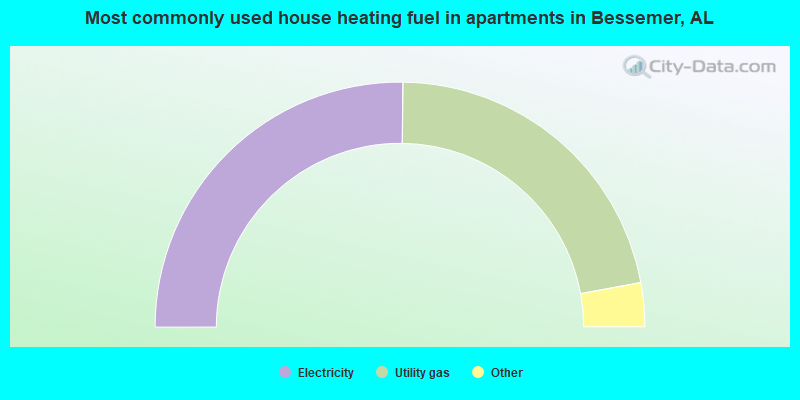
House heating fuel used in apartments - Utility gas (%)
House heating fuel used in apartments - Bottled, tank, or LP gas (%)
House heating fuel used in apartments - Electricity (%)
House heating fuel used in apartments - Fuel oil, kerosene, etc. (%)
House heating fuel used in apartments - Coal or coke (%)
House heating fuel used in apartments - Wood (%)
House heating fuel used in apartments - Solar energy (%)
House heating fuel used in apartments - Other fuel (%)
House heating fuel used in apartments - No fuel used (%)
Armed forces status - In Armed Forces (%)
Armed forces status - Civilian (%)
Armed forces status - Civilian - Veteran (%)
Armed forces status - Civilian - Nonveteran (%)
Fatal accidents locations in years 2005-2021
Fatal accidents locations in 2005
Fatal accidents locations in 2006
Fatal accidents locations in 2007
Fatal accidents locations in 2008
Fatal accidents locations in 2009
Fatal accidents locations in 2010
Fatal accidents locations in 2011
Fatal accidents locations in 2012
Fatal accidents locations in 2013
Fatal accidents locations in 2014
Fatal accidents locations in 2015
Fatal accidents locations in 2016
Fatal accidents locations in 2017
Fatal accidents locations in 2018
Fatal accidents locations in 2019
Fatal accidents locations in 2020
Fatal accidents locations in 2021
Alcohol use - People drinking some alcohol every month (%)
Alcohol use - People not drinking at all (%)
Alcohol use - Average days/month drinking alcohol
Alcohol use - Average drinks/week
Alcohol use - Average days/year people drink much
Audiometry - Average condition of hearing (%)
Audiometry - People that can hear a whisper from across a quiet room (%)
Audiometry - People that can hear normal voice from across a quiet room (%)
Audiometry - Ears ringing, roaring, buzzing (%)
Audiometry - Had a job exposure to loud noise (%)
Audiometry - Had off-work exposure to loud noise (%)
Blood Pressure & Cholesterol - Has high blood pressure (%)
Blood Pressure & Cholesterol - Checking blood pressure at home (%)
Blood Pressure & Cholesterol - Frequently checking blood cholesterol (%)
Blood Pressure & Cholesterol - Has high cholesterol level (%)
Consumer Behavior - Money monthly spent on food at supermarket/grocery store
Consumer Behavior - Money monthly spent on food at other stores
Consumer Behavior - Money monthly spent on eating out
Consumer Behavior - Money monthly spent on carryout/delivered foods
Consumer Behavior - Income spent on food at supermarket/grocery store (%)
Consumer Behavior - Income spent on food at other stores (%)
Consumer Behavior - Income spent on eating out (%)
Consumer Behavior - Income spent on carryout/delivered foods (%)
Current Health Status - General health condition (%)
Current Health Status - Blood donors (%)
Current Health Status - Has blood ever tested for HIV virus (%)
Current Health Status - Left-handed people (%)
Dermatology - People using sunscreen (%)
Diabetes - Diabetics (%)
Diabetes - Had a blood test for high blood sugar (%)
Diabetes - People taking insulin (%)
Diet Behavior & Nutrition - Diet health (%)
Diet Behavior & Nutrition - Milk product consumption (# of products/month)
Diet Behavior & Nutrition - Meals not home prepared (#/week)
Diet Behavior & Nutrition - Meals from fast food or pizza place (#/week)
Diet Behavior & Nutrition - Ready-to-eat foods (#/month)
Diet Behavior & Nutrition - Frozen meals/pizza (#/month)
Drug Use - People that ever used marijuana or hashish (%)
Drug Use - Ever used hard drugs (%)
Drug Use - Ever used any form of cocaine (%)
Drug Use - Ever used heroin (%)
Drug Use - Ever used methamphetamine (%)
Health Insurance - People covered by health insurance (%)
Kidney Conditions-Urology - Avg. # of times urinating at night
Medical Conditions - People with asthma (%)
Medical Conditions - People with anemia (%)
Medical Conditions - People with psoriasis (%)
Medical Conditions - People with overweight (%)
Medical Conditions - Elderly people having difficulties in thinking or remembering (%)
Medical Conditions - People who ever received blood transfusion (%)
Medical Conditions - People having trouble seeing even with glass/contacts (%)
Medical Conditions - People with arthritis (%)
Medical Conditions - People with gout (%)
Medical Conditions - People with congestive heart failure (%)
Medical Conditions - People with coronary heart disease (%)
Medical Conditions - People with angina pectoris (%)
Medical Conditions - People who ever had heart attack (%)
Medical Conditions - People who ever had stroke (%)
Medical Conditions - People with emphysema (%)
Medical Conditions - People with thyroid problem (%)
Medical Conditions - People with chronic bronchitis (%)
Medical Conditions - People with any liver condition (%)
Medical Conditions - People who ever had cancer or malignancy (%)
Mental Health - People who have little interest in doing things (%)
Mental Health - People feeling down, depressed, or hopeless (%)
Mental Health - People who have trouble sleeping or sleeping too much (%)
Mental Health - People feeling tired or having little energy (%)
Mental Health - People with poor appetite or overeating (%)
Mental Health - People feeling bad about themself (%)
Mental Health - People who have trouble concentrating on things (%)
Mental Health - People moving or speaking slowly or too fast (%)
Mental Health - People having thoughts they would be better off dead (%)
Oral Health - Average years since last visit a dentist
Oral Health - People embarrassed because of mouth (%)
Oral Health - People with gum disease (%)
Oral Health - General health of teeth and gums (%)
Oral Health - Average days a week using dental floss/device
Oral Health - Average days a week using mouthwash for dental problem
Oral Health - Average number of teeth
Pesticide Use - Households using pesticides to control insects (%)
Pesticide Use - Households using pesticides to kill weeds (%)
Physical Activity - People doing vigorous-intensity work activities (%)
Physical Activity - People doing moderate-intensity work activities (%)
Physical Activity - People walking or bicycling (%)
Physical Activity - People doing vigorous-intensity recreational activities (%)
Physical Activity - People doing moderate-intensity recreational activities (%)
Physical Activity - Average hours a day doing sedentary activities
Physical Activity - Average hours a day watching TV or videos
Physical Activity - Average hours a day using computer
Physical Functioning - People having limitations keeping them from working (%)
Physical Functioning - People limited in amount of work they can do (%)
Physical Functioning - People that need special equipment to walk (%)
Physical Functioning - People experiencing confusion/memory problems (%)
Physical Functioning - People requiring special healthcare equipment (%)
Prescription Medications - Average number of prescription medicines taking
Preventive Aspirin Use - Adults 40+ taking low-dose aspirin (%)
Reproductive Health - Vaginal deliveries (%)
Reproductive Health - Cesarean deliveries (%)
Reproductive Health - Deliveries resulted in a live birth (%)
Reproductive Health - Pregnancies resulted in a delivery (%)
Reproductive Health - Women breastfeeding newborns (%)
Reproductive Health - Women that had a hysterectomy (%)
Reproductive Health - Women that had both ovaries removed (%)
Reproductive Health - Women that have ever taken birth control pills (%)
Reproductive Health - Women taking birth control pills (%)
Reproductive Health - Women that have ever used Depo-Provera or injectables (%)
Reproductive Health - Women that have ever used female hormones (%)
Sexual Behavior - People 18+ that ever had sex (vaginal, anal, or oral) (%)
Sexual Behavior - Males 18+ that ever had vaginal sex with a woman (%)
Sexual Behavior - Males 18+ that ever performed oral sex on a woman (%)
Sexual Behavior - Males 18+ that ever had anal sex with a woman (%)
Sexual Behavior - Males 18+ that ever had any sex with a man (%)
Sexual Behavior - Females 18+ that ever had vaginal sex with a man (%)
Sexual Behavior - Females 18+ that ever performed oral sex on a man (%)
Sexual Behavior - Females 18+ that ever had anal sex with a man (%)
Sexual Behavior - Females 18+ that ever had any kind of sex with a woman (%)
Sexual Behavior - Average age people first had sex
Sexual Behavior - Average number of female sex partners in lifetime (males 18+)
Sexual Behavior - Average number of female vaginal sex partners in lifetime (males 18+)
Sexual Behavior - Average age people first performed oral sex on a woman (18+)
Sexual Behavior - Average number of woman performed oral sex on in lifetime (18+)
Sexual Behavior - Average number of male sex partners in lifetime (males 18+)
Sexual Behavior - Average number of male anal sex partners in lifetime (males 18+)
Sexual Behavior - Average age people first performed oral sex on a man (18+)
Sexual Behavior - Average number of male oral sex partners in lifetime (18+)
Sexual Behavior - People using protection when performing oral sex (%)
Sexual Behavior - Average number of times people have vaginal or anal sex a year
Sexual Behavior - People having sex without condom (%)
Sexual Behavior - Average number of male sex partners in lifetime (females 18+)
Sexual Behavior - Average number of male vaginal sex partners in lifetime (females 18+)
Sexual Behavior - Average number of female sex partners in lifetime (females 18+)
Sexual Behavior - Circumcised males 18+ (%)
Sleep Disorders - Average hours sleeping at night
Sleep Disorders - People that has trouble sleeping (%)
Smoking-Cigarette Use - People smoking cigarettes (%)
Taste & Smell - People 40+ having problems with smell (%)
Taste & Smell - People 40+ having problems with taste (%)
Taste & Smell - People 40+ that ever had wisdom teeth removed (%)
Taste & Smell - People 40+ that ever had tonsils teeth removed (%)
Taste & Smell - People 40+ that ever had a loss of consciousness because of a head injury (%)
Taste & Smell - People 40+ that ever had a broken nose or other serious injury to face or skull (%)
Taste & Smell - People 40+ that ever had two or more sinus infections (%)
Weight - Average height (inches)
Weight - Average weight (pounds)
Weight - Average BMI
Weight - People that are obese (%)
Weight - People that ever were obese (%)
Weight - People trying to lose weight (%)
18,497 72.2% Black alone 4,635 18.1% White alone 1,749 6.8% Hispanic 791 3.1% Two or more races 56 0.2% Asian alone
Officers per 1,000 residents here:
3.98Alabama average:
2.40
Latest news from Bessemer, AL collected exclusively by city-data.com from local newspapers, TV, and radio stations
Ancestries: American (13.9%), African (2.3%), English (2.0%), Irish (1.7%).
Current Local Time:
Land area: 40.7 square miles.
Population density: 621 people per square mile (low).
771 residents are foreign born (2.7% Latin America ).
This city:
3.0%Alabama:
3.5%
Median real estate property taxes paid for housing units with mortgages in 2022: $957 (0.5%)Median real estate property taxes paid for housing units with no mortgage in 2022: $715 (0.8%)
Nearest city with pop. 50,000+: Hoover, AL
Nearest city with pop. 200,000+: Birmingham, AL
Nearest city with pop. 1,000,000+: Houston, TX
Nearest cities:
Latitude: 33.39 N, Longitude: 86.96 W
Nickname or alias (official or unofficial): The Marvel City
Daytime population change due to commuting: +10,151 (+39.6%)Workers who live and work in this city: 3,400 (37.6%)
Bessemer tourist attractions:
Single-family new house construction building permits:
2022: 19 buildings , average cost: $155,0002021: 24 buildings , average cost: $126,1002020: 11 buildings , average cost: $111,4002019: 38 buildings , average cost: $145,6002018: 37 buildings , average cost: $164,1002017: 41 buildings , average cost: $154,4002016: 56 buildings , average cost: $149,1002015: 10 buildings , average cost: $182,3002014: 1 building , cost: $310,8002013: 2 buildings , average cost: $112,0002011: 3 buildings , average cost: $153,0002010: 8 buildings , average cost: $124,5002009: 2 buildings , average cost: $172,5002008: 14 buildings , average cost: $139,7002007: 63 buildings , average cost: $73,3002006: 97 buildings , average cost: $75,9002005: 57 buildings , average cost: $90,8002004: 95 buildings , average cost: $82,2002003: 77 buildings , average cost: $102,2002002: 51 buildings , average cost: $91,8002001: 44 buildings , average cost: $91,8002000: 37 buildings , average cost: $92,4001999: 33 buildings , average cost: $71,4001998: 28 buildings , average cost: $71,4001997: 79 buildings , average cost: $70,500Unemployment in December 2023:
Most common occupations in Bessemer, AL (%)
Both Males Females
Building and grounds cleaning and maintenance occupations (5.5%)
Other office and administrative support workers, including supervisors (4.4%)
Material recording, scheduling, dispatching, and distributing workers (4.0%)
Laborers and material movers, hand (3.7%)
Driver/sales workers and truck drivers (3.6%)
Other production occupations, including supervisors (3.5%)
Cashiers (3.5%)
Driver/sales workers and truck drivers (7.4%)
Laborers and material movers, hand (6.7%)
Material recording, scheduling, dispatching, and distributing workers (5.3%)
Other production occupations, including supervisors (5.3%)
Building and grounds cleaning and maintenance occupations (5.0%)
Metal workers and plastic workers (4.9%)
Vehicle and mobile equipment mechanics, installers, and repairers (4.5%)
Other office and administrative support workers, including supervisors (6.5%)
Building and grounds cleaning and maintenance occupations (6.0%)
Health technologists and technicians (5.6%)
Cashiers (5.5%)
Nursing, psychiatric, and home health aides (4.6%)
Cooks and food preparation workers (4.4%)
Secretaries and administrative assistants (4.2%)
Tornado activity:
Bessemer-area historical tornado activity is slightly above Alabama state average. It is 139% greater than the overall U.S. average.
On 4/4/1977, a category F5 (max. wind speeds 261-318 mph) tornado 9.0 miles away from the Bessemer city center killed 22 people and injured 130 people and caused between $5,000,000 and $50,000,000 in damages.
On 4/8/1998, a category F5 tornado 14.0 miles away from the city center killed 32 people and injured 259 people and caused $200 million in damages.
Earthquake activity:
Bessemer-area historical earthquake activity is significantly above Alabama state average. It is 130% greater than the overall U.S. average. On 1/18/1999 at 07:00:53, a magnitude 4.8 (4.8 MB, 4.0 LG, Depth: 0.6 mi, Class: Light, Intensity: IV - V) earthquake occurred 17.3 miles away from Bessemer center On 4/29/2003 at 08:59:39, a magnitude 4.9 (4.4 MB, 4.6 MW, 4.9 LG) earthquake occurred 107.8 miles away from the city center On 6/24/1975 at 11:11:36, a magnitude 4.5 (4.5 MB) earthquake occurred 55.7 miles away from Bessemer center On 10/24/1997 at 08:35:17, a magnitude 4.9 (4.8 MB, 4.2 MS, 4.9 LG, Depth: 6.2 mi) earthquake occurred 158.0 miles away from Bessemer center On 4/29/2003 at 08:59:39, a magnitude 4.6 (4.6 MW, Depth: 12.3 mi) earthquake occurred 107.8 miles away from Bessemer center On 11/7/2004 at 11:20:21, a magnitude 4.3 (4.3 MW, Depth: 3.1 mi) earthquake occurred 76.4 miles away from the city center Magnitude types: regional Lg-wave magnitude (LG), body-wave magnitude (MB), surface-wave magnitude (MS), moment magnitude (MW) Natural disasters: The number of natural disasters in Jefferson County (32) is a lot greater than the US average (15).Major Disasters (Presidential) Declared: 24Emergencies Declared: 6Storms: 18, Tornadoes: 16, Floods: 14, Hurricanes: 6, Winds: 6, Drought: 1, Fire: 1, Heavy Rain: 1, Snowfall: 1, Winter Storm: 1, Other: 1 (Note: some incidents may be assigned to more than one category). Hospitals in Bessemer: MEDICAL WEST, AN AFFILIATE OF UAB HEALTH SYSTEM (Government - Hospital District or Authority, 995 9TH AVENUE SOUTHWEST) UAB MEDICAL WEST HOSPICE (995 9TH AVENUE SW P O BOX 847) Nursing Homes in Bessemer: GOLDEN LIVING CENTER - MEADOWOOD (820 GOLF COURSE ROAD) OAK TRACE CARE AND REHABILITATION CENTER (325 SELMA ROAD) OAKS ON PARKWOOD SKILLED NURSING FACILITY (2625 LAUREL OAK DRIVE) RUBY HILL NH INC (507 WHITMORE DRIVE) TERRACE OAKS CARE AND REHABILITATION CENTER (4201 BESSEMER HIGHWAY) UAB MEDICAL WEST SKILLED NURSI (995 9TH AVENUE SOUTHWEST) Dialysis Facilities in Bessemer: BESSEMER DIALYSIS (901 WESTLAKE MALL) BESSEMER KIDNEY CENTER (975 9TH AVE SW) JEWEL DIALYSIS (514 W. TOWN PLAZA) Home Health Centers in Bessemer: MID-SOUTH HOME HEALTH (919 MEDICAL CENTER DRIVE) Amtrak station near Bessemer: 13 miles: BIRMINGHAM (1819 MORRIS AVE.) Services: ticket office, partially wheelchair accessible, enclosed waiting area, public restrooms, public payphones, vending machines, paid short-term parking, paid long-term parking, call for taxi service.
College/University in Bessemer: ITT Technical Institute-Bessemer Full-time enrollment: 569; Location: 6270 Park South Drive; Private, for-profit; Website: www.itt-tech.edu)
Colleges/universities with over 2000 students nearest to Bessemer:
Lawson State Community College-Birmingham Campus (about 6 miles; Birmingham, AL ; Full-time enrollment: 2,695)
Virginia College-Birmingham (about 10 miles; Birmingham, AL ; FT enrollment: 8,167)
Samford University (about 11 miles; Birmingham, AL ; FT enrollment: 3,829)
University of Alabama at Birmingham (about 12 miles; Birmingham, AL ; FT enrollment: 14,853)
University of Montevallo (about 21 miles; Montevallo, AL ; FT enrollment: 2,826)
Jefferson State Community College (about 24 miles; Birmingham, AL ; FT enrollment: 6,041)
Bevill State Community College (about 36 miles; Jasper, AL ; FT enrollment: 2,970)
Public high schools in Bessemer: JESS LANIER HIGH SCH Students: 1,054, Location: 4950 PREMIERE PARKWAY, Grades: 9-12)OAK GROVE HIGH SCH Students: 896, Location: 9494 OAK GROVE PKWY, Grades: 6-12)NEW HORIZON ALT SCH Location: 1701 6TH AVE N, Grades: 7-12)
BESSEMER CTR FOR TECH Location: 4940 PREMIERE PARKWAY, Grades: 9-12)
Private high schools in Bessemer: BESSEMER ACADEMY Students: 327, Location: 1705 4TH AVE SW, Grades: PK-12)
FLINT HILL CHRISTIAN SCHOOL Students: 307, Location: 1630 POWDER PLANT RD, Grades: PK-12)
ROCK CREEK ACADEMY Students: 31, Location: 901 GLAZE DR, Grades: KG-12)
Public elementary/middle schools in Bessemer: JONESBORO ELEM SCH Students: 768, Location: 125 OWEN AVE, Grades: KG-5)OAK GROVE ELEM SCH Students: 613, Location: 9000 TIGER CUB TRAIL, Grades: KG-5)JAMES A DAVIS MIDDLE SCH Students: 610, Location: 100 HIGH SCHOOL DRIVE, Grades: 6-8)ABRAMS ELEM SCH Students: 470, Location: 1200 23RD STREET N, Grades: PK-5)CHARLES F HARD ELEM SCH Students: 397, Location: 2801 ARLINGTON AVE, Grades: PK-5)WESTHILLS ELEM SCH Students: 395, Location: 710 GLENN RD, Grades: KG-5)CONCORD ELEM SCH Students: 356, Location: 1886 LEARNING LANE, Grades: KG-5)GREENWOOD ELEM SCH Students: 211, Location: 5012 ROSELYN ROAD SOUTHEAST, Grades: KG-5)GREENWOOD ELEM SCH Students: 211, Location: 1219 SCHOOL RD, Grades: KG-5)Private elementary/middle schools in Bessemer: ST ALOYSIUS SCHOOL Students: 162, Location: 751A ACADEMY DR, Grades: PK-8)
DUNNAMS PRIVATE SCHOOL Students: 150, Location: 811 GLENN RD, Grades: PK-1)
NEW LIFE CHRISTIAN SCHOOL OF EXCELLENCE Students: 55, Location: 1622 7TH AVE N, Grades: KG-4)
JESUS CHRISTIAN DAYCARE AND SCHOOL Students: 48, Location: 1732 11TH AVE N, Grades: PK-2)
BEULAH BAPTIST CHRISTIAN SCHOOL Students: 30, Location: 1022 2ND AVE N, Grades: PK-2)
See full list of schools located in Bessemer Library in Bessemer: BESSEMER PUBLIC LIBRARY Operating income: $693,374; Location: 400 19TH STREET N; 68,511 books ; 5,020 audio materials ; 3,469 video materials ; 1 local licensed databases ; 79 state licensed databases ; 5 other licensed databases ; 107 print serial subscriptions )
Notable locations in Bessemer: (A) , Bessemer Municipal Golf Course (B) , Sparks Gap (C) , Woodward Industrial Park (D) , Bessemer Public Library (E) , Bessemer City Hall (F) , Bessemer City Jail (G) , Bessemer Fire Department Station 1 (H) , Bessemer Fire Department Station 5 (I) , Bessemer Fire Department Headquarters and Training Facility (J) , Bessemer Fire Department Station 4 (K) , Bessemer Fire Department Station 3 (L) , Bessemer Fire Department Station 2 (M) . Display/hide their locations on the map
Shopping Centers: (1) , Bessemer Plaza Shopping Center (2) , West Town Plaza Shopping Center (3) . Display/hide their locations on the map
Churches in Bessemer include: (A) , First Presbyterian Church of Bessemer (B) , First United Methodist Church of Bessemer (C) , Pettys African Methodist Episcopal Zion Chapel (D) , McCalla Baptist Church (E) , Canaan Church (F) , Friendship Baptist Church (G) , First United Pentecostal Church (H) , Little Souls Saving Church (I) . Display/hide their locations on the map
Cemeteries: (1) , Sadlers Cemetery (2) , Cedar Hill Cemetery (3) . Display/hide their locations on the map
Lakes: (A) , Blue Lake (B) . Display/hide their locations on the map
Streams, rivers, and creeks: (A) , Little Shades Creek (B) , Little Blue Creek (C) , Halls Creek (D) , Fivemile Creek (E) . Display/hide their locations on the map
Parks in Bessemer include: (1) , Watercress Darter National Wildlife Refuge (2) , Roosevelt Park (3) . Display/hide their locations on the map
Tourist attractions: (1) , Jefferson County Public Libraries - Hueytown (Cultural Attractions- Events- & Facilities; 1372 Hueytown Road) (2) , Jefferson County Public Libraries - Bessemer (Cultural Attractions- Events- & Facilities; 701 9th Avenue Southwest) (3) , Skateland (Amusement & Theme Parks; 3296 Warrior River Road) (4) , Holiday Bowl Fun Center (Amusement & Theme Parks; 4321 Bessemer Super Highway) (5) , Visionland Amusement Park (Amusement & Theme Parks; 5051 Prince Street) (6) , Winner's World (Amusement & Theme Parks; 534 West Town Plaza) (7) , Alabama Amusement CO (Amusement & Theme Parks; 1914 11th Avenue North) (8) , Arcade (Amusement & Theme Parks; 1000 19th Street North) (9) . Display/hide their approximate locations on the map
Hotels: (1) , Budget Motel of Bessemer (3010 9th Avenue North) (2) , Holiday Inn Express (5001 Academy Lane) (3) , Holiday Inn Express Hotel & Suites (5001 Academy Lane) (4) , Best Western Hotel And Suites (5041 Academy Lane) (5) , Hiway Host Motel (4301 Bessemer Super Highway) (6) , Comfort Inn Bessemer (5051 Academy Lane) (7) , Jameson Inn of Bessemer (5021 Academy Lane) (8) , Days Inn (1121 9th Avenue Southwest) (9) . Display/hide their approximate locations on the map
Courts: (1) , Municipal Court Management (1816 3rd Avenue North) (2) , Jefferson County - Family Court- Clerks Office (120 2nd Court North) (3) , Bessemer City - Municipal Court (23 15th Street North) (4) , Bessemer City - Police Department- Municipal Court (23 15th Street North) (5) , Hueytown City - Court Department (1318 Hueytown Road) (6) . Display/hide their approximate locations on the map
Birthplace of: Jimmy Staggs - DJ, Bo Jackson - (born 1962), football and baseball star, Andre Williams - R&B and punk blues musician, David McCampbell - Navy Medal of Honor recipient, DeMeco Ryans - College football player, Glenn Shadix - Film actor, Johnnie Mae Matthews - Female singer, Kerry Rhodes - 2005 NFL player (New York Jets, born : Aug 2, 1982), Louisiana Red - African blues guitarist, Abdulalim A. Shabazz - Mathematician.
Jefferson County has a predicted average indoor radon screening level between 2 and 4 pCi/L (pico curies per liter) - Moderate Potential Drinking water stations with addresses in Bessemer and their reported violations in the past:
BESSEMER WATER SERVICE (Population served: 80,124, Purch surface water):
Past monitoring violations:
Lead Consumer Notice - In JAN-01-2012, Contaminant: Lead and Copper Rule. Follow-up actions: St Violation/Reminder Notice (APR-04-2012), St Compliance achieved (APR-13-2012)
Drinking water stations with addresses in Bessemer that have no violations reported:
GOVERNMENTAL UTILITY SERVICE CORPORATION (Address: 250 LINK ROAD Population served: 32, Primary Water Source Type: Surface water)
Average household size: This city:
2.5 peopleAlabama:
2.5 people
Percentage of family households: This city:
65.1%Whole state:
67.8%
Percentage of households with unmarried partners: This city:
5.1%Whole state:
4.7%
Likely homosexual households (counted as self-reported same-sex unmarried-partner households)
Lesbian couples: 0.3% of all households Gay men: 0.2% of all households
People in group quarters in Bessemer in 2010:
472 people in nursing facilities/skilled-nursing facilities
328 people in group homes intended for adults
47 people in local jails and other municipal confinement facilities
24 people in other noninstitutional facilities
People in group quarters in Bessemer in 2000:
305 people in nursing homes
210 people in local jails and other confinement facilities (including police lockups)
79 people in schools, hospitals, or wards for the intellectually disabled
25 people in other noninstitutional group quarters
10 people in homes for the mentally ill
Banks with branches in Bessemer (2011 data):
Regions Bank: Morgan Road Branch, Bessemer Rdt Branch, Bessemer Branch, West Lake Branch. Info updated 2011/02/24: Bank assets: $123,368.2 mil, Deposits: $98,301.3 mil, headquarters in Birmingham, AL, positive income , Commercial Lending Specialization, 1778 total offices , Holding Company: Regions Financial Corporation
Wells Fargo Bank, National Association: Tannehill at 4901 Promenade Pkwy, branch established on 1977/06/06; Bessemer Branch at 601 North 19th Street, branch established on 1960/07/01. Info updated 2011/04/05: Bank assets: $1,161,490.0 mil, Deposits: $905,653.0 mil, headquarters in Sioux Falls, SD, positive income , 6395 total offices , Holding Company: Wells Fargo & Company
First Financial Bank: at 1630 4th Avenue North, branch established on 1965/05/17. Info updated 2011/02/24: Bank assets: $208.9 mil, Deposits: $166.7 mil, local headquarters , negative income in the last year , Commercial Lending Specialization, 9 total offices , Holding Company: Firstfed Bancorp, Inc. Employee Stock Ownership Plan
Branch Banking and Trust Company: Bessemer Branch at 200 18th Street North, branch established on 1993/02/10. Info updated 2010/03/29: Bank assets: $168,867.6 mil, Deposits: $127,549.5 mil, headquarters in Winston Salem, NC, positive income , Commercial Lending Specialization, 1793 total offices , Holding Company: Bb&T Corporation
PNC Bank, National Association: Bessemer Branch at 1719 Fourth Avenue North, branch established on 1971/08/02. Info updated 2012/03/20: Bank assets: $263,309.6 mil, Deposits: $197,343.0 mil, headquarters in Wilmington, DE, positive income , Commercial Lending Specialization, 3085 total offices , Holding Company: Pnc Financial Services Group, Inc., The
BankTrust: Bessemer Branch at 401 19th Street North, branch established on 2005/05/23. Info updated 2012/01/30: Bank assets: $2,083.8 mil, Deposits: $1,812.7 mil, headquarters in Mobile, AL, positive income , Commercial Lending Specialization, 50 total offices , Holding Company: Banctrust Financial Group, Inc.
For population 15 years and over in Bessemer:
Never married: 44.5%Now married: 28.7%Separated: 2.3%Widowed: 10.0%Divorced: 14.6% For population 25 years and over in Bessemer:
High school or higher: 85.6%Bachelor's degree or higher: 13.7%Graduate or professional degree: 4.8%Unemployed: 10.9%Mean travel time to work (commute): 20.9 minutes
Education Gini index (Inequality in education) Here:
10.8Alabama average:
11.5
Religion statistics for Bessemer, AL (based on Jefferson County data)
Religion Adherents Congregations Evangelical Protestant 308,984 710 Black Protestant 106,653 257 Mainline Protestant 67,037 150 Catholic 55,083 32 Other 13,073 45 Orthodox 1,424 4 None 106,212 -
Source: Clifford Grammich, Kirk Hadaway, Richard Houseal, Dale E.Jones, Alexei Krindatch, Richie Stanley and Richard H.Taylor. 2012. 2010 U.S.Religion Census: Religious Congregations & Membership Study. Association of Statisticians of American Religious Bodies. Jones, Dale E., et al. 2002. Congregations and Membership in the United States 2000. Nashville, TN: Glenmary Research Center. Graphs represent county-level data
Food Environment Statistics: Number of grocery stores : 135Jefferson County :
2.05 / 10,000 pop.State :
1.89 / 10,000 pop.
Number of supercenters and club stores : 12Jefferson County :
0.18 / 10,000 pop.Alabama :
0.20 / 10,000 pop.
Number of convenience stores (no gas) : 65This county :
0.99 / 10,000 pop.Alabama :
0.65 / 10,000 pop.
Number of convenience stores (with gas) : 380Jefferson County :
5.77 / 10,000 pop.Alabama :
6.32 / 10,000 pop.
Number of full-service restaurants : 357Jefferson County :
5.42 / 10,000 pop.Alabama :
5.75 / 10,000 pop.
Adult diabetes rate : This county :
12.4%Alabama :
11.8%
Low-income preschool obesity rate : This county :
12.0%Alabama :
13.5%
Health and Nutrition: Healthy diet rate : This city:
48.1%State:
49.0%
Average overall health of teeth and gums : Bessemer:
44.6%State:
45.7%
People feeling badly about themselves : Bessemer:
19.2%State:
20.7%
People not drinking alcohol at all : Bessemer:
13.5%State:
11.0%
Average hours sleeping at night : Overweight people : Bessemer:
35.3%State:
34.4%
General health condition : Average condition of hearing : This city:
80.6%Alabama:
79.3%
More about Health and Nutrition of Bessemer, AL Residents
Local government employment and payroll (March 2022)
Function
Full-time employees
Monthly full-time payroll
Average yearly full-time wage
Part-time employees
Monthly part-time payroll
Firefighters
101 $582,893 $69,255 0 $0 Police Protection - Officers
93 $367,760 $47,453 0 $0 Solid Waste Management
74 $160,708 $26,061 0 $0 Sewerage
63 $132,536 $25,245 0 $0 Parks and Recreation
34 $150,514 $53,123 0 $0 Financial Administration
19 $107,059 $67,616 0 $0 Police - Other
14 $48,236 $41,345 0 $0 Other Government Administration
14 $41,730 $35,769 0 $0 Judicial and Legal
11 $46,093 $50,283 0 $0 Correction
9 $26,354 $35,139 0 $0 Other and Unallocable
8 $56,584 $84,876 0 $0 Streets and Highways
6 $27,705 $55,410 0 $0 Fire - Other
5 $20,030 $48,072 0 $0 Housing and Community Development (Local)
2 $8,882 $53,292 0 $0
Totals for Government
453 $1,777,083 $47,075 0 $0
Bessemer government finances - Expenditure in 2021 (per resident):
Construction - Regular Highways: $3,257,000 ($128.92)
Electric Utilities: $3,208,000 ($126.98)Water Utilities: $1,533,000 ($60.68)Current Operations - Electric Utilities: $29,551,000 ($1169.69)
Water Utilities: $15,576,000 ($616.53)Police Protection: $12,993,000 ($514.29)Local Fire Protection: $11,390,000 ($450.84)General - Other: $11,380,000 ($450.44)Regular Highways: $5,800,000 ($229.58)Solid Waste Management: $4,720,000 ($186.83)Parks and Recreation: $3,546,000 ($140.36)Central Staff Services: $3,267,000 ($129.31)Judicial and Legal Services: $2,656,000 ($105.13)Libraries: $2,081,000 ($82.37)Financial Administration: $1,736,000 ($68.71)Miscellaneous Commercial Activities - Other: $713,000 ($28.22)Protective Inspection and Regulation - Other: $612,000 ($24.22)Housing and Community Development: $351,000 ($13.89)Health - Other: $267,000 ($10.57)Electric Utilities - Interest on Debt: $328,000 ($12.98)
General - Interest on Debt: $2,309,000 ($91.39)
Other Capital Outlay - General - Other: $949,000 ($37.56)
Police Protection: $359,000 ($14.21)Parks and Recreation: $5,000 ($0.20)Water Utilities - Interest on Debt: $1,145,000 ($45.32)
Bessemer government finances - Revenue in 2021 (per resident):
Charges - Other: $8,361,000 ($330.95)
Parks and Recreation: $983,000 ($38.91)Miscellaneous Commercial Activities: $98,000 ($3.88)Federal Intergovernmental - Housing and Community Development: $399,000 ($15.79)
Miscellaneous - Fines and Forfeits: $1,715,000 ($67.88)
General Revenue - Other: $491,000 ($19.43)Interest Earnings: $107,000 ($4.24)Donations From Private Sources: $5,000 ($0.20)Revenue - Electric Utilities: $34,328,000 ($1358.77)
Water Utilities: $20,378,000 ($806.60)State Intergovernmental - Highways: $1,637,000 ($64.80)
General Local Government Support: $609,000 ($24.11)Other: $205,000 ($8.11)Tax - General Sales and Gross Receipts: $35,564,000 ($1407.69)
Property: $8,195,000 ($324.37)Individual Income: $7,197,000 ($284.87)Occupation and Business License - Other: $4,002,000 ($158.41)Motor Fuels Sales: $1,070,000 ($42.35)Other License: $643,000 ($25.45)Alcoholic Beverage Sales: $314,000 ($12.43)Public Utilities Sales: $257,000 ($10.17)Motor Vehicle License: $121,000 ($4.79)Tobacco Products Sales: $23,000 ($0.91)
Bessemer government finances - Debt in 2021 (per resident):
Long Term Debt - Beginning Outstanding - Unspecified Public Purpose: $96,155,000 ($3806.01)
Outstanding Unspecified Public Purpose: $92,575,000 ($3664.30)Retired Unspecified Public Purpose: $3,580,000 ($141.70)
Bessemer government finances - Cash and Securities in 2021 (per resident):
Other Funds - Cash and Securities: $46,758,000 ($1850.78)
Sinking Funds - Cash and Securities: $918,000 ($36.34)
6.20% of this county's 2020 resident taxpayers moved to other counties in 2021 ($76,918 average adjusted gross income )
Here:
6.20%Alabama average:
6.41%
0.01% of residents moved to foreign countries ($73 average AGI )Jefferson County:
0.01%Alabama average:
0.02%
Top counties to which taxpayers relocated from this county between 2020 and 2021:
Businesses in Bessemer, AL
Name Count Name Count
ALDI 1 McDonald's 3 AT&T 2 Motel 6 1 Advance Auto Parts 2 Nike 2 Applebee's 1 Nissan 1 Arby's 1 Papa John's Pizza 1 AutoZone 1 Payless 1 Bath & Body Works 1 Penske 1 Best Western 1 Pizza Hut 2 Burger King 2 Popeyes 1 CVS 3 Publix Super Markets 1 Chevrolet 1 Quiznos 2 Chick-Fil-A 1 RadioShack 1 Church's Chicken 2 Ruby Tuesday 1 Comfort Inn 1 SONIC Drive-In 1 Cracker Barrel 1 Sleep Inn 1 Domino's Pizza 2 Sprint Nextel 1 Dunkin Donuts 1 Starbucks 1 FedEx 6 Subway 3 Ford 1 T-Mobile 3 GNC 1 Taco Bell 3 GameStop 1 Target 1 H&R Block 1 The Room Place 1 Hilton 1 True Value 1 Holiday Inn 1 U-Haul 3 JCPenney 1 UPS 9 KFC 1 Vans 1 Lane Furniture 1 Verizon Wireless 1 Little Caesars Pizza 1 Waffle House 2 Lowe's 1 Walgreens 1 Marriott 1 Walmart 1 Maurices 1 YMCA 2
Strongest AM radio stations in Bessemer:
WJOX (690 AM; 50 kW; BIRMINGHAM, AL; Owner: CITADEL BROADCASTING COMPANY)
WAPI (1070 AM; 50 kW; BIRMINGHAM, AL; Owner: CITADEL BROADCASTING COMPANY)
WSMQ (1450 AM; 1 kW; BESSEMER, AL; Owner: BESSEMER RADIO INC.)
WDJC (850 AM; 50 kW; BIRMINGHAM, AL; Owner: KIMTRON, INC.)
WERC (960 AM; 5 kW; BIRMINGHAM, AL; Owner: CAPSTAR TX LIMITED PARTNERSHIP)
WRJS (1320 AM; 5 kW; BIRMINGHAM, AL; Owner: CXR HOLDINGS, INC.)
WYDE (1260 AM; 5 kW; BIRMINGHAM, AL; Owner: KIMTRON, INC.)
WJLD (1400 AM; 1 kW; FAIRFIELD, AL; Owner: RICHARDSON BROADCASTING CORPORATION)
WAYE (1220 AM; 1 kW; BIRMINGHAM, AL; Owner: BIRMINGHAM CHRISTIAN RADIO, INC.)
WNSI (810 AM; 50 kW; JACKSONVILLE, AL; Owner: UNITED BROADCASTING NETWORK, INC.)
WATV (900 AM; 1 kW; BIRMINGHAM, AL)
WLPH (1480 AM; daytime; 5 kW; IRONDALE, AL; Owner: BIRMINGHAM CHRISTIAN RADIO, INC.)
WCOC (1010 AM; 5 kW; DORA, AL; Owner: AZTECA COMMUNICATIONS OF ALABAMA, INC.)
Strongest FM radio stations in Bessemer:
WMJJ (96.5 FM; BIRMINGHAM, AL; Owner: CAPSTAR TX LIMITED PARTNERSHIP)
WQEN (103.7 FM; GADSDEN, AL; Owner: CAPSTAR TX LIMITED PARTNERSHIP)
WZRR (99.5 FM; BIRMINGHAM, AL; Owner: CITADEL BROADCASTING COMPANY)
WDJC-FM (93.7 FM; BIRMINGHAM, AL; Owner: KIMTRON, INC.)
WODL (97.3 FM; HOMEWOOD, AL; Owner: CXR HOLDINGS, INC.)
WYSF (94.5 FM; BIRMINGHAM, AL; Owner: CITADEL BROADCASTING COMPANY)
WBHK (98.7 FM; WARRIOR, AL; Owner: CXR HOLDINGS, INC.)
WZZK-FM (104.7 FM; BIRMINGHAM, AL; Owner: CXR HOLDINGS, INC.)
WBPT (106.9 FM; BIRMINGHAM, AL; Owner: CXR HOLDINGS, INC.)
WBHM (90.3 FM; BIRMINGHAM, AL; Owner: BD OF TRUSTEES/U OF AL AT BIRMINGHAM)
W281AB (104.1 FM; MOUNTAIN BROOK, AL; Owner: FAMILY STATIONS, INC.)
WBFR (89.5 FM; BIRMINGHAM, AL; Owner: FAMILY STATIONS, INC.)
WDXB (102.5 FM; JASPER, AL; Owner: CAPSTAR TX LIMITED PARTNERSHIP)
WGIB (91.9 FM; BIRMINGHAM, AL; Owner: GLEN IRIS BAPTIST SCHOOL)
WVSU-FM (91.1 FM; BIRMINGHAM, AL; Owner: SAMFORD UNIVERSITY)
WLJR (88.5 FM; BIRMINGHAM, AL; Owner: BRIARWOOD PRESBYTERIAN CHURCH)
WRAX (107.7 FM; BIRMINGHAM, AL; Owner: CITADEL BROADCASTING COMPANY)
WQEM (101.5 FM; COLUMBIANA, AL; Owner: GLEN IRIS BAPTIST SCHOOL)
WENN (105.9 FM; TRUSSVILLE, AL; Owner: CAPSTAR TX LIMITED PARTNERSHIP)
WANZ (100.7 FM; NORTHPORT, AL; Owner: APEX BRAODCASTING INC.)
TV broadcast stations around Bessemer:
WBXA-CA (Channel 2; BIRMINGHAM, AL; Owner: THE BOX WORLDWIDE LLC)
WABM (Channel 68; BIRMINGHAM, AL; Owner: BIRMINGHAM (WABM-TV) LICENSEE, INC.)
WBMA-LP (Channel 58; BIRMINGHAM, AL; Owner: TV ALABAMA, INC.)
WIAT (Channel 42; BIRMINGHAM, AL; Owner: MEDIA GENERAL COMMUNICATIONS, INC.)
WBIQ (Channel 10; BIRMINGHAM, AL; Owner: ALABAMA EDUCATIONAL TELEVISION COMMISSION)
WTTO (Channel 21; HOMEWOOD, AL; Owner: WTTO LICENSEE, LLC)
WBRC (Channel 6; BIRMINGHAM, AL; Owner: WBRC LICENSE, INC.)
WVTM-TV (Channel 13; BIRMINGHAM, AL; Owner: BIRMINGHAM BROADCASTING (WVTM-TV), LLC)
WDBB (Channel 17; BESSEMER, AL; Owner: WDBB-TV, INC.)
W27CM (Channel 27; BIRMINGHAM, AL; Owner: EQUITY BROADCASTING CORPORATION)
W34BI (Channel 34; BIRMINGHAM, AL; Owner: VENTANA TELEVISION, INC.)
WCFT-TV (Channel 33; TUSCALOOSA, AL; Owner: TV ALABAMA, INCORPORATED)
W46DK (Channel 46; BIRMINGHAM, AL; Owner: TRINITY BROADCASTING NETWORK)
W15AZ (Channel 15; ALABASTER, AL; Owner: GLEN IRIS BAPTIST CHURCH SCHOOL)
W62BG (Channel 62; BIRMINGHAM, AL; Owner: WTTO LICENSEE, LLC)
W49AY (Channel 49; BIRMINGHAM, AL; Owner: GLEN IRIS BAPTIST SCHOOL)
Medal of Honor Recipients
Medal of Honor Recipient born in Bessemer: David McCampbell.
National Bridge Inventory (NBI) Statistics 161 Number of bridges2,392ft / 729m Total length $320,452,000 Total costs2,593,758 Total average daily traffic466,681 Total average daily truck traffic
New bridges - historical statistics
2 1920-1929 16 1930-1939 7 1940-1949 15 1950-1959 3 1960-1969 57 1970-1979 45 1980-1989 1 1990-1999 9 2000-2009 6 2010-2019
See full National Bridge Inventory statistics for Bessemer, AL
Home Mortgage Disclosure Act Aggregated Statistics For Year 2009(Based on 5 full and 8 partial tracts) A) FHA, FSA/RHS & VA B) Conventional C) Refinancings D) Home Improvement Loans E) Loans on Dwellings For 5+ Families F) Non-occupant Loans on G) Loans On Manufactured Number Average Value Number Average Value Number Average Value Number Average Value Number Average Value Number Average Value Number Average Value
LOANS ORIGINATED 140 $163,124 94 $136,477 461 $168,137 27 $40,076 1 $155,980 39 $68,565 2 $33,715 APPLICATIONS APPROVED, NOT ACCEPTED 12 $113,888 8 $123,350 46 $144,706 5 $62,606 0 $0 1 $31,000 2 $33,330 APPLICATIONS DENIED 39 $117,616 31 $97,617 290 $132,715 52 $30,561 0 $0 16 $57,393 6 $39,582 APPLICATIONS WITHDRAWN 19 $159,329 22 $171,920 205 $149,490 6 $84,768 0 $0 15 $70,715 1 $28,650 FILES CLOSED FOR INCOMPLETENESS 3 $86,333 2 $164,510 43 $173,164 4 $44,818 0 $0 0 $0 1 $5,000
Aggregated Statistics For Year 2008(Based on 5 full and 8 partial tracts) A) FHA, FSA/RHS & VA B) Conventional C) Refinancings D) Home Improvement Loans E) Loans on Dwellings For 5+ Families F) Non-occupant Loans on G) Loans On Manufactured Number Average Value Number Average Value Number Average Value Number Average Value Number Average Value Number Average Value Number Average Value
LOANS ORIGINATED 131 $146,818 192 $141,672 347 $127,130 45 $48,748 1 $832,700 75 $73,246 1 $38,540 APPLICATIONS APPROVED, NOT ACCEPTED 12 $123,662 29 $116,520 70 $141,302 11 $54,310 0 $0 15 $76,234 2 $79,530 APPLICATIONS DENIED 44 $127,249 60 $127,540 380 $119,318 96 $40,055 0 $0 34 $63,387 7 $48,270 APPLICATIONS WITHDRAWN 18 $131,382 32 $137,865 149 $135,398 5 $90,038 0 $0 11 $87,502 2 $40,545 FILES CLOSED FOR INCOMPLETENESS 5 $98,152 13 $114,328 39 $137,573 6 $59,703 0 $0 5 $80,012 0 $0
Aggregated Statistics For Year 2007(Based on 5 full and 8 partial tracts) A) FHA, FSA/RHS & VA B) Conventional C) Refinancings D) Home Improvement Loans E) Loans on Dwellings For 5+ Families F) Non-occupant Loans on G) Loans On Manufactured Number Average Value Number Average Value Number Average Value Number Average Value Number Average Value Number Average Value Number Average Value
LOANS ORIGINATED 65 $143,849 549 $145,382 462 $107,599 76 $42,653 1 $1,762,320 135 $71,940 6 $47,612 APPLICATIONS APPROVED, NOT ACCEPTED 5 $152,810 77 $120,344 99 $109,556 29 $35,133 0 $0 16 $94,293 2 $70,595 APPLICATIONS DENIED 19 $129,899 146 $112,918 507 $101,509 145 $50,791 0 $0 56 $63,440 3 $67,327 APPLICATIONS WITHDRAWN 7 $125,954 80 $149,611 189 $105,391 19 $54,287 0 $0 22 $77,252 3 $57,400 FILES CLOSED FOR INCOMPLETENESS 0 $0 32 $115,409 79 $141,570 6 $70,412 0 $0 10 $56,339 0 $0
Aggregated Statistics For Year 2006(Based on 5 full and 8 partial tracts) A) FHA, FSA/RHS & VA B) Conventional C) Refinancings D) Home Improvement Loans E) Loans on Dwellings For 5+ Families F) Non-occupant Loans on G) Loans On Manufactured Number Average Value Number Average Value Number Average Value Number Average Value Number Average Value Number Average Value Number Average Value
LOANS ORIGINATED 45 $115,997 570 $119,479 504 $92,457 82 $40,193 1 $7,348,650 145 $75,267 7 $42,644 APPLICATIONS APPROVED, NOT ACCEPTED 6 $93,157 80 $108,819 112 $92,049 14 $33,706 0 $0 21 $75,052 8 $58,884 APPLICATIONS DENIED 7 $95,487 172 $89,327 505 $92,400 146 $39,479 2 $639,750 54 $68,472 9 $39,990 APPLICATIONS WITHDRAWN 7 $109,027 101 $118,664 245 $108,160 25 $81,297 0 $0 24 $76,252 1 $72,170 FILES CLOSED FOR INCOMPLETENESS 1 $98,530 37 $110,946 99 $119,930 7 $50,831 0 $0 9 $52,727 0 $0
Aggregated Statistics For Year 2005(Based on 5 full and 8 partial tracts) A) FHA, FSA/RHS & VA B) Conventional C) Refinancings D) Home Improvement Loans E) Loans on Dwellings For 5+ Families F) Non-occupant Loans on G) Loans On Manufactured Number Average Value Number Average Value Number Average Value Number Average Value Number Average Value Number Average Value Number Average Value
LOANS ORIGINATED 43 $108,593 617 $118,708 566 $95,650 100 $39,688 1 $3,515,200 122 $59,517 5 $60,702 APPLICATIONS APPROVED, NOT ACCEPTED 3 $100,493 84 $96,898 170 $83,120 19 $55,529 0 $0 8 $127,270 4 $50,805 APPLICATIONS DENIED 8 $115,595 151 $88,451 600 $89,441 162 $35,498 0 $0 37 $54,887 11 $64,446 APPLICATIONS WITHDRAWN 7 $90,677 108 $105,885 248 $104,420 41 $88,644 0 $0 21 $78,400 2 $72,320 FILES CLOSED FOR INCOMPLETENESS 0 $0 23 $94,229 126 $108,050 6 $63,435 0 $0 4 $60,705 1 $101,890
Aggregated Statistics For Year 2004(Based on 5 full and 8 partial tracts) A) FHA, FSA/RHS & VA B) Conventional C) Refinancings D) Home Improvement Loans E) Loans on Dwellings For 5+ Families F) Non-occupant Loans on G) Loans On Manufactured Number Average Value Number Average Value Number Average Value Number Average Value Number Average Value Number Average Value Number Average Value
LOANS ORIGINATED 52 $106,693 430 $121,164 578 $95,326 71 $31,329 2 $878,620 96 $51,882 8 $46,854 APPLICATIONS APPROVED, NOT ACCEPTED 6 $96,357 71 $94,646 192 $77,940 14 $42,324 0 $0 14 $56,961 7 $45,283 APPLICATIONS DENIED 16 $75,634 132 $79,323 578 $79,659 123 $30,771 0 $0 34 $51,664 23 $61,275 APPLICATIONS WITHDRAWN 4 $110,725 54 $111,263 230 $89,983 14 $39,698 0 $0 13 $55,028 2 $55,835 FILES CLOSED FOR INCOMPLETENESS 2 $69,125 19 $95,329 130 $103,410 4 $44,075 0 $0 8 $66,562 0 $0
Aggregated Statistics For Year 2003(Based on 5 full and 8 partial tracts) A) FHA, FSA/RHS & VA B) Conventional C) Refinancings D) Home Improvement Loans F) Non-occupant Loans on Number Average Value Number Average Value Number Average Value Number Average Value Number Average Value
LOANS ORIGINATED 54 $113,384 378 $117,327 930 $110,178 56 $31,510 74 $49,409 APPLICATIONS APPROVED, NOT ACCEPTED 2 $106,050 42 $104,854 188 $85,684 7 $29,409 7 $43,013 APPLICATIONS DENIED 12 $62,955 99 $72,343 511 $85,397 95 $24,931 32 $44,836 APPLICATIONS WITHDRAWN 4 $94,902 58 $109,951 208 $97,115 8 $42,950 11 $56,559 FILES CLOSED FOR INCOMPLETENESS 4 $94,748 14 $103,386 46 $94,788 1 $105,220 2 $79,435
Aggregated Statistics For Year 2002(Based on 5 full and 8 partial tracts) A) FHA, FSA/RHS & VA B) Conventional C) Refinancings D) Home Improvement Loans E) Loans on Dwellings For 5+ Families F) Non-occupant Loans on Number Average Value Number Average Value Number Average Value Number Average Value Number Average Value Number Average Value
LOANS ORIGINATED 108 $107,655 324 $115,962 622 $106,315 58 $25,144 2 $2,576,255 62 $50,695 APPLICATIONS APPROVED, NOT ACCEPTED 2 $78,395 29 $99,784 173 $69,896 9 $18,434 0 $0 7 $49,737 APPLICATIONS DENIED 7 $100,217 70 $68,906 388 $70,320 51 $22,133 0 $0 19 $39,317 APPLICATIONS WITHDRAWN 4 $92,490 32 $102,390 186 $88,408 5 $88,450 0 $0 7 $51,849 FILES CLOSED FOR INCOMPLETENESS 2 $64,160 10 $132,186 67 $89,225 1 $38,000 0 $0 1 $36,540
Aggregated Statistics For Year 2001(Based on 5 full and 8 partial tracts) A) FHA, FSA/RHS & VA B) Conventional C) Refinancings D) Home Improvement Loans F) Non-occupant Loans on Number Average Value Number Average Value Number Average Value Number Average Value Number Average Value
LOANS ORIGINATED 88 $88,154 257 $119,325 539 $98,196 66 $19,410 45 $67,694 APPLICATIONS APPROVED, NOT ACCEPTED 5 $128,316 32 $62,879 108 $67,702 15 $22,749 5 $38,140 APPLICATIONS DENIED 8 $68,301 100 $53,233 420 $63,291 82 $12,211 28 $48,741 APPLICATIONS WITHDRAWN 3 $115,373 36 $84,086 174 $75,465 9 $28,833 11 $49,566 FILES CLOSED FOR INCOMPLETENESS 2 $60,450 14 $88,989 47 $76,281 1 $8,710 4 $46,595
Aggregated Statistics For Year 2000(Based on 5 full and 8 partial tracts) A) FHA, FSA/RHS & VA B) Conventional C) Refinancings D) Home Improvement Loans E) Loans on Dwellings For 5+ Families F) Non-occupant Loans on Number Average Value Number Average Value Number Average Value Number Average Value Number Average Value Number Average Value
LOANS ORIGINATED 96 $84,064 233 $97,148 250 $59,966 75 $15,368 1 $26,000 33 $56,468 APPLICATIONS APPROVED, NOT ACCEPTED 7 $61,206 40 $50,916 59 $56,852 16 $18,352 0 $0 6 $32,957 APPLICATIONS DENIED 15 $79,891 208 $45,814 294 $55,375 98 $10,990 0 $0 24 $39,960 APPLICATIONS WITHDRAWN 15 $81,044 55 $70,878 114 $56,233 10 $38,801 0 $0 11 $42,970 FILES CLOSED FOR INCOMPLETENESS 2 $47,030 21 $65,040 106 $56,154 0 $0 0 $0 7 $29,679
Aggregated Statistics For Year 1999(Based on 4 full and 9 partial tracts) A) FHA, FSA/RHS & VA B) Conventional C) Refinancings D) Home Improvement Loans F) Non-occupant Loans on Number Average Value Number Average Value Number Average Value Number Average Value Number Average Value
LOANS ORIGINATED 85 $79,947 283 $107,353 302 $71,649 64 $17,296 31 $39,216 APPLICATIONS APPROVED, NOT ACCEPTED 1 $114,710 30 $54,516 44 $54,237 21 $23,327 6 $25,822 APPLICATIONS DENIED 28 $78,121 138 $48,379 215 $48,238 119 $13,663 25 $30,168 APPLICATIONS WITHDRAWN 9 $72,099 38 $75,124 105 $52,823 5 $32,888 9 $49,810 FILES CLOSED FOR INCOMPLETENESS 3 $81,803 10 $88,402 64 $52,992 0 $0 3 $36,420
Detailed mortgage data for all 13 tracts in Bessemer, AL
Private Mortgage Insurance Companies Aggregated Statistics For Year 2009(Based on 4 full and 5 partial tracts) A) Conventional B) Refinancings Number Average Value Number Average Value
LOANS ORIGINATED 18 $199,392 22 $214,219 APPLICATIONS APPROVED, NOT ACCEPTED 8 $210,428 7 $185,153 APPLICATIONS DENIED 3 $287,753 7 $167,364 APPLICATIONS WITHDRAWN 1 $92,550 0 $0 FILES CLOSED FOR INCOMPLETENESS 0 $0 1 $179,000
Aggregated Statistics For Year 2008(Based on 5 full and 8 partial tracts) A) Conventional B) Refinancings C) Non-occupant Loans on Number Average Value Number Average Value Number Average Value
LOANS ORIGINATED 82 $160,449 44 $162,539 12 $77,288 APPLICATIONS APPROVED, NOT ACCEPTED 31 $159,863 14 $211,053 4 $78,090 APPLICATIONS DENIED 5 $212,996 1 $112,310 1 $104,730 APPLICATIONS WITHDRAWN 3 $236,323 3 $210,343 0 $0 FILES CLOSED FOR INCOMPLETENESS 1 $123,680 3 $104,347 3 $108,810
Aggregated Statistics For Year 2007(Based on 5 full and 8 partial tracts) A) Conventional B) Refinancings C) Non-occupant Loans on Number Average Value Number Average Value Number Average Value
LOANS ORIGINATED 206 $143,821 61 $139,481 15 $85,651 APPLICATIONS APPROVED, NOT ACCEPTED 31 $135,571 21 $145,310 4 $52,630 APPLICATIONS DENIED 3 $108,567 5 $168,652 3 $100,460 APPLICATIONS WITHDRAWN 12 $134,301 6 $158,703 5 $63,280 FILES CLOSED FOR INCOMPLETENESS 2 $118,260 2 $87,580 2 $60,500
Aggregated Statistics For Year 2006(Based on 5 full and 8 partial tracts) A) Conventional B) Refinancings C) Non-occupant Loans on Number Average Value Number Average Value Number Average Value
LOANS ORIGINATED 108 $136,717 41 $122,445 15 $75,794 APPLICATIONS APPROVED, NOT ACCEPTED 14 $110,237 15 $111,543 7 $51,723 APPLICATIONS DENIED 1 $144,790 4 $84,855 4 $83,948 APPLICATIONS WITHDRAWN 5 $174,774 4 $89,375 1 $46,000 FILES CLOSED FOR INCOMPLETENESS 0 $0 0 $0 0 $0
Aggregated Statistics For Year 2005(Based on 5 full and 8 partial tracts) A) Conventional B) Refinancings C) Non-occupant Loans on Number Average Value Number Average Value Number Average Value
LOANS ORIGINATED 81 $126,813 41 $145,991 16 $54,542 APPLICATIONS APPROVED, NOT ACCEPTED 15 $149,217 7 $143,680 1 $32,000 APPLICATIONS DENIED 0 $0 0 $0 0 $0 APPLICATIONS WITHDRAWN 3 $118,977 4 $137,792 1 $129,460 FILES CLOSED FOR INCOMPLETENESS 0 $0 2 $74,630 1 $59,260
Aggregated Statistics For Year 2004(Based on 5 full and 8 partial tracts) A) Conventional B) Refinancings C) Non-occupant Loans on Number Average Value Number Average Value Number Average Value
LOANS ORIGINATED 102 $135,313 50 $119,377 10 $57,328 APPLICATIONS APPROVED, NOT ACCEPTED 15 $168,331 12 $151,260 3 $62,650 APPLICATIONS DENIED 1 $128,000 0 $0 0 $0 APPLICATIONS WITHDRAWN 4 $125,045 5 $145,054 1 $37,460 FILES CLOSED FOR INCOMPLETENESS 0 $0 0 $0 0 $0
Aggregated Statistics For Year 2003(Based on 5 full and 8 partial tracts) A) Conventional B) Refinancings C) Non-occupant Loans on Number Average Value Number Average Value Number Average Value
LOANS ORIGINATED 93 $131,877 99 $138,280 10 $47,840 APPLICATIONS APPROVED, NOT ACCEPTED 8 $121,586 27 $118,647 1 $31,370 APPLICATIONS DENIED 1 $101,470 1 $181,750 2 $115,470 APPLICATIONS WITHDRAWN 4 $152,160 8 $138,370 2 $62,380 FILES CLOSED FOR INCOMPLETENESS 0 $0 0 $0 0 $0
Aggregated Statistics For Year 2002(Based on 5 full and 8 partial tracts) A) Conventional B) Refinancings C) Non-occupant Loans on Number Average Value Number Average Value Number Average Value
LOANS ORIGINATED 102 $135,783 98 $130,622 8 $47,595 APPLICATIONS APPROVED, NOT ACCEPTED 11 $142,165 18 $105,926 2 $107,340 APPLICATIONS DENIED 1 $100,070 2 $74,450 0 $0 APPLICATIONS WITHDRAWN 4 $91,868 8 $139,200 1 $39,210 FILES CLOSED FOR INCOMPLETENESS 0 $0 1 $158,660 0 $0
Aggregated Statistics For Year 2001(Based on 5 full and 8 partial tracts) A) Conventional B) Refinancings C) Non-occupant Loans on Number Average Value Number Average Value Number Average Value
LOANS ORIGINATED 81 $150,998 82 $116,435 6 $98,048 APPLICATIONS APPROVED, NOT ACCEPTED 8 $139,121 16 $112,023 1 $79,880 APPLICATIONS DENIED 1 $73,060 8 $167,390 0 $0 APPLICATIONS WITHDRAWN 3 $123,773 1 $134,300 0 $0 FILES CLOSED FOR INCOMPLETENESS 2 $111,505 3 $62,563 0 $0
Aggregated Statistics For Year 2000(Based on 5 full and 7 partial tracts) A) Conventional B) Refinancings C) Non-occupant Loans on Number Average Value Number Average Value Number Average Value
LOANS ORIGINATED 66 $130,846 27 $85,592 5 $45,520 APPLICATIONS APPROVED, NOT ACCEPTED 4 $76,540 1 $300,730 1 $27,010 APPLICATIONS DENIED 2 $58,090 4 $76,632 1 $40,000 APPLICATIONS WITHDRAWN 1 $141,040 2 $149,630 0 $0 FILES CLOSED FOR INCOMPLETENESS 0 $0 0 $0 0 $0
Aggregated Statistics For Year 1999(Based on 4 full and 9 partial tracts) A) Conventional B) Refinancings C) Non-occupant Loans on Number Average Value Number Average Value Number Average Value
LOANS ORIGINATED 115 $144,255 28 $112,445 5 $56,494 APPLICATIONS APPROVED, NOT ACCEPTED 3 $90,257 7 $75,487 0 $0 APPLICATIONS DENIED 0 $0 2 $64,520 0 $0 APPLICATIONS WITHDRAWN 3 $69,263 1 $151,330 1 $15,960 FILES CLOSED FOR INCOMPLETENESS 1 $87,950 0 $0 0 $0
Fire-safe hotels and motels in Bessemer, Alabama:
Motel 6, 1000 Shiloh Ln, Bessemer, Alabama 35020 Phone: (205) 426-9646
Sleep Inn, 1259 Greenmor Dr, Bessemer, Alabama 35022 Phone: (205) 424-0000, Fax: (205) 424-1971
Ramada Inn, 1121 9TH Ave SW, Bessemer, Alabama 35023 Phone: (205) 424-9780, Fax: (205) 424-9780
Country Inn And Suites-Bessemer, 4985 Academy Ct, Bessemer, Alabama 35022 Phone: (205) 481-0007, Fax: (205) 481-0070
Hampton Inn-Bessemer, 4910 Civic Ln, Bessemer, Alabama 35022 Phone: (205) 425-2010, Fax: (205) 425-1630
Holiday Inn Express (saham Group LLC), 5001 Academy Ln, Bessemer, Alabama 35022 Phone: (205) 424-2600, Fax: (205) 428-9972
Value Place, 5535 Academy Way, Bessemer, Alabama 35022 Phone: (205) 428-4140
Best Western Hotel & Suites, 5041 Academy Ln, Bessemer, Alabama 35022 Phone: (205) 481-1950, Fax: (205) 481-2597
All 8 fire-safe hotels and motels in Bessemer, Alabama
Most common first names in Bessemer, AL among deceased individuals Name Count Lived (average)
James 862 71.0 years Mary 778 77.4 years John 706 73.4 years William 673 73.4 years Willie 618 72.6 years Robert 487 70.5 years Annie 360 78.2 years George 335 73.1 years Charles 255 68.1 years Henry 232 72.6 years
Most common last names in Bessemer, AL among deceased individuals Last name Count Lived (average)
Smith 505 72.4 years Williams 445 73.5 years Jones 445 74.2 years Johnson 393 73.0 years Brown 273 73.1 years Davis 271 73.4 years Thomas 228 71.7 years Jackson 219 72.6 years Harris 204 73.8 years Moore 200 75.5 years
Bessemer compared to Alabama state average:
Median household income below state average. Black race population percentage above state average. Median age below state average. Length of stay since moving in significantly above state average. House age above state average.
#8 on the list of "Top 101 cities with the highest city-data.com crime index, excludes tourist destinations and others with a lot of outsiders visiting based on city industries data (population 5,000+)"
#24 on the list of "Top 101 cities with the highest number of assaults per 100,000 residents, excludes tourist destinations and others with a lot of outsiders visiting based on city industries data (population 5,000+)"
#24 on the list of "Top 101 cities with the highest number of burglaries per 100,000 residents, excludes tourist destinations and others with a lot of outsiders visiting based on city industries data (population 5,000+)"
#32 on the list of "Top 101 cities with the highest number of robberies per 100,000 residents, excludes tourist destinations and others with a lot of outsiders visiting based on city industries data (population 5,000+)"
#35 on the list of "Top 101 cities with the highest number of thefts per 100,000 residents, excludes tourist destinations and others with a lot of outsiders visiting based on city industries data (population 5,000+)"
#39 on the list of "Top 101 cities with the lowest percentage of workers working at home, population 5,000+"
#53 on the list of "Top 100 least-safe cities (highest city-data.com crime index)"
#68 on the list of "Top 101 cities with the highest number of auto thefts per 100,000 residents, excludes tourist destinations and others with a lot of outsiders visiting based on city industries data (population 5,000+)"
#69 on the list of "Top 101 cities with largest percentage of females in industries: utilities (population 5,000+)"
#91 on the list of "Top 101 cities where residents moved in more then 10 years ago (10,000+ households)"
#4 (35211) on the list of "Top 101 zip codes with the largest percentage of United States first ancestries (pop 5,000+)"
#5 on the list of "Top 101 counties with the highest number of infant deaths per 1000 residents 2007-2013 (pop. 50,000+)"
#5 on the list of "Top 101 counties with the most Black Protestant adherents"
#5 on the list of "Top 101 counties with the most Black Protestant congregations"
#9 on the list of "Top 101 counties with the highest average weight of females"
#9 on the list of "Top 101 counties with the most Evangelical Protestant adherents"
Top Patent Applicants
Heather Nettles (3)
Ross Jacobs (3)
Sylvie Stacy (3)
Daniel Copeland (3)
William A. Openshaw (3)
Marshall Scott Jones (2)
David J. Hilton (2)
Kathy Hymer (1)
Chris Prantl (1)
William H. Fargason, Iii (1)
Total of 36 patent applications in 2008-2024.
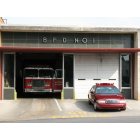
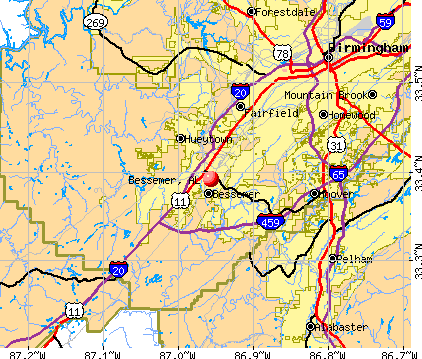


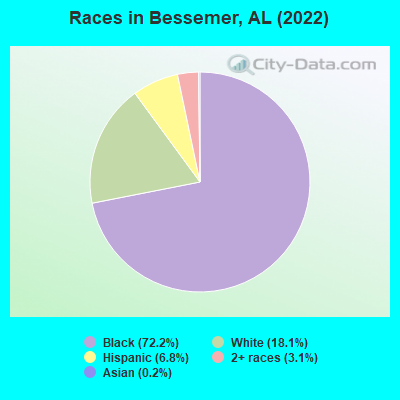
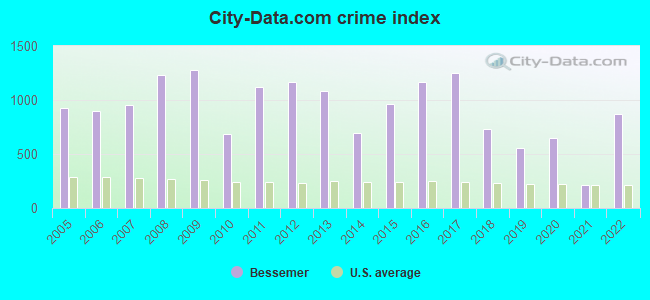
 Recent articles from our blog. Our writers, many of them Ph.D. graduates or candidates, create easy-to-read articles on a wide variety of topics.

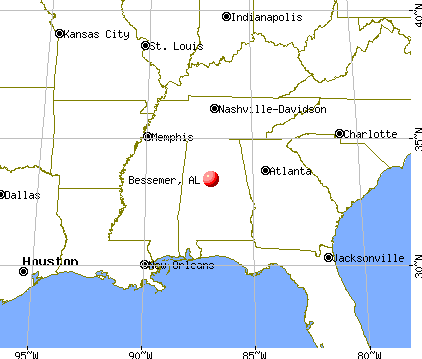
 (8.8 miles
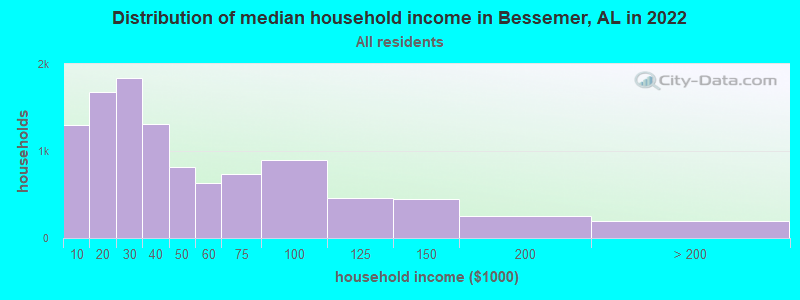
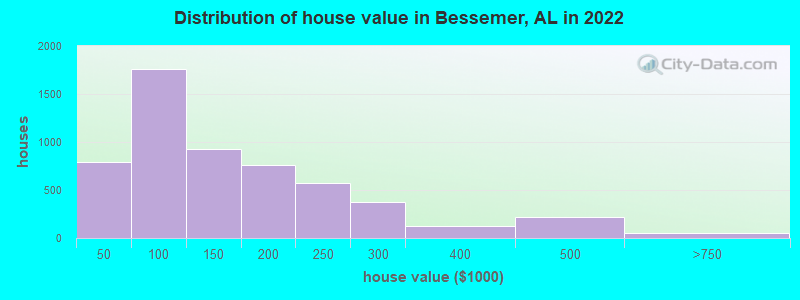
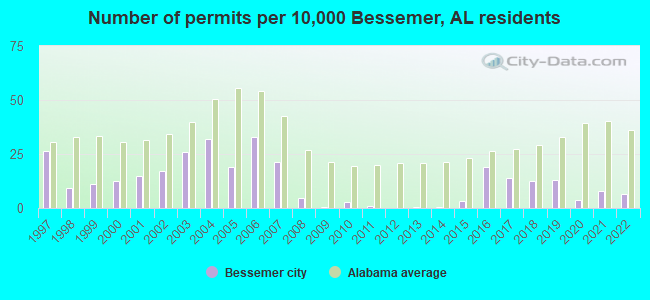
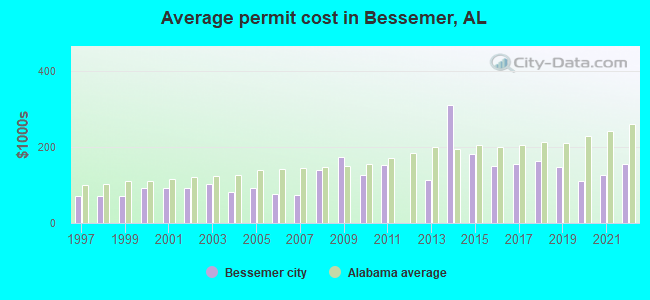
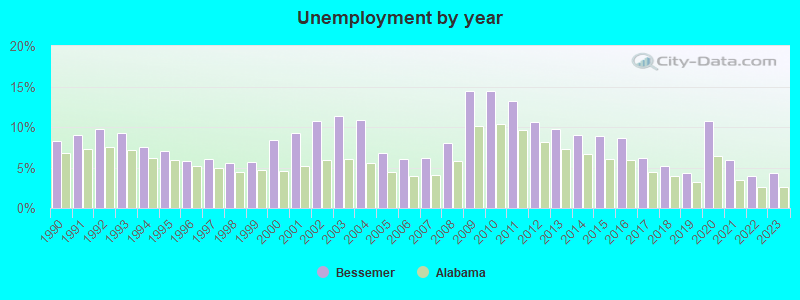
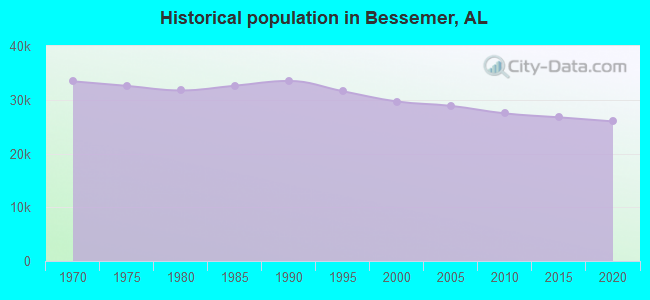
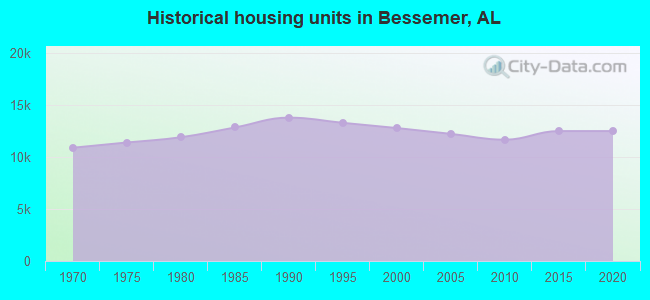
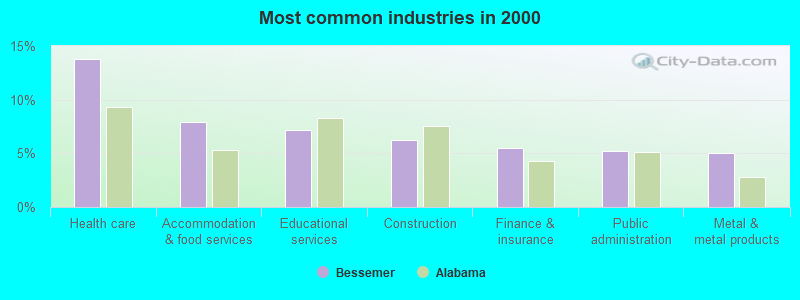
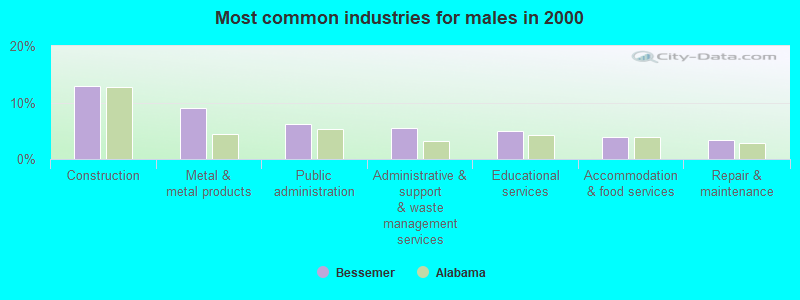
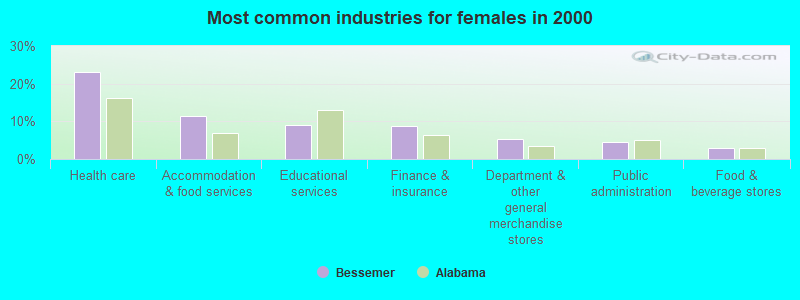
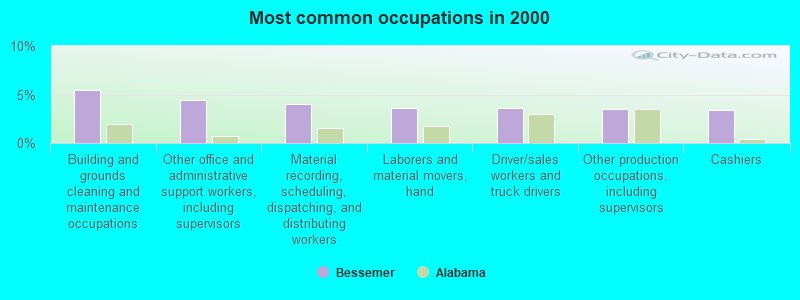
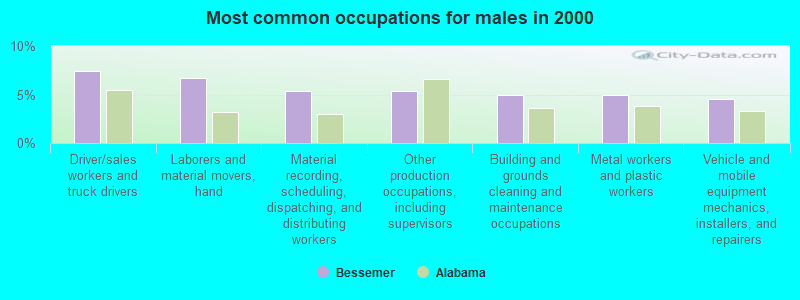
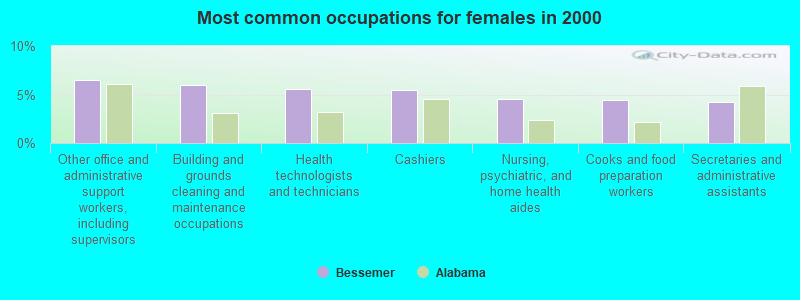
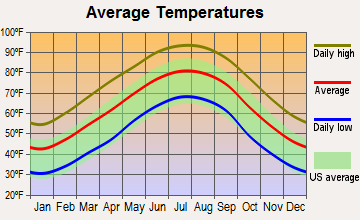
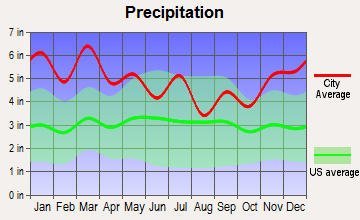
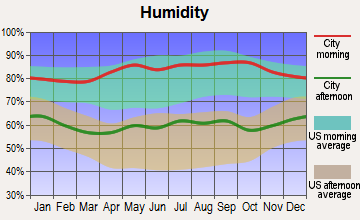
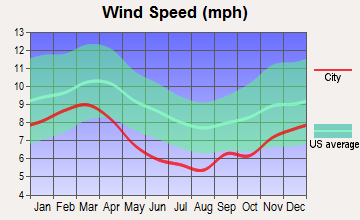
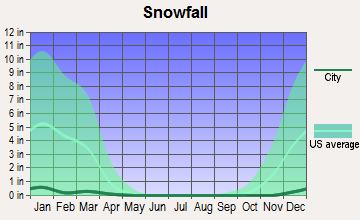
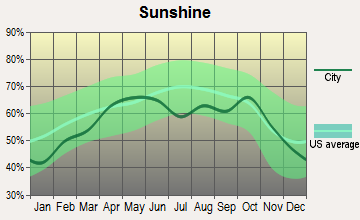
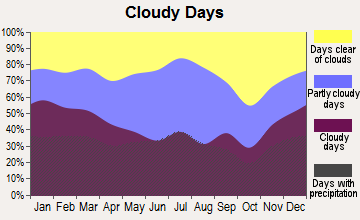


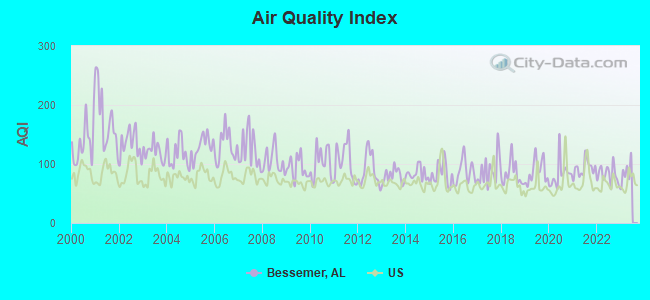
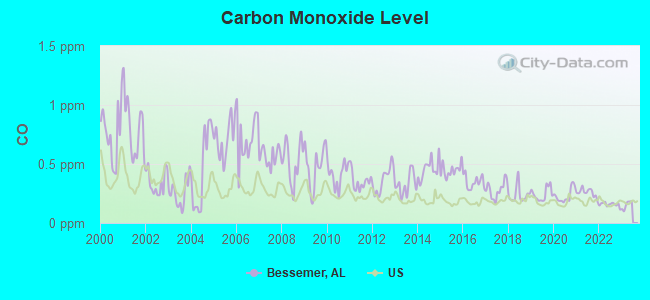
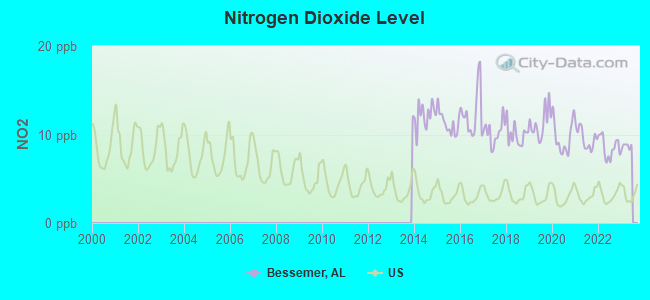
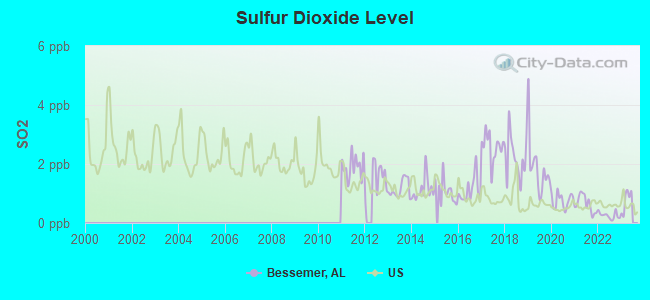
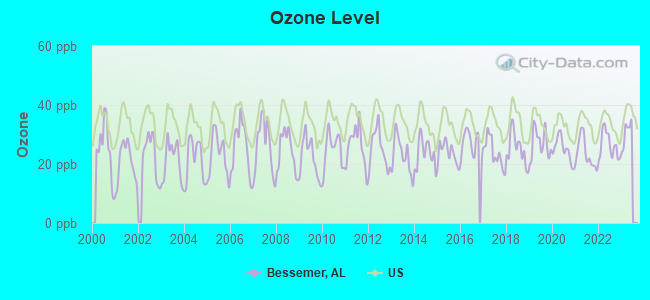
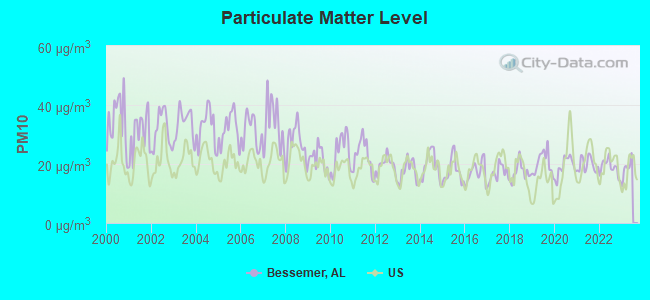
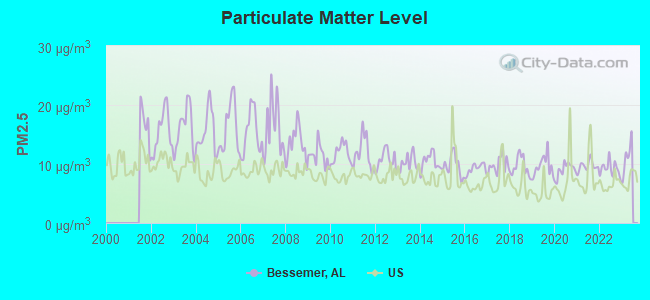
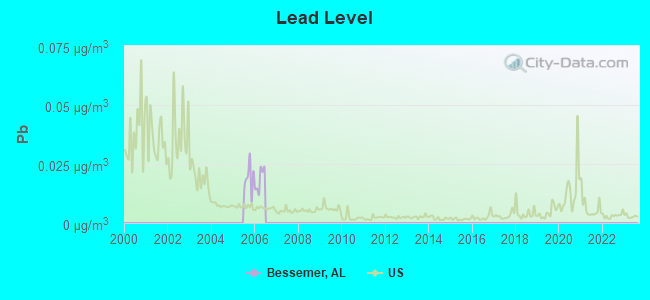
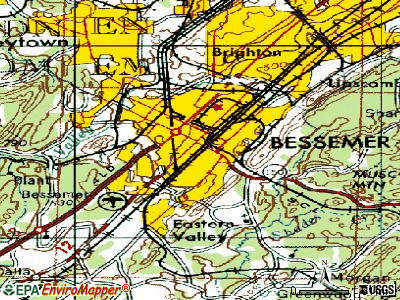
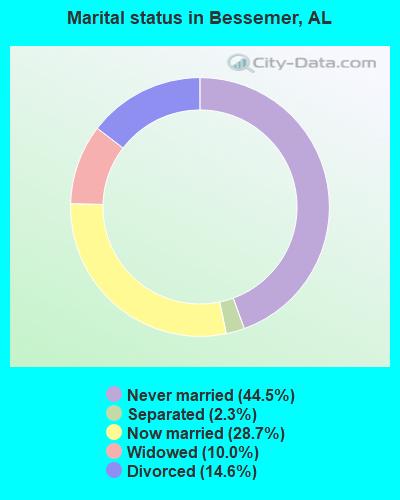
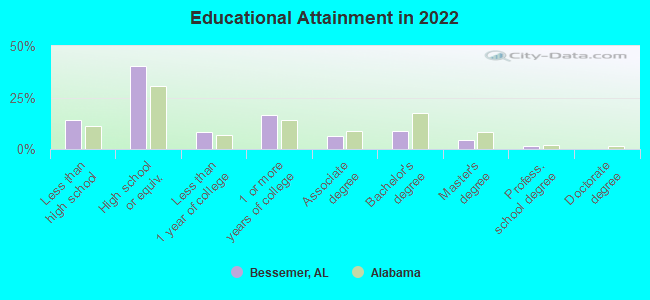
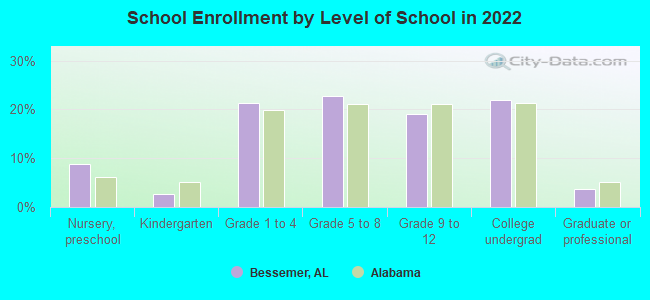
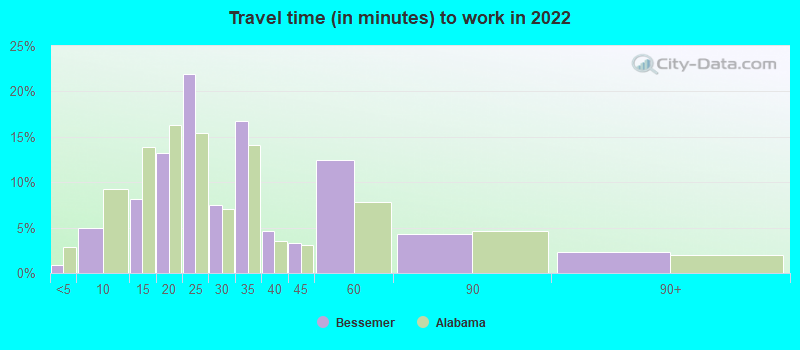
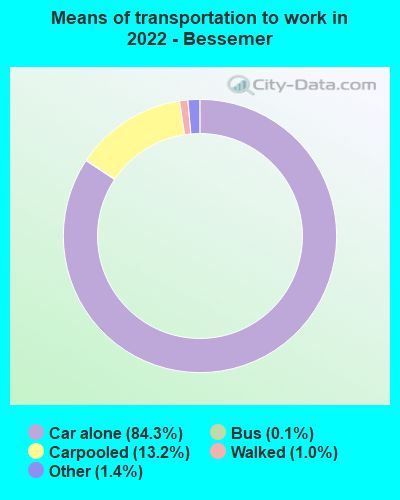
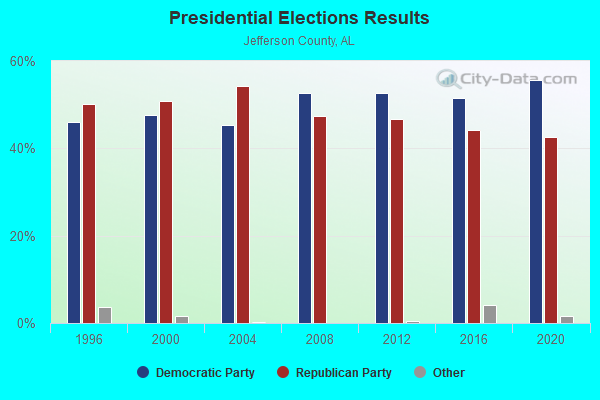
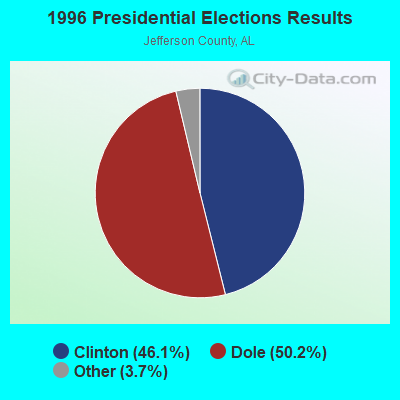
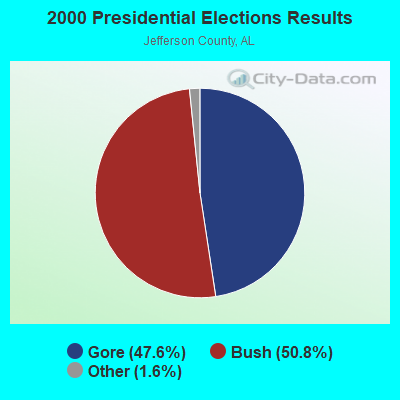
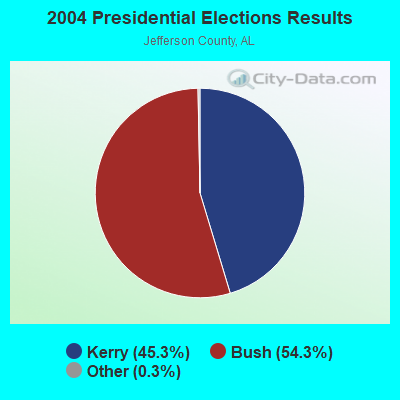
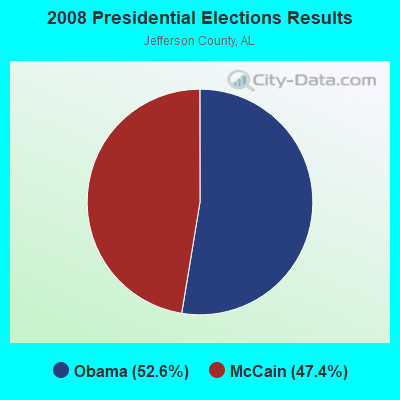
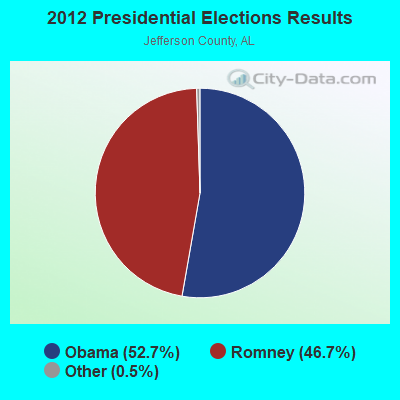
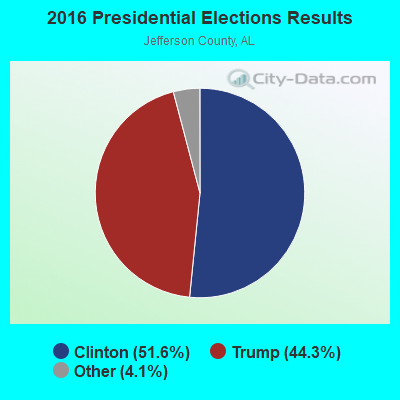
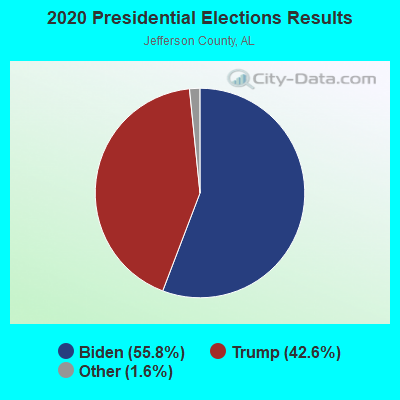
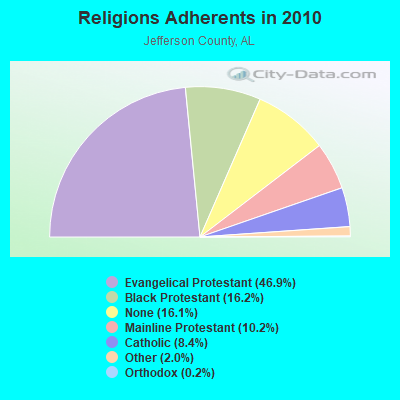
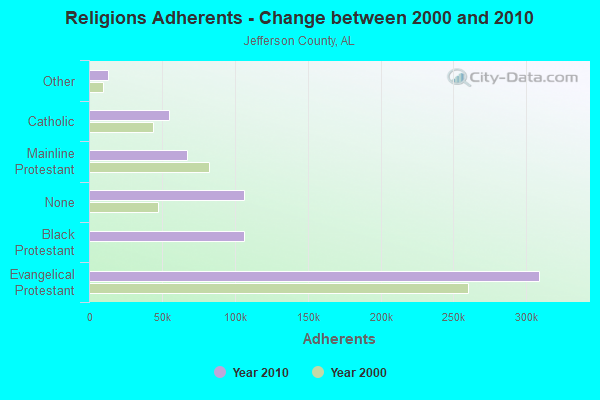
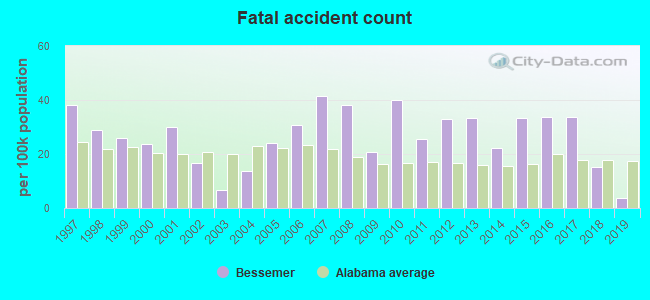
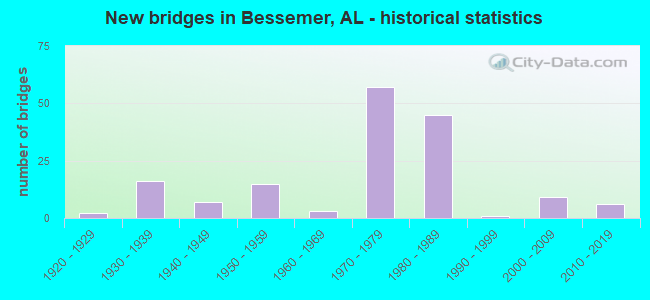
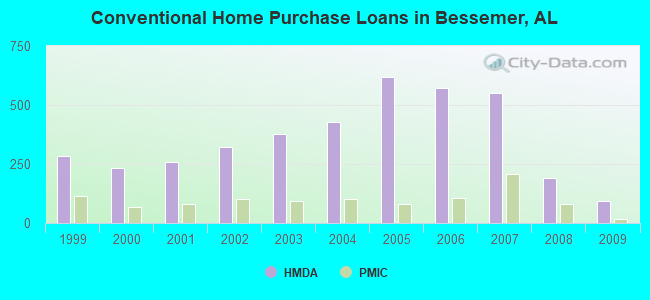
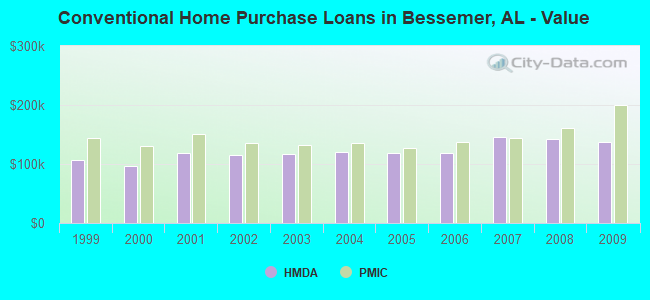
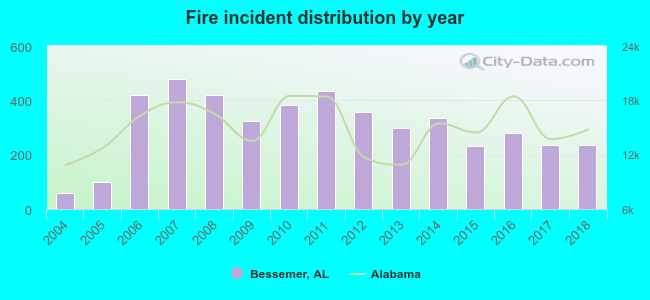 According to the data from the years 2004 - 2018 the average number of fires per year is 306. The highest number of reported fire incidents - 479 took place in 2007, and the least - 59 in 2004. The data has an increasing trend.
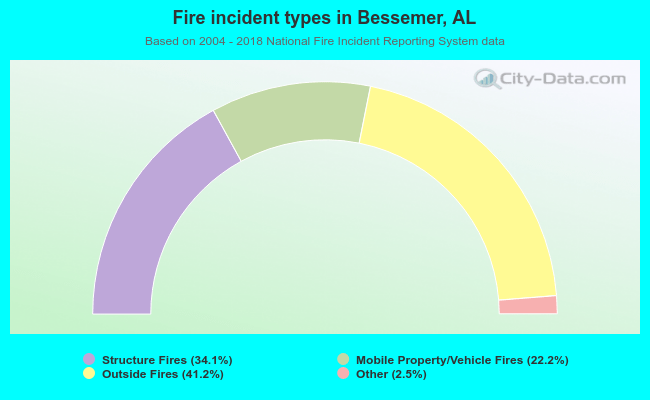 When looking into fire subcategories, the most reports belonged to: Outside Fires (41.2%), and Structure Fires (34.1%).