Estimated zip code population in 2022: 13,605 Zip code population in 2010: 14,194 Zip code population in 2000: 15,322
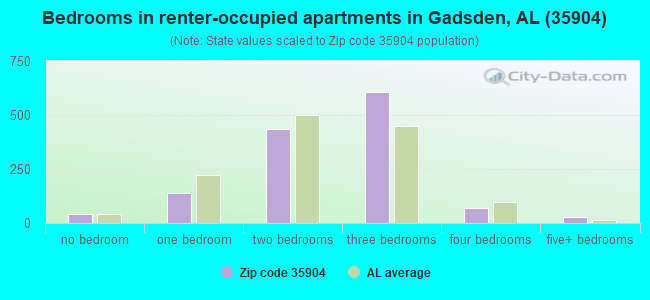
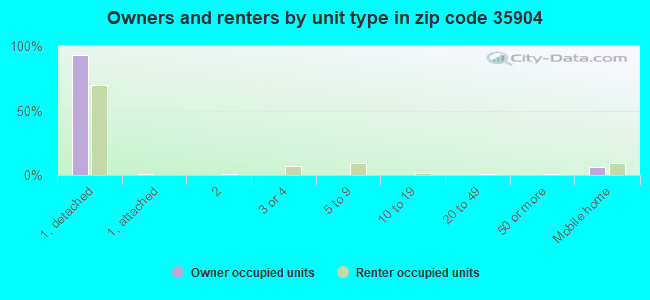
Houses and condos: 6,496 Renter-occupied apartments: 1,325
% of renters here:
25%
State:
30%
March 2022 cost of living index in zip code 35904: 80.4 (low, U.S. average is 100)
Land area: 46.2 sq. mi. Water area: 0.3 sq. mi.
Population density: 295 people per square mile
(very low).
OSM Map
General Map
Google Map
MSN Map
OSM Map
General Map
Google Map
MSN Map
OSM Map
General Map
Google Map
MSN Map
OSM Map
General Map
Google Map
MSN Map
Please wait while loading the map...
Real estate property taxes paid for housing units in 2022:
This zip code:
0.4% ($458)
Alabama:
0.4% ($718)
Median real estate property taxes paid for housing units with mortgages in 2022: $532 (0.4%) Median real estate property taxes paid for housing units with no mortgage in 2022: $399 (0.5%)
Business Search- 14 Million verified businesses
Males: 6,788
(49.9%)
Females: 6,816
(50.1%)
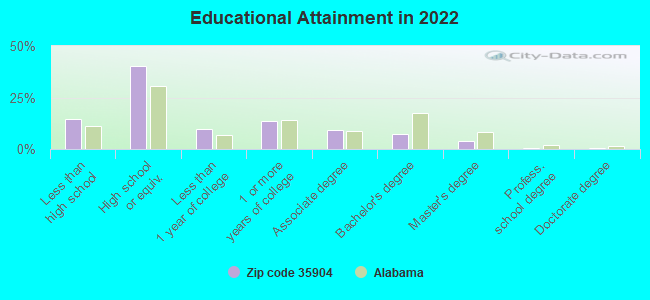
For population 25 years and over in 35904:
High school or higher: 84.4%
Bachelor's degree or higher: 12.3%
Graduate or professional degree: 5.0%
Unemployed: 8.1%
Mean travel time to work (commute): 22.9 minutes
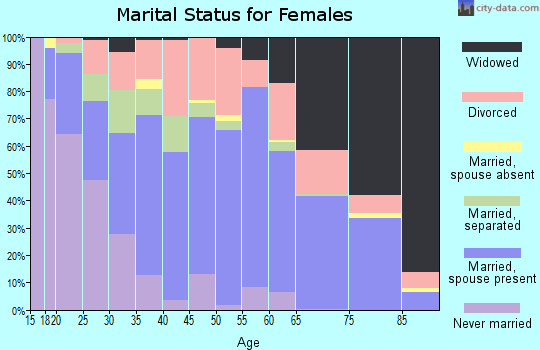
For population 15 years and over in 35904:
Never married: 28.4%
Now married: 38.6%
Separated: 2.2%
Widowed: 12.9%
Divorced: 17.9%
Zip code 35904 compared to state average:
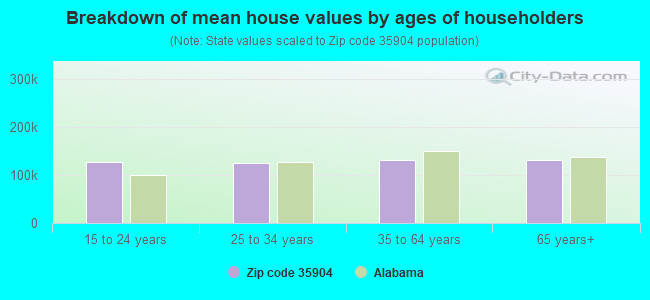
Median house value below state average.
Unemployed percentage above state average.
Length of stay since moving in significantly above state average.
House age above state average.
Number of college students below state average.
Percentage of population with a bachelor's degree or higher significantly below state average.
Estimated median house/condo value in 2022: $106,049
35904:
$106,049
Alabama:
$200,900
According to our research of Alabama and other state lists, there were 41 registered sex offenders living in 35904 zip code as of April 27, 2024. The ratio of all residents to sex offenders in zip code 35904 is 355 to 1. The ratio of registered sex offenders to all residents in this zip code is near the state average.
Median resident age:
This zip code:
41.9 years
Alabama median age:
39.6 years
Average household size:
This zip code:
2.6 people
Alabama:
2.5 people
Averages for the 2020 tax year for zip code 35904, filed in 2021:
Average Adjusted Gross Income (AGI) in 2020: $39,503 (Individual Income Tax Returns)
Here:
$39,503
State:
$63,984
Salary/wage: $35,950 (reported on 81.5% of returns)
Here:
$35,950
State:
$52,834
(% of AGI for various income ranges: 1087.5% for AGIs below $25k, 3695.5% for AGIs $25k-50k, 6481.2% for AGIs $50k-75k, 9491.7% for AGIs $75k-100k, 15238.5% for AGIs $100k-200k)
Taxable interest for individuals: $874 (reported on 20.3% of returns)
This zip code:
$874
Alabama:
$1,615
(% of AGI for various income ranges: 8.3% for AGIs below $25k, 15.4% for AGIs $25k-50k, 42.5% for AGIs $50k-75k, 56.2% for AGIs $75k-100k, 105.0% for AGIs $100k-200k)
Ordinary dividends: $3,473 (reported on 6.6% of returns)
Here:
$3,473
State:
$7,660
(% of AGI for various income ranges: 10.0% for AGIs below $25k, 11.7% for AGIs $25k-50k, 45.8% for AGIs $50k-75k, 104.6% for AGIs $75k-100k, 161.5% for AGIs $100k-200k)
Net capital gain/loss in AGI: +$5,717 (reported on 6.4% of returns)
Here:
+$5,717
State:
+$23,528
(% of AGI for various income ranges: 5.1% for AGIs below $25k, 5.0% for AGIs $25k-50k, 19.0% for AGIs $50k-75k, 57.9% for AGIs $75k-100k, 345.5% for AGIs $100k-200k)
Profit/loss from business: +$7,704 (reported on 14.4% of returns)
Here:
+$7,704
State:
+$9,534
(% of AGI for various income ranges: 143.2% for AGIs below $25k, 62.8% for AGIs $25k-50k, 115.2% for AGIs $50k-75k, 342.5% for AGIs $75k-100k, 549.5% for AGIs $100k-200k)
Taxable individual retirement arrangement distribution: $13,254 (reported on 6.2% of returns)
35904:
$13,254
Alabama:
$19,004
(% of AGI for various income ranges: 28.1% for AGIs below $25k, 54.0% for AGIs $25k-50k, 241.2% for AGIs $50k-75k, 233.3% for AGIs $75k-100k, 783.0% for AGIs $100k-200k)
Total itemized deductions: $29,365 (reported on 3.0% of returns)
Here:
$29,365
State:
$37,338
(% of AGI for various income ranges: 126.5% for AGIs $25k-50k, 159.2% for AGIs $50k-75k, 287.9% for AGIs $75k-100k, 933.0% for AGIs $100k-200k)
Charity contributions: $10,580 (reported on 2.7% of returns)
Here:
$10,580
State:
$18,005
(% of AGI for various income ranges: 31.7% for AGIs $25k-50k, 34.2% for AGIs $50k-75k, 119.2% for AGIs $75k-100k, 360.5% for AGIs $100k-200k)
Taxes paid: $5,300 (reported on 2.7% of returns)
35904:
$5,300
State:
$6,484
(% of AGI for various income ranges: 9.4% for AGIs $25k-50k, 25.6% for AGIs $50k-75k, 49.6% for AGIs $75k-100k, 212.0% for AGIs $100k-200k)
Earned income credit: $2,625 (reported on 28.8% of returns)
Here:
$2,625
State:
$2,628
(% of AGI for various income ranges: 148.4% for AGIs below $25k, 95.4% for AGIs $25k-50k, 2.5% for AGIs $50k-75k)
Percentage of individuals using paid preparers for their 2020 taxes: 94.7%
Here:
95%
State:
93%
(% for various income ranges: 95.3% for AGIs below $25k, 93.3% for AGIs $25k-50k, 94.4% for AGIs $50k-75k, 97.1% for AGIs $75k-100k, 93.9% for AGIs $100k-200k, 100.0% for AGIs over 200k)
Averages for the 2012 tax year for zip code 35904, filed in 2013:
Average Adjusted Gross Income (AGI) in 2012: $34,877 (Individual Income Tax Returns)
Here:
$34,877
State:
$52,001
Salary/wage: $31,867 (reported on 82.8% of returns)
Here:
$31,867
State:
$43,822
(% of AGI for various income ranges: 74.1% for AGIs below $25k, 80.1% for AGIs $25k-50k, 79.4% for AGIs $50k-75k, 77.2% for AGIs $75k-100k, 71.0% for AGIs $100k-200k, 47.4% for AGIs over 200k)
Taxable interest for individuals: $1,196 (reported on 22.9% of returns)
This zip code:
$1,196
Alabama:
$1,592
(% of AGI for various income ranges: 1.1% for AGIs below $25k, 0.7% for AGIs $25k-50k, 0.9% for AGIs $50k-75k, 0.6% for AGIs $75k-100k, 0.9% for AGIs $100k-200k)
Ordinary dividends: $3,011 (reported on 8.1% of returns)
Here:
$3,011
State:
$5,697
(% of AGI for various income ranges: 0.6% for AGIs below $25k, 0.3% for AGIs $25k-50k, 0.8% for AGIs $50k-75k, 1.0% for AGIs $75k-100k, 1.3% for AGIs $100k-200k)
Net capital gain/loss in AGI: +$1,334 (reported on 5.9% of returns)
Here:
+$1,334
State:
+$13,286
(% of AGI for various income ranges: 0.4% for AGIs $50k-75k, 1.4% for AGIs $100k-200k)
Profit/loss from business: +$7,435 (reported on 15.3% of returns)
Here:
+$7,435
State:
+$9,151
(% of AGI for various income ranges: 9.5% for AGIs below $25k, 2.1% for AGIs $25k-50k, 1.3% for AGIs $50k-75k, 2.1% for AGIs $75k-100k, 1.7% for AGIs $100k-200k)
Taxable individual retirement arrangement distribution: $10,491 (reported on 7.9% of returns)
35904:
$10,491
Alabama:
$14,992
(% of AGI for various income ranges: 2.4% for AGIs below $25k, 1.9% for AGIs $25k-50k, 2.6% for AGIs $50k-75k, 1.9% for AGIs $75k-100k, 4.3% for AGIs $100k-200k)
Total itemized deductions: $17,832 (26% of AGI, reported on 18.5% of returns)
Here:
$17,832
State:
$21,388
Here:
26.2% of AGI
State:
20.1% of AGI
(% of AGI for various income ranges: 5.8% for AGIs below $25k, 8.3% for AGIs $25k-50k, 10.5% for AGIs $50k-75k, 10.3% for AGIs $75k-100k, 12.2% for AGIs $100k-200k, 16.2% for AGIs over 200k)
Charity contributions: $4,784 (reported on 15.9% of returns)
Here:
$4,784
State:
$5,925
(% of AGI for various income ranges: 0.8% for AGIs below $25k, 1.5% for AGIs $25k-50k, 2.4% for AGIs $50k-75k, 2.6% for AGIs $75k-100k, 5.1% for AGIs $100k-200k)
Taxes paid: $3,762 (reported on 18.3% of returns)
35904:
$3,762
State:
$5,272
(% of AGI for various income ranges: 0.6% for AGIs below $25k, 1.3% for AGIs $25k-50k, 2.2% for AGIs $50k-75k, 2.7% for AGIs $75k-100k, 3.5% for AGIs $100k-200k, 4.0% for AGIs over 200k)
Earned income credit: $2,610 (reported on 33.8% of returns)
Here:
$2,610
State:
$2,646
(% of AGI for various income ranges: 10.7% for AGIs below $25k, 1.6% for AGIs $25k-50k)
Percentage of individuals using paid preparers for their 2012 taxes: 67.7%
Here:
68%
State:
60%
(% for various income ranges: 64.9% for AGIs below $25k, 70.7% for AGIs $25k-50k, 69.8% for AGIs $50k-75k, 70.6% for AGIs $75k-100k, 81.0% for AGIs $100k-200k)
Averages for the 2004 tax year for zip code 35904, filed in 2005:
Average Adjusted Gross Income (AGI) in 2004: $29,393 (Individual Income Tax Returns)
Here:
$29,393
State:
$42,302
Salary/wage: $27,712 (reported on 83.2% of returns)
Here:
$27,712
State:
$36,626
(% of AGI for various income ranges: 109.8% for AGIs below $10k, 76.6% for AGIs $10k-25k, 81.9% for AGIs $25k-50k, 80.1% for AGIs $50k-75k, 79.6% for AGIs $75k-100k, 60.6% for AGIs over 100k)
Taxable interest for individuals: $1,610 (reported on 32.6% of returns)
This zip code:
$1,610
Alabama:
$1,827
(% of AGI for various income ranges: 4.6% for AGIs below $10k, 2.4% for AGIs $10k-25k, 1.4% for AGIs $25k-50k, 1.7% for AGIs $50k-75k, 1.6% for AGIs $75k-100k, 1.4% for AGIs over 100k)
Taxable dividends: $2,448 (reported on 10.7% of returns)
Here:
$2,448
State:
$4,206
(% of AGI for various income ranges: 1.8% for AGIs below $10k, 0.5% for AGIs $10k-25k, 0.5% for AGIs $25k-50k, 1.0% for AGIs $50k-75k, 0.9% for AGIs $75k-100k, 2.0% for AGIs over 100k)
Net capital gain/loss: +$2,533 (reported on 8.1% of returns)
Here:
+$2,533
State:
+$13,031
(% of AGI for various income ranges: 0.4% for AGIs below $10k, 0.2% for AGIs $10k-25k, 0.1% for AGIs $25k-50k, 0.8% for AGIs $50k-75k, -0.0% for AGIs $75k-100k, 3.6% for AGIs over 100k)
Profit/loss from business: +$5,138 (reported on 14.6% of returns)
Here:
+$5,138
State:
+$8,302
(% of AGI for various income ranges: 11.0% for AGIs below $10k, 4.9% for AGIs $10k-25k, 1.4% for AGIs $25k-50k, 0.7% for AGIs $50k-75k, 0.3% for AGIs $75k-100k, 4.9% for AGIs over 100k)
IRA payment deduction: $2,565 (reported on 1.1% of returns)
35904:
$2,565
Alabama:
$3,006
Total itemized deductions: $14,013 (25% of AGI, reported on 21.1% of returns)
Here:
$14,013
State:
$17,623
Here:
24.7% of AGI
State:
20.8% of AGI
(% of AGI for various income ranges: 8.2% for AGIs below $10k, 6.7% for AGIs $10k-25k, 9.3% for AGIs $25k-50k, 11.5% for AGIs $50k-75k, 13.0% for AGIs $75k-100k, 12.4% for AGIs over 100k)
Charity contributions deductions: $3,666 (6% of AGI, reported on 18.9% of returns)
Here:
$3,666
State:
$4,768
Here:
6.3% of AGI
State:
5.4% of AGI
(% of AGI for various income ranges: 1.1% for AGIs below $10k, 1.3% for AGIs $10k-25k, 1.9% for AGIs $25k-50k, 2.8% for AGIs $50k-75k, 3.3% for AGIs $75k-100k, 4.0% for AGIs over 100k)
Total tax: $3,553 (reported on 66.0% of returns)
35904:
$3,553
State:
$6,905
(% of AGI for various income ranges: 3.3% for AGIs below $10k, 3.2% for AGIs $10k-25k, 5.9% for AGIs $25k-50k, 8.6% for AGIs $50k-75k, 10.7% for AGIs $75k-100k, 18.3% for AGIs over 100k)
Earned income credit: $1,949 (reported on 29.1% of returns)
Here:
$1,949
State:
$2,048
Percentage of individuals using paid preparers for their 2004 taxes: 74.8%
Here:
75%
State:
65%
(% for various income ranges: 69.0% for AGIs below $10k, 76.9% for AGIs $10k-25k, 76.6% for AGIs $25k-50k, 74.9% for AGIs $50k-75k, 74.7% for AGIs $75k-100k, 80.5% for AGIs over 100k)
Likely homosexual households (counted as self-reported same-sex unmarried-partner households)
Lesbian couples: 0.2% of all households
Gay men: 0.1% of all households
Household received Food Stamps/SNAP in the past 12 months: 982 Household did not receive Food Stamps/SNAP in the past 12 months: 4,264
Women who had a birth in the past 12 months: 135 (45 now married, 74 unmarried) Women who did not have a birth in the past 12 months: 2,403 (1,011 now married, 1,392 unmarried)
Housing units in zip code 35904 with a mortgage: 1,352 (172 second mortgage, 161 both second mortgage and home equity loan) Median monthly owner costs for units with a mortgage: $1,063 Median monthly owner costs for units without a mortgage: $331
Residents with income below the poverty level in 2022:
This zip code:
24.0%
Whole state:
16.2%
Residents with income below 50% of the poverty level in 2022:
This zip code:
16.9%
Whole state:
8.6%
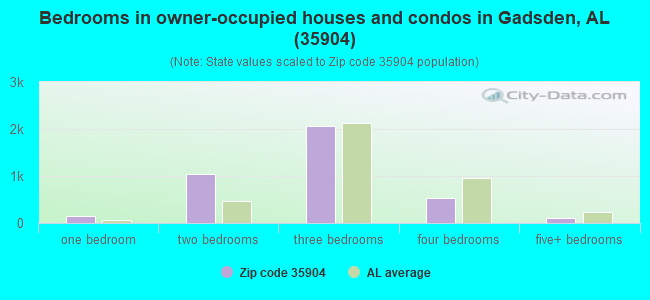
Median number of rooms in houses and condos:
Here:
6.1
State:
6.5
Median number of rooms in apartments:
Here:
5.3
State:
4.7
Notable locations in this zip code not listed on our city pages
Notable locations in zip code 35904: Airport Industrial Park (A), Happy Hill Hog Farm (B), Tuckahoe Golf Course (C), Lookout Mountain Volunteer Fire Department (D), Gadsden Fire Department Station 4 (E), Gadsden Fire Department Station 7 (F), Gadsden Fire Department Station 5 (G), Highland Volunteer Fire Department (H). Display/hide their locations on the map
Churches in zip code 35904 include: Mount Pisgah Missionary Baptist Church (A), Pleasant Hill Methodist Church (B), New Home Missionary Baptist Church (C), Mount Lookout Congregational Methodist Church (D), McCauley Chapel Methodist Church (E), Lookout Mountain Freewill Baptist Church (F), Union Tabernacle (G), Gospel Temple (H), Fairview Baptist Church (I). Display/hide their locations on the map
Streams, rivers, and creeks: Mud Spring Branch (A), Hog Pen Branch (B), Gladden Branch (C), Forney Branch (D), Little Wills Creek (E). Display/hide their locations on the map
In group quarters: 277 (-1 institutionalized population)
Size of family households: 1,430 2-persons, 672 3-persons, 605 4-persons, 156 5-persons, 113 6-persons, 85 7-or-more-persons
Size of nonfamily households: 1,786 1-person, 373 2-persons
1,385 married couples with children.
1,085 single-parent households (395 men, 690 women).
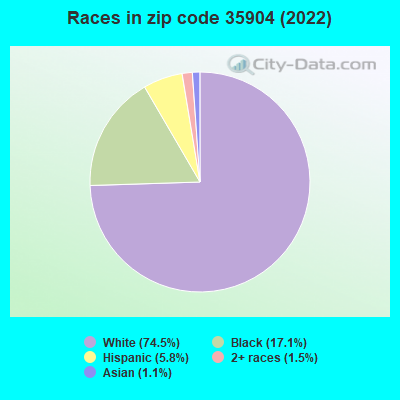
94.4% of residents of 35904 zip code speak English at home.
4.0% of residents speak Spanish at home (75% very well, 17% well, 5% not well, 3% not at all).
0.2% of residents speak other Indo-European language at home (56% very well, 44% well).
1.5% of residents speak Asian or Pacific Island language at home (89% very well, 1% well, 11% not well).
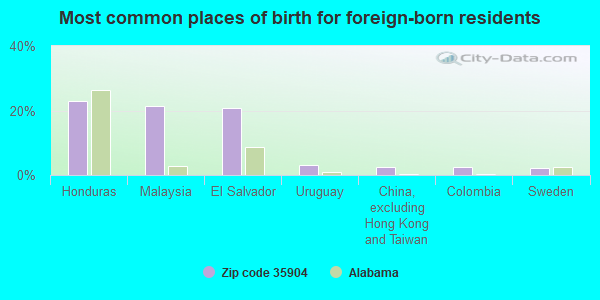
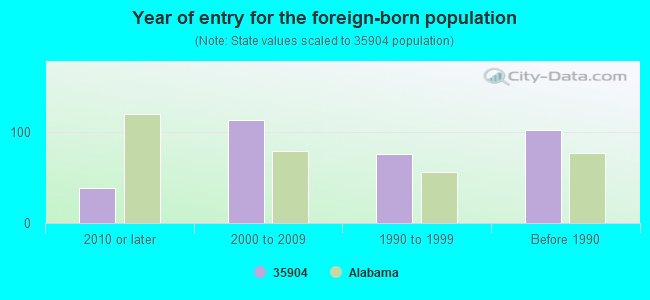
Foreign born population: 358 (2.6%) (37.4% of them are naturalized citizens)
Major facilities with environmental interests located in this zip code:
ADVANCE AUTO PARTS GADSDEN DISTRIBUTION CENTER #12 (4330 BROOKE AVENUE in GADSDEN, AL)
ENFORCEMENT/COMPLIANCE ACTIVITY (Integrated Compliance Information System) - ICIS-HQ-2004-6001, FORMAL ENFORCEMENT ACTION (Integrated Compliance Information System) - ICIS-HQ-2004-6001, FORMAL ENFORCEMENT ACTION Small Quantity Generators, between 100 kg and 1000 kg of hazardous waste/month (Resource Conservation and Recovery Act (tracking hazardous waste)) Organizations: ADVANCE AUTO PART INC (CONTACT/OPERATOR)
Alternative names: ADVANCE AUTO PARTS INC DISTRIB CNTR #12
(Integrated Compliance Information System) - ICIS-04-2001-9059, FORMAL ENFORCEMENT ACTION COMPLIANCE ACTIVITY (Tracking inspections of insecticide, fungicide, and rodenticide, and toxic substances) Conditionally Exempt Small Quantity Generators, less than 100 kg/month of hazardous waste (Resource Conservation and Recovery Act (tracking hazardous waste)) - notification TRI REPORTER (Tracking of toxic chemicals releasing facilities) Business SIC classification: INDUSTRIAL GASES Organizations: OPERNAME (CONTACT/OPERATOR)
Alternative names: PRAXAIR INC LINDE PLANT 704, UNION CARBIDE CORP. LINDE DIV.
C I T Y PROGRAM (125 ROBIN CIR in GADSDEN, AL)
(National Center for Education Statistics) - STATE ID-3000 Organizations: GADSDEN CITY (SCHOOL DISTRICT)
PARSON'S TIRES (4315 OLD PUMP STATION ROAD in GADSDEN, AL)
ALDOT 1ST DIVISION DISTRICT 5 (4509 AIRPORT ROAD in GADSDEN, AL)
(Resource Conservation and Recovery Act (tracking hazardous waste)) Business NAICS classification: AUTOMOTIVE OIL CHANGE AND LUBRICATION SHOPS. Organizations: BEN THACKERSON (CONTACT/OPERATOR)
, STATE OF ALABAMA (CONTACT/OWNER)
ETOWAH CHEMICAL CO. (215 N 24TH STREET in GADSDEN, AL)
ETOWAH CHEMICAL SALES AND SVC (2508 SCHULER AVENUE in GADSDEN, AL)
National Pollutant Discharge Elimination System NON-MAJOR (Tracking pollutant discharge elimination systems) - permit Business SIC classification: CHEMICALS AND ALLIED PRODUCTS
ADVANCE AUTO PARTS #9040 (2639 W MEIGHAN BLVD in GADSDEN, AL)
(Resource Conservation and Recovery Act (tracking hazardous waste))
AUTOZONE #2334 (2801 W MEIGHAN BLVD in GADSDEN, AL)
PSC METALS INC (201 NORTH 22ND STREET in GADSDEN, AL)
National Pollutant Discharge Elimination System NON-MAJOR (Tracking pollutant discharge elimination systems) - permit Business SIC classification: SCRAP AND WASTE MATERIALS Alternative names: GADSDEN IRON AND MEAL INC, GADSDEN IRON AND METAL INC
R H MOTORS INC (3736 S 11TH ST in GADSDEN, AL)
National Pollutant Discharge Elimination System NON-MAJOR (Tracking pollutant discharge elimination systems) - permit Business SIC classification: MOTOR VEHICLE PARTS, USED
EXXON CO USA #50969 (FAI 20 & HIGHWAY 411 in LEEDS, AL)
(Resource Conservation and Recovery Act (tracking hazardous waste)) Organizations: EDDIE W MOORE INC (CONTACT/OWNER)
Housing units lacking complete plumbing facilities: 9.1% Housing units lacking complete kitchen facilities: 8.2%
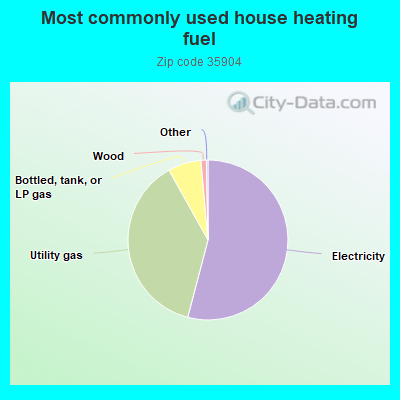
54.1%Electricity
37.8%Utility gas
6.7%Bottled, tank, or LP gas
1.1%Wood
Population in 1990: 7,002. Population change in the 1990s: +8,320 (+118.8%).
Place of birth for U.S.-born residents:
This state: 11,311
Northeast: 303
Midwest: 302
South: 1,072
West: 164
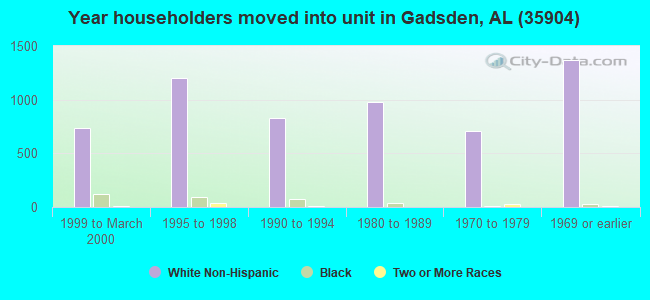
63% of the 35904 zip code residents lived in the same house 5 years ago. Out of people who lived in different houses, 67% lived in this county. Out of people who lived in different counties, 50% lived in Alabama.
91% of the 35904 zip code residents lived in the same house 1 year ago. Out of people who lived in different houses, 68% moved from this county. Out of people who lived in different houses, 14% moved from different county within same state. Out of people who lived in different houses, 13% moved from different state. Out of people who lived in different houses, 2% moved from abroad.
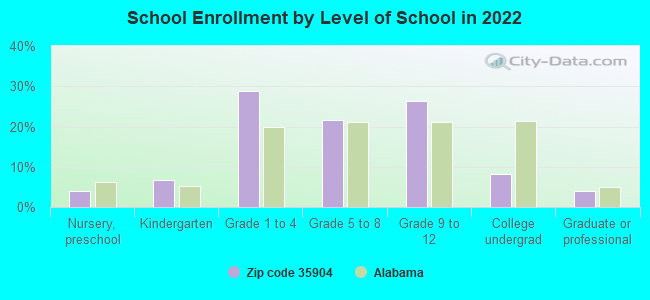
Private vs. public school enrollment:
Students in private schools in grades 1 to 8 (elementary and middle school): 57
Here:
4.5%
Alabama:
14.7%
Students in private schools in grades 9 to 12 (high school): 161
Here:
23.5%
Alabama:
16.3%
Students in private undergraduate colleges:
Here:
0.0%
Alabama:
14.6%
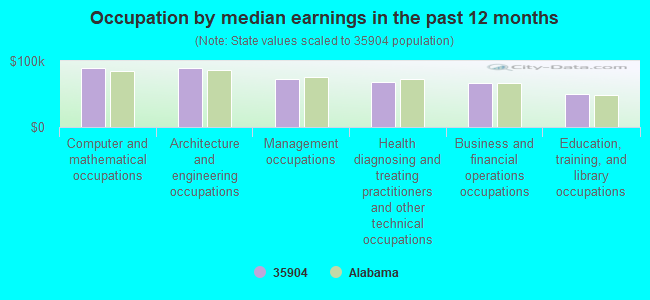
Occupation by median earnings in the past 12 months ($)
89,274Computer and mathematical occupations
89,182Architecture and engineering occupations
72,176Management occupations
68,253Health diagnosing and treating practitioners and other technical occupations
67,386Business and financial operations occupations
49,672Education, training, and library occupations
Companies with federal contracts located in this zip code:
MCCORD COMMUNICATIONS INC (2700 WILLS CREEK RD in GADSDEN, AL; small business) : $732,526 in 14 contractsfrom 2002 to 2006
Contracts for Intercommunication and Public Address Systems, Except Airborne, Miscellaneous Communication Equipment, Maintenance, Repair or Alteration of Real Property -- Electronic and Communications Facilities, Miscellaneous Alarm, Signal and Security Detection Systems, and moreby Army, National Park Service, Air Force, Bureau of Alcohol, Tobacco, Firearms and Explosives, and others Signed by year:2000: $0; 2001: $0; 2002: $14,780; 2003: $159,539; 2004: $361,555; 2005: $189,452; 2006: $7,200.
Biggest contracts:
$326,140 with Army for Intercommunication and Public Address Systems, Except Airborne. Taking place in CT. Signed on 2004-09-18. Completion date: 2005-02-05.
$150,014 with Army for Miscellaneous Communication Equipment. Signed on 2003-02-24. Completion date: 2003-06-01.
$144,314, same as above.Signed on 2003-02-24. Completion date: 2003-06-01.
$74,991 with National Park Service for Maintenance, Repair or Alteration of Real Property -- Electronic and Communications Facilities. Taking place in MS. Signed on 2005-03-18. Completion date: 2005-04-22.
H P W SPECIALTIES INC (2618 FORREST AVE in GADSDEN, AL; small business) : $254,564 in 6 contractsfrom 2004 to 2006
Contracts for Toiletry Paper Products, Miscellaneous Items by Army Signed by year:2000: $0; 2001: $0; 2002: $0; 2003: $0; 2004: $51,768; 2005: $94,454; 2006: $108,342.
Biggest contracts:
$78,276 with Army for Toiletry Paper Products. Signed on 2006-06-15. Effective on 2006-07-05. Completion date: 2007-07-04.
$74,124, same as above.Signed on 2005-05-10. Completion date: 2006-07-04.
$51,768, same as above.Signed on 2004-07-02. Completion date: 2005-07-04.
$30,066, same as above.Signed on 2006-01-25. Completion date: 2006-07-04.
RANIK ENTERPRISES (205 ENTERPRISE DRIVE in GADSDEN, AL; small business)
$4,050 with Army for Lodging - Hotel/Motel. Signed on 2004-10-14. Completion date: 2004-10-14.
Top industries in this zip code by the number of employees in 2005:
Health Care and Social Assistance: Nursing Care Facilities (100-249 employees: 2 establishments)
2003 - 2018 National Fire Incident Reporting System (NFIRS) incidents
Based on the data from the years 2003 - 2018 the average number of fires per year is 18. The highest number of reported fires - 85 took place in 2016, and the least - 0 in 2006. The data has a constant trend.
When looking into fire subcategories, the most reports belonged to: Structure Fires (45.6%), and Outside Fires (40.3%).
Fire incident types reported to NFIRS in Zip Code 35904

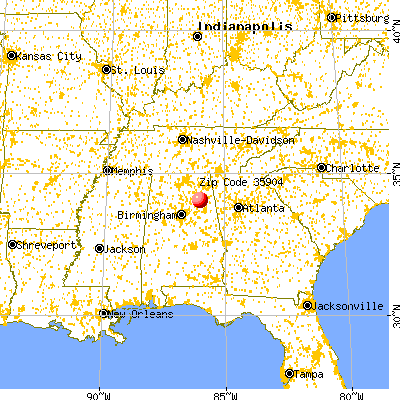


 Nearest zip codes: 35901, 35954, 35905, 35903, 35956, 35906.
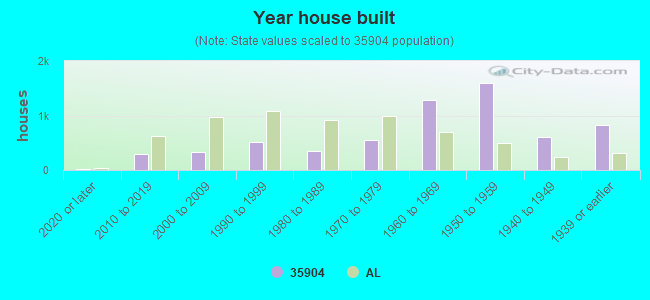


 Based on the data from the years 2003 - 2018 the average number of fires per year is 18. The highest number of reported fires - 85 took place in 2016, and the least - 0 in 2006. The data has a constant trend.
 When looking into fire subcategories, the most reports belonged to: Structure Fires (45.6%), and Outside Fires (40.3%).