Estimated zip code population in 2022: 38,796 Zip code population in 2010: 35,230 Zip code population in 2000: 29,547
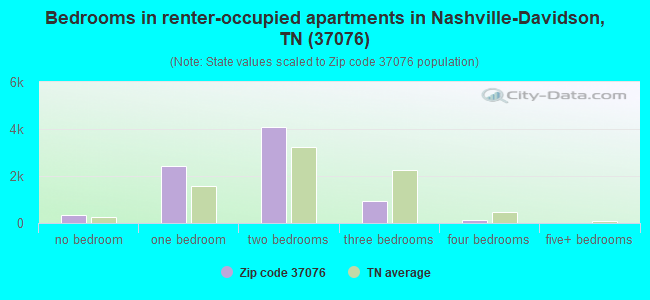
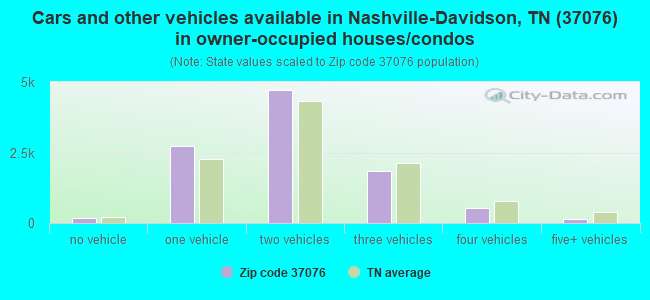
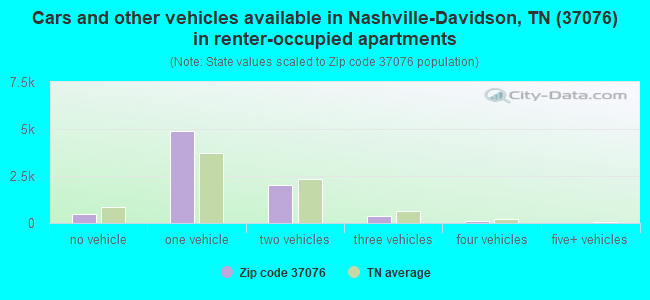
Houses and condos: 19,053 Renter-occupied apartments: 7,837
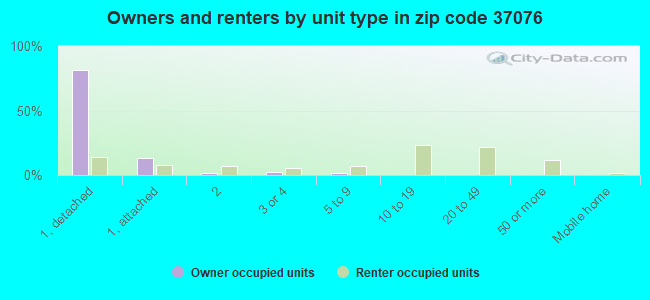
% of renters here:
44%
State:
33%
March 2022 cost of living index in zip code 37076: 90.5 (less than average, U.S. average is 100)
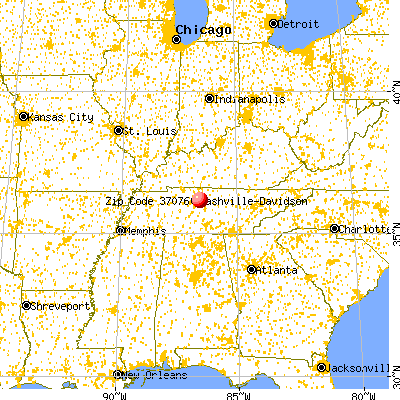
Land area: 27.3 sq. mi. Water area: 6.4 sq. mi.
Population density: 1,420 people per square mile
(low).
OSM Map
General Map
Google Map
MSN Map
OSM Map
General Map
Google Map
MSN Map
OSM Map
General Map
Google Map
MSN Map
OSM Map
General Map
Google Map
MSN Map
Please wait while loading the map...
Real estate property taxes paid for housing units in 2022:
This zip code:
0.5% ($1,844)
Tennessee:
0.5% ($1,376)
Median real estate property taxes paid for housing units with mortgages in 2022: $1,815 (0.5%) Median real estate property taxes paid for housing units with no mortgage in 2022: $1,914 (0.5%)
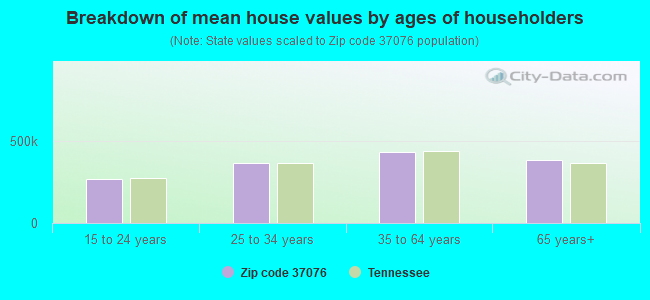
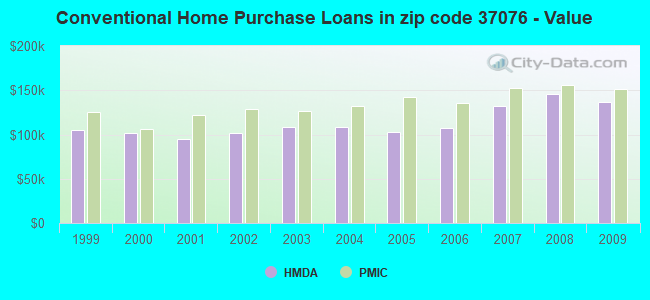
Estimated median house/condo value in 2022: $371,430
37076:
$371,430
Tennessee:
$284,800
According to our research of Tennessee and other state lists, there were 42 registered sex offenders living in 37076 zip code as of May 09, 2024. The ratio of all residents to sex offenders in zip code 37076 is 913 to 1. The ratio of registered sex offenders to all residents in this zip code is much lower than the state average.
Median resident age:
This zip code:
37.8 years
Tennessee median age:
39.2 years
Average household size:
This zip code:
2.1 people
Tennessee:
2.4 people
Averages for the 2020 tax year for zip code 37076, filed in 2021:
Average Adjusted Gross Income (AGI) in 2020: $58,554 (Individual Income Tax Returns)
Here:
$58,554
State:
$69,014
Salary/wage: $52,169 (reported on 84.5% of returns)
Here:
$52,169
State:
$55,872
(% of AGI for various income ranges: 1171.5% for AGIs below $25k, 3757.3% for AGIs $25k-50k, 6683.0% for AGIs $50k-75k, 9932.9% for AGIs $75k-100k, 18068.7% for AGIs $100k-200k, 55168.3% for AGIs over 200k)
Taxable interest for individuals: $1,056 (reported on 22.2% of returns)
This zip code:
$1,056
Tennessee:
$1,945
(% of AGI for various income ranges: 10.0% for AGIs below $25k, 10.5% for AGIs $25k-50k, 24.7% for AGIs $50k-75k, 45.3% for AGIs $75k-100k, 91.2% for AGIs $100k-200k, 695.0% for AGIs over 200k)
Ordinary dividends: $3,018 (reported on 14.4% of returns)
Here:
$3,018
State:
$8,105
(% of AGI for various income ranges: 14.1% for AGIs below $25k, 17.1% for AGIs $25k-50k, 43.0% for AGIs $50k-75k, 96.7% for AGIs $75k-100k, 184.3% for AGIs $100k-200k, 1301.1% for AGIs over 200k)
Net capital gain/loss in AGI: +$13,566 (reported on 13.0% of returns)
Here:
+$13,566
State:
+$33,664
(% of AGI for various income ranges: 6.1% for AGIs below $25k, 15.2% for AGIs $25k-50k, 61.1% for AGIs $50k-75k, 117.1% for AGIs $75k-100k, 501.3% for AGIs $100k-200k, 13937.8% for AGIs over 200k)
Profit/loss from business: +$12,982 (reported on 18.9% of returns)
Here:
+$12,982
State:
+$18,991
(% of AGI for various income ranges: 148.0% for AGIs below $25k, 199.2% for AGIs $25k-50k, 269.2% for AGIs $50k-75k, 411.7% for AGIs $75k-100k, 777.4% for AGIs $100k-200k, 5615.0% for AGIs over 200k)
Taxable individual retirement arrangement distribution: $16,600 (reported on 6.9% of returns)
37076:
$16,600
Tennessee:
$20,036
(% of AGI for various income ranges: 46.8% for AGIs below $25k, 63.2% for AGIs $25k-50k, 135.0% for AGIs $50k-75k, 282.4% for AGIs $75k-100k, 515.6% for AGIs $100k-200k, 1895.6% for AGIs over 200k)
Self-employed (Keogh) retirement plans: $20,471 (reported on 0.3% of returns)
37076:
$20,471
Tennessee:
$28,955
(% of AGI for various income ranges: 26.2% for AGIs $100k-200k, 565.0% for AGIs over 200k)
Total itemized deductions: $27,859 (reported on 5.5% of returns)
Here:
$27,859
State:
$40,136
(% of AGI for various income ranges: 34.3% for AGIs below $25k, 86.0% for AGIs $25k-50k, 226.6% for AGIs $50k-75k, 348.8% for AGIs $75k-100k, 656.2% for AGIs $100k-200k, 3183.9% for AGIs over 200k)
Charity contributions: $10,398 (reported on 4.3% of returns)
Here:
$10,398
State:
$19,852
(% of AGI for various income ranges: 2.3% for AGIs below $25k, 11.1% for AGIs $25k-50k, 42.7% for AGIs $50k-75k, 91.1% for AGIs $75k-100k, 224.7% for AGIs $100k-200k, 1591.1% for AGIs over 200k)
Taxes paid: $4,715 (reported on 5.2% of returns)
37076:
$4,715
State:
$6,038
(% of AGI for various income ranges: 3.4% for AGIs below $25k, 10.5% for AGIs $25k-50k, 32.3% for AGIs $50k-75k, 60.0% for AGIs $75k-100k, 120.6% for AGIs $100k-200k, 549.4% for AGIs over 200k)
Earned income credit: $2,139 (reported on 15.4% of returns)
Here:
$2,139
State:
$2,391
(% of AGI for various income ranges: 92.5% for AGIs below $25k, 49.9% for AGIs $25k-50k, 0.8% for AGIs $50k-75k)
Percentage of individuals using paid preparers for their 2020 taxes: 92.7%
Here:
93%
State:
93%
(% for various income ranges: 90.9% for AGIs below $25k, 93.1% for AGIs $25k-50k, 93.6% for AGIs $50k-75k, 92.2% for AGIs $75k-100k, 94.5% for AGIs $100k-200k, 94.3% for AGIs over 200k)
Averages for the 2012 tax year for zip code 37076, filed in 2013:
Average Adjusted Gross Income (AGI) in 2012: $47,119 (Individual Income Tax Returns)
Here:
$47,119
State:
$53,767
Salary/wage: $43,074 (reported on 87.4% of returns)
Here:
$43,074
State:
$45,421
(% of AGI for various income ranges: 79.4% for AGIs below $25k, 85.6% for AGIs $25k-50k, 82.4% for AGIs $50k-75k, 80.7% for AGIs $75k-100k, 81.3% for AGIs $100k-200k, 57.0% for AGIs over 200k)
Taxable interest for individuals: $1,017 (reported on 24.4% of returns)
This zip code:
$1,017
Tennessee:
$1,732
(% of AGI for various income ranges: 0.6% for AGIs below $25k, 0.3% for AGIs $25k-50k, 0.4% for AGIs $50k-75k, 0.5% for AGIs $75k-100k, 0.5% for AGIs $100k-200k, 1.1% for AGIs over 200k)
Ordinary dividends: $2,389 (reported on 12.5% of returns)
Here:
$2,389
State:
$6,739
(% of AGI for various income ranges: 0.9% for AGIs below $25k, 0.5% for AGIs $25k-50k, 0.5% for AGIs $50k-75k, 0.7% for AGIs $75k-100k, 0.7% for AGIs $100k-200k, 0.9% for AGIs over 200k)
Net capital gain/loss in AGI: +$6,228 (reported on 9.5% of returns)
Here:
+$6,228
State:
+$19,082
(% of AGI for various income ranges: 0.2% for AGIs $25k-50k, 0.2% for AGIs $50k-75k, 0.5% for AGIs $75k-100k, 1.1% for AGIs $100k-200k, 9.1% for AGIs over 200k)
Profit/loss from business: +$11,956 (reported on 15.4% of returns)
Here:
+$11,956
State:
+$15,240
(% of AGI for various income ranges: 8.0% for AGIs below $25k, 3.1% for AGIs $25k-50k, 2.8% for AGIs $50k-75k, 2.7% for AGIs $75k-100k, 3.9% for AGIs $100k-200k, 5.5% for AGIs over 200k)
Taxable individual retirement arrangement distribution: $12,829 (reported on 7.8% of returns)
37076:
$12,829
Tennessee:
$15,505
(% of AGI for various income ranges: 2.1% for AGIs below $25k, 1.7% for AGIs $25k-50k, 2.1% for AGIs $50k-75k, 2.5% for AGIs $75k-100k, 2.4% for AGIs $100k-200k, 1.9% for AGIs over 200k)
Self-employment retirement plans: $16,160 (reported on 0.3% of returns)
37076:
$16,160
Tennessee:
$22,567
Total itemized deductions: $17,156 (21% of AGI, reported on 25.6% of returns)
Here:
$17,156
State:
$21,976
Here:
20.9% of AGI
State:
17.8% of AGI
(% of AGI for various income ranges: 7.4% for AGIs below $25k, 7.8% for AGIs $25k-50k, 10.4% for AGIs $50k-75k, 10.4% for AGIs $75k-100k, 10.6% for AGIs $100k-200k, 7.7% for AGIs over 200k)
Charity contributions: $4,321 (reported on 20.0% of returns)
Here:
$4,321
State:
$6,709
(% of AGI for various income ranges: 0.7% for AGIs below $25k, 1.0% for AGIs $25k-50k, 1.7% for AGIs $50k-75k, 2.3% for AGIs $75k-100k, 2.6% for AGIs $100k-200k, 2.5% for AGIs over 200k)
Taxes paid: $3,659 (reported on 25.0% of returns)
37076:
$3,659
State:
$4,829
(% of AGI for various income ranges: 1.2% for AGIs below $25k, 1.5% for AGIs $25k-50k, 2.1% for AGIs $50k-75k, 2.2% for AGIs $75k-100k, 2.5% for AGIs $100k-200k, 1.6% for AGIs over 200k)
Earned income credit: $2,196 (reported on 18.0% of returns)
Here:
$2,196
State:
$2,404
(% of AGI for various income ranges: 6.2% for AGIs below $25k, 0.8% for AGIs $25k-50k)
Percentage of individuals using paid preparers for their 2012 taxes: 42.3%
Here:
42%
State:
52%
(% for various income ranges: 41.1% for AGIs below $25k, 38.7% for AGIs $25k-50k, 44.2% for AGIs $50k-75k, 44.6% for AGIs $75k-100k, 51.6% for AGIs $100k-200k, 59.1% for AGIs over 200k)
Averages for the 2004 tax year for zip code 37076, filed in 2005:
Average Adjusted Gross Income (AGI) in 2004: $42,581 (Individual Income Tax Returns)
Here:
$42,581
State:
$44,088
Salary/wage: $40,058 (reported on 88.5% of returns)
Here:
$40,058
State:
$38,825
(% of AGI for various income ranges: 118.7% for AGIs below $10k, 82.0% for AGIs $10k-25k, 86.8% for AGIs $25k-50k, 84.6% for AGIs $50k-75k, 85.4% for AGIs $75k-100k, 75.4% for AGIs over 100k)
Taxable interest for individuals: $1,227 (reported on 33.6% of returns)
This zip code:
$1,227
Tennessee:
$1,802
(% of AGI for various income ranges: 3.6% for AGIs below $10k, 1.5% for AGIs $10k-25k, 0.9% for AGIs $25k-50k, 0.9% for AGIs $50k-75k, 0.7% for AGIs $75k-100k, 0.9% for AGIs over 100k)
Taxable dividends: $1,752 (reported on 16.3% of returns)
Here:
$1,752
State:
$3,727
(% of AGI for various income ranges: 1.6% for AGIs below $10k, 1.0% for AGIs $10k-25k, 0.5% for AGIs $25k-50k, 0.5% for AGIs $50k-75k, 0.5% for AGIs $75k-100k, 0.9% for AGIs over 100k)
Net capital gain/loss: +$5,571 (reported on 13.6% of returns)
Here:
+$5,571
State:
+$15,776
(% of AGI for various income ranges: -1.1% for AGIs below $10k, 0.1% for AGIs $10k-25k, 0.4% for AGIs $25k-50k, 0.7% for AGIs $50k-75k, 1.3% for AGIs $75k-100k, 5.3% for AGIs over 100k)
Profit/loss from business: +$10,829 (reported on 15.5% of returns)
Here:
+$10,829
State:
+$12,882
(% of AGI for various income ranges: 2.8% for AGIs below $10k, 5.0% for AGIs $10k-25k, 3.2% for AGIs $25k-50k, 3.3% for AGIs $50k-75k, 3.3% for AGIs $75k-100k, 5.4% for AGIs over 100k)
IRA payment deduction: $2,567 (reported on 1.9% of returns)
37076:
$2,567
Tennessee:
$2,934
(% of AGI for various income ranges: 0.1% for AGIs $10k-25k, 0.1% for AGIs $25k-50k, 0.1% for AGIs $50k-75k, 0.1% for AGIs $75k-100k, 0.1% for AGIs over 100k)
Self-employed pension: $12,556 (reported on 0.5% of returns)
Here:
$12,556
Tennessee:
$16,857
(% of AGI for various income ranges: 0.0% for AGIs $25k-50k, 0.1% for AGIs $50k-75k, 0.1% for AGIs $75k-100k, 0.4% for AGIs over 100k)
Total itemized deductions: $14,967 (21% of AGI, reported on 32.1% of returns)
Here:
$14,967
State:
$18,035
Here:
21.4% of AGI
State:
19.9% of AGI
(% of AGI for various income ranges: 9.7% for AGIs below $10k, 7.7% for AGIs $10k-25k, 10.9% for AGIs $25k-50k, 12.5% for AGIs $50k-75k, 13.4% for AGIs $75k-100k, 10.7% for AGIs over 100k)
Charity contributions deductions: $3,535 (5% of AGI, reported on 27.1% of returns)
Here:
$3,535
State:
$5,167
Here:
4.8% of AGI
State:
5.3% of AGI
(% of AGI for various income ranges: 0.9% for AGIs below $10k, 1.1% for AGIs $10k-25k, 1.6% for AGIs $25k-50k, 2.2% for AGIs $50k-75k, 2.8% for AGIs $75k-100k, 3.1% for AGIs over 100k)
Total tax: $5,966 (reported on 79.4% of returns)
37076:
$5,966
State:
$7,482
(% of AGI for various income ranges: 3.4% for AGIs below $10k, 4.4% for AGIs $10k-25k, 7.8% for AGIs $25k-50k, 10.1% for AGIs $50k-75k, 11.5% for AGIs $75k-100k, 18.2% for AGIs over 100k)
Earned income credit: $1,624 (reported on 13.3% of returns)
Here:
$1,624
State:
$1,826
Percentage of individuals using paid preparers for their 2004 taxes: 49.9%
Here:
50%
State:
60%
(% for various income ranges: 46.3% for AGIs below $10k, 53.6% for AGIs $10k-25k, 48.5% for AGIs $25k-50k, 48.9% for AGIs $50k-75k, 48.2% for AGIs $75k-100k, 55.9% for AGIs over 100k)
Likely homosexual households (counted as self-reported same-sex unmarried-partner households)
Lesbian couples: 0.3% of all households
Gay men: 0.4% of all households
Household received Food Stamps/SNAP in the past 12 months: 1,378 Household did not receive Food Stamps/SNAP in the past 12 months: 16,631
Women who had a birth in the past 12 months: 429 (291 now married, 137 unmarried) Women who did not have a birth in the past 12 months: 9,448 (3,580 now married, 5,866 unmarried)
Housing units in zip code 37076 with a mortgage: 6,769 (720 second mortgage, 4 home equity loan, 688 both second mortgage and home equity loan) Houses without a mortgage: 60
Median monthly owner costs for units with a mortgage: $1,564 Median monthly owner costs for units without a mortgage: $538
Residents with income below the poverty level in 2022:
This zip code:
11.3%
Whole state:
13.3%
Residents with income below 50% of the poverty level in 2022:
This zip code:
4.6%
Whole state:
7.1%
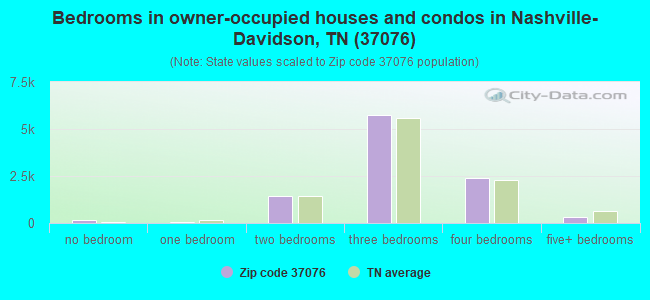
Median number of rooms in houses and condos:
Here:
6.4
State:
6.5
Median number of rooms in apartments:
Here:
3.9
State:
4.4
Notable locations in this zip code not listed on our city pages
Notable locations in zip code 37076: Seven Points (A), Ravenwood Country Club (B), Summit Medical Park (C), Nashville Fire Department Station 32 (D). Display/hide their locations on the map
Shopping Centers: Northlake Village Shopping Center (1), Oakwood Commons Shopping Center (2), Hills Shopping Center (3), Hermitage Plaza Shopping Center (4), Hermitage Hills Shopping Center (5). Display/hide their locations on the map
Churches in zip code 37076 include: New Hope Baptist Church (A), Lebanon Road Church (B), Evans Hill Church (C), Philippi Church (D), Central Pike Church (E), Bryant Grove Church (F), Dodson Chapel United Methodist Church (G), Hermitage Church (H), The Hermitage Church (I). Display/hide their locations on the map
Cemeteries: Wright Cemetery (1), Tilgham Cemetery (2), Steele Cemetery (3), Pugh Cemetery (4), Morrow Cemetery (5), Jenkins Cemetery (6), Hamilton Cemetery (7). Display/hide their locations on the map
Streams, rivers, and creeks: Dry Fork (A), Bryant Creek (B), Scotts Creek (C), North Creek (D), Vivrett Creek (E), Stones River (F), Stoners Creek (G). Display/hide their locations on the map
Parks in zip code 37076 include: J Percy Priest Wildlife Management Area (1), Cook Public Use Area (2), Suggs Creek Public Use Area (3), Seven Points Public Use Area (4), Long Hunter State Park (5), Hermitage Lands State Wildlife Management Area (6). Display/hide their locations on the map
Tourist attractions (not listed on the city page) : Rachel's Garden Cafe at the Here of Prsdnt Andrw J (Historical Places & Services; 4580 Rachels Lane) (1), Tulip Grove Mansion (Cultural Attractions- Events- & Facilities; 4580 Rachels Lane) (2), Hermitage Lanes (Amusement & Theme Parks; 3436 Lebanon Pike) (3). Display/hide their approximate locations on the map
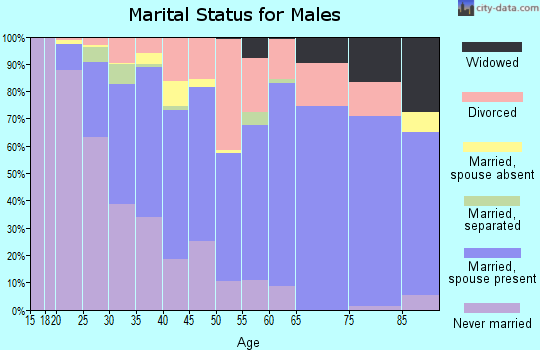
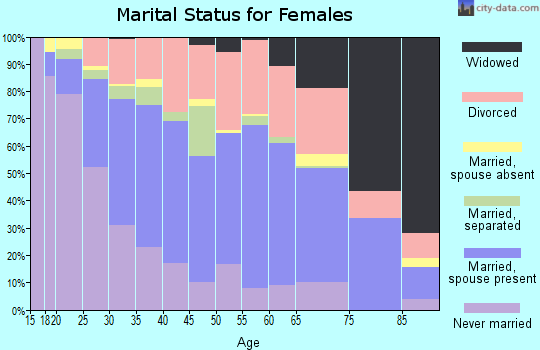
4,380 married couples with children.
2,715 single-parent households (423 men, 2,292 women).
89.2% of residents of 37076 zip code speak English at home.
5.7% of residents speak Spanish at home (54% very well, 16% well, 22% not well, 8% not at all).
2.0% of residents speak other Indo-European language at home (74% very well, 18% well, 9% not well).
0.8% of residents speak Asian or Pacific Island language at home (65% very well, 32% well, 3% not well).
2.3% of residents speak other language at home (68% very well, 14% well, 19% not well).
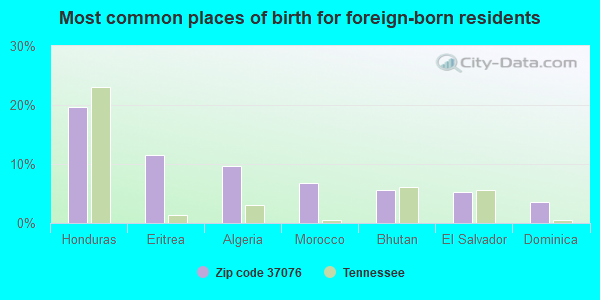
Foreign born population: 2,694 (6.9%) (44.5% of them are naturalized citizens)
This zip code:
6.9%
Whole state:
5.6%
20%Honduras
11%Eritrea
10%Algeria
7%Morocco
6%Bhutan
5%El Salvador
4%Dominica
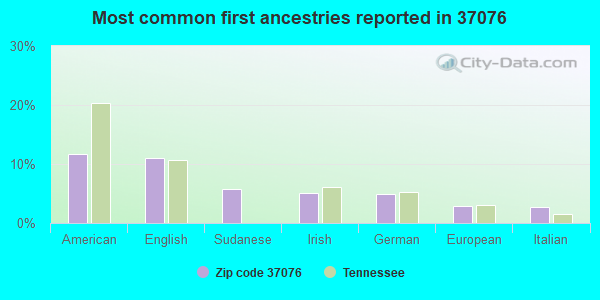
12%American
11%English
6%Sudanese
5%Irish
5%German
3%European
3%Italian
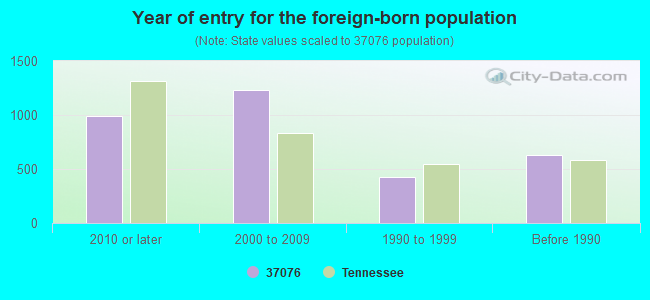
Year of entry for the foreign-born population
9952010 or later
1,2312000 to 2009
4221990 to 1999
633Before 1990
Facilities with environmental interests located in this zip code:
DODSON ELEMENTARY SCHOOL (4401 CHANDLER RD in HERMITAGE, TN)
(Geographic Names Information System) (National Center for Education Statistics) - STATE ID-0165 Organizations: NASHVILLE-DAVIDSON COUNTY SD (SCHOOL DISTRICT)
COLUMBIA SUMMITT MEDICAL CENTER (5655 FRIST BLVD. in HERMITAGE, TN)
AIR MINOR (AIRS/AFS) CRITERIA AND HAZARDOUS AIR POLLUTANT INVENTORY (Inventory of air pollution sources) Business SIC classification: GENERAL MEDICAL AND SURGICAL HOSPITALS Alternative names: SUMMIT MEDICAL CENTER
AMOCO OIL SS# 348 (3840 LEBANON RD in HERMITAGE, TN)
(Resource Conservation and Recovery Act (tracking hazardous waste)) Business NAICS classification: OTHER FUEL DEALERS.
C CON CORPORATION (INDUSTRIAL DRIVE in HERMITAGE, TN)
(Resource Conservation and Recovery Act (tracking hazardous waste)) Business NAICS classification: CONVEYOR AND CONVEYING EQUIPMENT MANUFACTURING.
DIGITAL CONTROL SYSTEMS (3922 PLANTATION DR in HERMITAGE, TN)
(Resource Conservation and Recovery Act (tracking hazardous waste))
CLASSIQUE CLEANERS (3438C LEBANON RD in HERMITAGE, TN)
Conditionally Exempt Small Quantity Generators, less than 100 kg/month of hazardous waste (Resource Conservation and Recovery Act (tracking hazardous waste)) - notification Organizations: ROBERT J BALTZ JR (CONTACT/OWNER)
CERTIFIED FINISHES INC. (3537 HERMITAGE INDUSTRIAL DR in HERMITAGE, TN)
CRITERIA AND HAZARDOUS AIR POLLUTANT INVENTORY (Inventory of air pollution sources) Business SIC classification: ELECTROPLATING, PLATING, POLISHING, ANODIZING, AND COLORING
CLASSIC CAR CARE INC (332 JACKSONIAN in HERMITAGE, TN)
Conditionally Exempt Small Quantity Generators, less than 100 kg/month of hazardous waste (Resource Conservation and Recovery Act (tracking hazardous waste)) - notification Business NAICS classification: ALL OTHER AUTOMOTIVE REPAIR AND MAINTENANCE.
CONCORD CUSTOM CLEANERS #093 (5502 OLD HICKORY BLVD in HERMITAGE, TN)
Small Quantity Generators, between 100 kg and 1000 kg of hazardous waste/month (Resource Conservation and Recovery Act (tracking hazardous waste)) - notification
Housing units lacking complete kitchen facilities: 1.0%
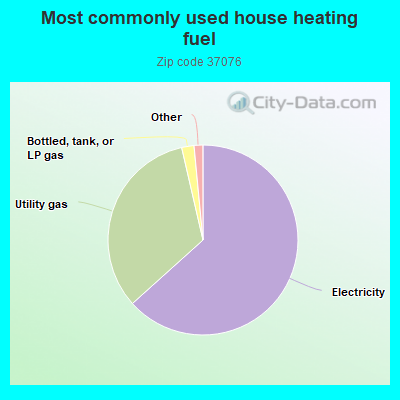
63.4%Electricity
33.1%Utility gas
2.1%Bottled, tank, or LP gas
Population in 1990: 23,765. Population change in the 1990s: +5,782 (+24.3%).
Place of birth for U.S.-born residents:
This state: 18,754
Northeast: 2,431
Midwest: 5,542
South: 6,675
West: 2,228
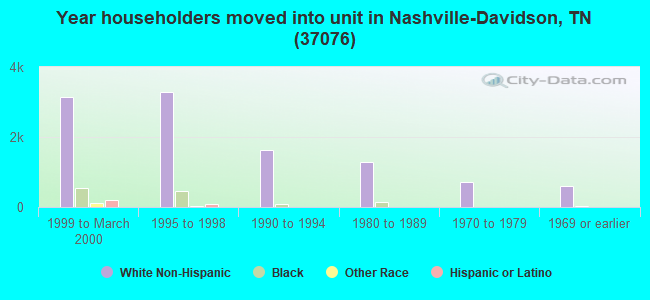
42% of the 37076 zip code residents lived in the same house 5 years ago. Out of people who lived in different houses, 50% lived in this county. Out of people who lived in different counties, 50% lived in Tennessee.
85% of the 37076 zip code residents lived in the same house 1 year ago. Out of people who lived in different houses, 42% moved from this county. Out of people who lived in different houses, 30% moved from different county within same state. Out of people who lived in different houses, 27% moved from different state. Out of people who lived in different houses, 0% moved from abroad.
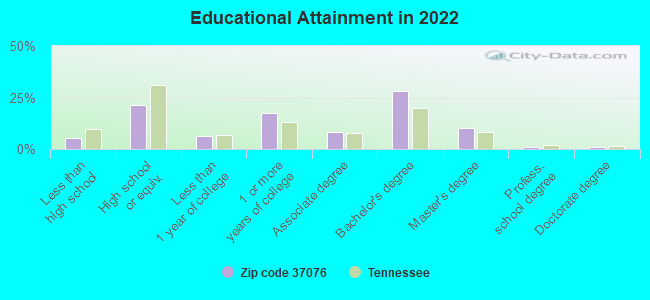
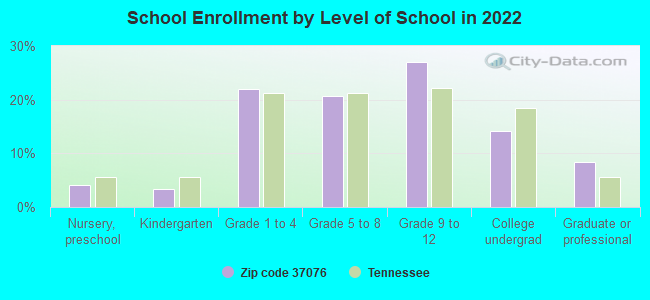
Private vs. public school enrollment:
Students in private schools in grades 1 to 8 (elementary and middle school): 774
Here:
24.3%
Tennessee:
15.0%
Students in private schools in grades 9 to 12 (high school): 467
Here:
23.1%
Tennessee:
16.2%
Students in private undergraduate colleges: 149
Here:
14.0%
Tennessee:
23.5%
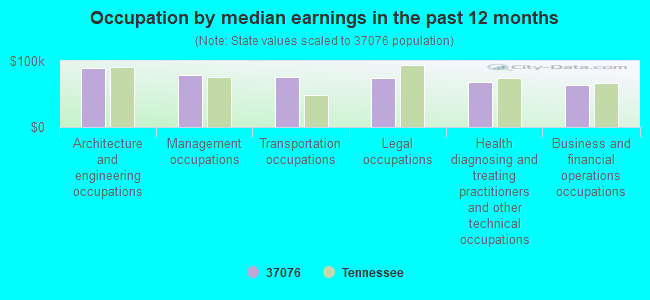
Occupation by median earnings in the past 12 months ($)
89,095Architecture and engineering occupations
79,538Management occupations
75,283Transportation occupations
74,471Legal occupations
68,288Health diagnosing and treating practitioners and other technical occupations
63,167Business and financial operations occupations
Companies with federal contracts located in this zip code (HERMITAGE, TN):
SHANKLE-LIND, LLC (3333 STONERS BEND DRIVE; small business) : $4,196,956 in 5 contractsfrom 2002 to 2004
Contracts for Construction of Structures and Facilities -- Other Administrative Facilities and Service Buildings by Army Signed by year:2000: $0; 2001: $0; 2002: $3,607,888; 2003: $396,081; 2004: $192,987; 2005: $0; 2006: $0.
Biggest contracts:
$3,607,888 with Army for Construction of Structures and Facilities -- Other Administrative Facilities and Service Buildings. Signed on 2002-09-30. Completion date: 2003-09-26.
$204,582, same as above.Signed on 2003-09-05. Completion date: 2003-09-26.
$192,987, same as above.Signed on 2004-08-11. Completion date: 2003-09-26.
$108,999, same as above.Signed on 2003-09-30. Completion date: 2003-09-26.
SHERRICK/J&S CONSTRUCTION (3642 CENTRAL PIKE; small business) : $2,043,788 in 10 contractsfrom 2003 to 2005
Contracts for Construction of Structures and Facilities -- Dining Facilities by Army Signed by year:2000: $0; 2001: $0; 2002: $0; 2003: $1,986,002; 2004: $45,214; 2005: $12,572; 2006: $0.
Biggest contracts:
$1,986,002 with Army for Construction of Structures and Facilities -- Dining Facilities. Taking place in AL. Signed on 2003-08-12. Completion date: 2004-05-07.
$11,616, same as above.Signed on 2004-10-08. Completion date: 2005-04-08.
$10,831, same as above.Signed on 2004-10-08. Completion date: 2005-04-08.
$9,153, same as above.Signed on 2004-10-13. Completion date: 2004-12-21.
PRO-THERM INDUSTRIES, INC (3522 CENTRAL PIKE; small business) : $26,927 in 3 contractsfrom 2001 to 2003
$9,100 with Army for Miscellaneous Electrical and Electronic Components. Signed on 2003-12-08. Completion date: 2004-12-07.
$9,100 with U.S. Army Corps of Engineers - civil program financing only for Miscellaneous Electrical and Electronic Components. Signed on 2003-12-08. Completion date: 2004-12-07.
$8,727 with Army for Wire and Cable, Electrical. Signed on 2001-12-12. Completion date: 2002-01-05.
DALTON'S CARPET OUTLET, LLC (3501 HERMITAGE INDUSTRIAL; small business) : $5,605 in 2 contractsfrom 2004 to 2005
$5,987 with Army for Floor Coverings. Signed on 2004-11-03. Completion date: 2004-11-08.
-$382, same as above.Signed on 2005-01-10. Completion date: 2004-11-08.
SHERRICK/WOOLPERT, INC (JOINT (3642 CENTRAL PIKE; small business)
$200 with Army for Maintenance, Repair or Alteration of Real Property -- Miscellaneous Buildings. Taking place in OH. Signed on 2005-09-27. Completion date: 2007-09-22.
Top industries in this zip code by the number of employees in 2005:
Health Care and Social Assistance: General Medical and Surgical Hospitals (over 1000 employees: 1 establishment)
Health Care and Social Assistance: Offices of Physicians (except Mental Health Specialists) (100-249: 1, 50-99: 1, 20-49: 7, 10-19: 12, 5-9: 18, 1-4: 17)
Management of Companies and Enterprises: Corporate, Subsidiary, and Regional Managing Offices (500-999: 1, 20-49: 1, 1-4: 1)
Finance and Insurance: Investment Advice (500-999: 1, 1-4: 1)
2003 - 2018 National Fire Incident Reporting System (NFIRS) incidents
Based on the data from the years 2003 - 2018 the average number of fires per year is 64. The highest number of reported fire incidents - 104 took place in 2007, and the least - 24 in 2004. The data has an increasing trend.
When looking into fire subcategories, the most incidents belonged to: Outside Fires (43.2%), and Structure Fires (31.5%).
Fire incident types reported to NFIRS in Zip Code 37076


 Nearest zip codes: 37217, 37214, 37122, 37138, 37013, 37086.


 Based on the data from the years 2003 - 2018 the average number of fires per year is 64. The highest number of reported fire incidents - 104 took place in 2007, and the least - 24 in 2004. The data has an increasing trend.
 When looking into fire subcategories, the most incidents belonged to: Outside Fires (43.2%), and Structure Fires (31.5%).