Mount Juliet, Tennessee
Submit your own pictures of this city and show them to the world
- OSM Map
- General Map
- Google Map
- MSN Map
Population change since 2000: +244.1%
| Males: 21,227 | |
| Females: 21,321 |
| Median resident age: | 39.1 years |
| Tennessee median age: | 39.2 years |
Zip codes: 37076.
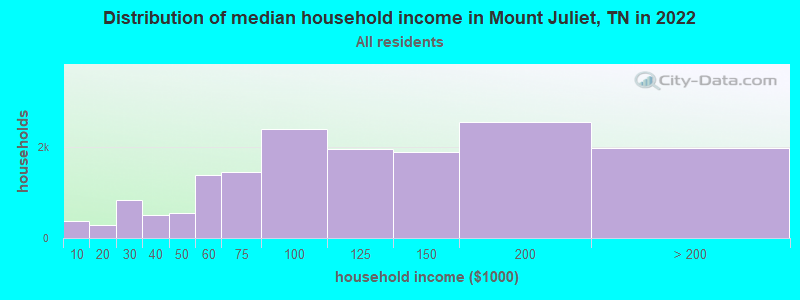
| Mount Juliet: | $105,096 |
| TN: | $65,254 |
Estimated per capita income in 2022: $48,706 (it was $22,567 in 2000)
Mount Juliet city income, earnings, and wages data
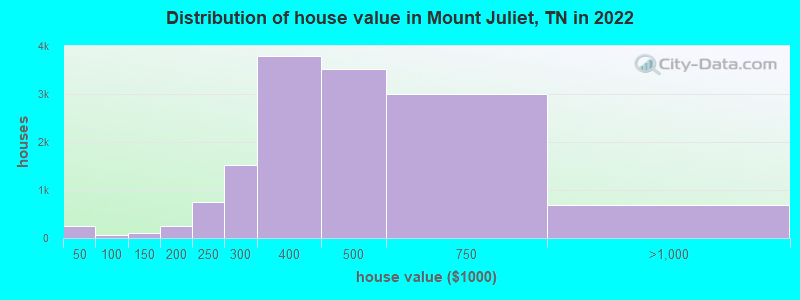
Estimated median house or condo value in 2022: $464,184 (it was $134,900 in 2000)
| Mount Juliet: | $464,184 |
| TN: | $284,800 |
Mean prices in 2022: all housing units: $425,948; detached houses: $436,418; townhouses or other attached units: $311,964; in 3-to-4-unit structures: $222,338; in 5-or-more-unit structures: $324,442; mobile homes: $39,877
Median gross rent in 2022: $1,894.
(4.5% for White Non-Hispanic residents, 10.2% for Black residents, 5.2% for Hispanic or Latino residents, 4.0% for other race residents, 4.0% for two or more races residents)
Detailed information about poverty and poor residents in Mount Juliet, TN


Compare current foreclosures in Mount Juliet, TN:
| Photo | Address | Area | Beds / Baths | Price | Details |
|---|---|---|---|---|---|

|
#1
Belinda Pkwy
Mount Juliet, TN 37122
|
1,830 sq. feet
|
2 baths - beds |
show details | |

|
#2
Pisano Street
Mount Juliet, TN 37122
|
3,794 sq. feet
|
2 baths - beds |
show details | |

|
#3
Brookvalley Pl
Mount Juliet, TN 37122
|
4,252 sq. feet
|
3 baths - beds |
show details | |

|
#4
Old Lebanon Dirt Rd
Mount Juliet, TN 37122
|
1,536 sq. feet
|
2 baths - beds |
show details | |

|
#5
Burgess Rd
Mount Juliet, TN 37122
|
2,112 sq. feet
|
2 baths - beds |
show details | |

|
#6
Hillwood Dr
Mount Juliet, TN 37122
|
1,534 sq. feet
|
2 baths - beds |
show details | |

|
#7
Mires Rd
Mount Juliet, TN 37122
|
1,824 sq. feet
|
2 baths - beds |
show details | |

|
#8
Central Pike
Mount Juliet, TN 37122
|
3,280 sq. feet
|
2 baths - beds |
show details | |

|
#9
Creekfront Dr
Mount Juliet, TN 37122
|
1,805 sq. feet
|
2 baths - beds |
show details | |

|
#10
Andrew Ct
Mount Juliet, TN 37122
|
1,036 sq. feet
|
1 baths - beds |
show details |
| Photo | Address | Area | Beds / Baths | Price | Details |
|---|---|---|---|---|---|

|
#11
Hunters Pl
Mount Juliet, TN 37122
|
1,512 sq. feet
|
2 baths - beds |
show details | |

|
#12
Alex Way
Mount Juliet, TN 37122
|
2,455 sq. feet
|
3 baths - beds |
show details | |

|
#13
Meadow Gln
Mount Juliet, TN 37122
|
3,191 sq. feet
|
3 baths - beds |
show details | |

|
#14
Logue Rd
Mount Juliet, TN 37122
|
1,300 sq. feet
|
1 baths - beds |
show details | |

|
#15
Sunset Dr
Mount Juliet, TN 37122
|
1,053 sq. feet
|
1 baths - beds |
show details | |

|
#16
Saundersville Rd
Mount Juliet, TN 37122
|
1,096 sq. feet
|
1 baths - beds |
show details | |

|
#17
Hilltop Dr
Mount Juliet, TN 37122
|
2,078 sq. feet
|
2 baths - beds |
show details | |

|
#18
Rockytop Trl
Mount Juliet, TN 37122
|
2,999 sq. feet
|
2 baths - beds |
show details | |

|
#19
Windtree Trce
Mount Juliet, TN 37122
|
1,232 sq. feet
|
2 baths - beds |
show details | |

|
#20
Summit Way
Mount Juliet, TN 37122
|
1,204 sq. feet
|
2 baths - beds |
show details |
| Photo | Address | Area | Beds / Baths | Price | Details |
|---|---|---|---|---|---|

|
#21
Sunset Dr
Mount Juliet, TN 37122
|
1,172 sq. feet
|
2 baths - beds |
show details | |

|
#22
Central Pike
Mount Juliet, TN 37122
|
2,321 sq. feet
|
3 baths - beds |
show details | |

|
#23
Weston Dr
Mount Juliet, TN 37122
|
1,894 sq. feet
|
2 baths - beds |
show details | |

|
#24
Acorn Way
Mount Juliet, TN 37122
|
2,460 sq. feet
|
2 baths - beds |
show details | |

|
#25
Lucy Dr
Mount Juliet, TN 37122
|
1,280 sq. feet
|
2 baths - beds |
show details | |

|
#26
Kalye Ct
Mount Juliet, TN 37122
|
2,198 sq. feet
|
2 baths - beds |
show details | |

|
#27
Ridgetop Dr
Mount Juliet, TN 37122
|
2,460 sq. feet
|
2 baths - beds |
show details | |

|
#28
Secretariat Dr
Mount Juliet, TN 37122
|
1,863 sq. feet
|
2 baths - beds |
show details | |

|
#29
Brookstone Dr
Mount Juliet, TN 37122
|
2,110 sq. feet
|
2 baths - beds |
show details | |

|
#30
Quarry Rd
Mount Juliet, TN 37122
|
1,200 sq. feet
|
1 baths - beds |
show details |
| Photo | Address | Area | Beds / Baths | Price | Details |
|---|---|---|---|---|---|

|
#31
Collier Rd
Mount Juliet, TN 37122
|
- sq. feet
|
- baths - beds |
show details | |

|
#32
Alvin Sperry Pass
Mount Juliet, TN 37122
|
- sq. feet
|
- baths - beds |
show details | |

|
#33
Starr Dr
Mount Juliet, TN 37122
|
- sq. feet
|
- baths - beds |
show details | |

|
#34
N Mount Juliet Rd
Mount Juliet, TN 37122
|
- sq. feet
|
- baths - beds |
show details | |

|
#35
Timber Trail Dr
Mount Juliet, TN 37122
|
- sq. feet
|
- baths - beds |
show details | |

|
#36
Old Lebanon Dirt Rd Apt E60
Mount Juliet, TN 37122
|
- sq. feet
|
- baths - beds |
show details | |

|
#37
Boxcroft Cir
Mount Juliet, TN 37122
|
- sq. feet
|
- baths - beds |
show details | |

|
#38
Landon Dr, Apt 1034
Mount Juliet, TN 37122
|
- sq. feet
|
- baths - beds |
show details | |

|
#39
Sunny Acre Dr
Mount Juliet, TN 37122
|
- sq. feet
|
- baths - beds |
show details | |

|
#40
Logue Rd
Mount Juliet, TN 37122
|
1,440 sq. feet
|
- baths - beds |
show details |
| Photo | Address | Area | Beds / Baths | Price | Details |
|---|---|---|---|---|---|

|
#41
Lebanon Rd
Mount Juliet, TN 37122
|
960 sq. feet
|
- baths - beds |
show details | |

|
#42
Buckhead Trl # 1529
Mount Juliet, TN 37122
|
- sq. feet
|
- baths - beds |
show details | |

|
#43
Aventura Dr
Mount Juliet, TN 37122
|
- sq. feet
|
- baths - beds |
show details | |

|
#44
Terrace Hill Rd
Mount Juliet, TN 37122
|
756 sq. feet
|
- baths - beds |
show details | |

|
#45
Garrett Way
Mount Juliet, TN 37122
|
- sq. feet
|
- baths - beds |
show details | |

|
#46
S Mount Juliet Rd Ste 535
Mount Juliet, TN 37122
|
- sq. feet
|
- baths - beds |
show details | |

|
#47
Willow Creek Dr
Mount Juliet, TN 37122
|
- sq. feet
|
- baths - beds |
show details | |

|
#48
Rolling Creek Dr
Mount Juliet, TN 37122
|
- sq. feet
|
- baths - beds |
show details | |

|
#49
Nonaville Rd # 1130
Mount Juliet, TN 37122
|
- sq. feet
|
- baths - beds |
show details | |

|
Check over 1 million property listings on Foreclosure.com!
|
browse all offers | |||


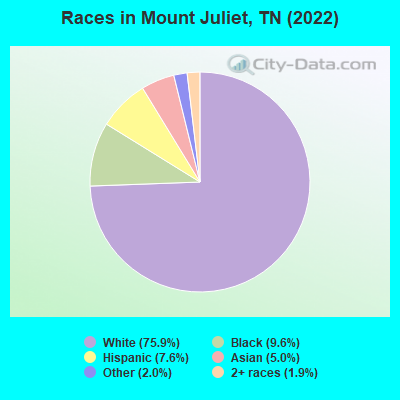
- 31,91375.9%White alone
- 4,0369.6%Black alone
- 3,1957.6%Hispanic
- 2,0925.0%Asian alone
- 8222.0%Other race alone
- 8111.9%Two or more races
- 160.04%American Indian alone
Races in Mount Juliet detailed stats: ancestries, foreign born residents, place of birth
According to our research of Tennessee and other state lists, there were 35 registered sex offenders living in Mount Juliet, Tennessee as of April 28, 2024.
The ratio of all residents to sex offenders in Mount Juliet is 866 to 1.
The ratio of registered sex offenders to all residents in this city is much lower than the state average.
Type |
2009 |
2010 |
2011 |
2012 |
2013 |
2014 |
2015 |
2016 |
2017 |
2018 |
2019 |
2020 |
2021 |
2022 |
|---|---|---|---|---|---|---|---|---|---|---|---|---|---|---|
| Murders (per 100,000) | 0 (0.0) | 1 (4.2) | 0 (0.0) | 1 (4.1) | 0 (0.0) | 1 (3.4) | 0 (0.0) | 0 (0.0) | 0 (0.0) | 0 (0.0) | 1 (2.7) | 0 (0.0) | 0 (0.0) | 0 (0.0) |
| Rapes (per 100,000) | 3 (13.2) | 3 (12.7) | 1 (4.2) | 3 (12.3) | 12 (43.6) | 8 (27.5) | 8 (26.1) | 6 (18.2) | 14 (40.1) | 16 (44.0) | 2 (5.4) | 10 (25.8) | 6 (14.9) | 2 (4.8) |
| Robberies (per 100,000) | 4 (17.6) | 6 (25.3) | 10 (41.9) | 5 (20.5) | 5 (18.2) | 6 (20.6) | 9 (29.4) | 3 (9.1) | 11 (31.5) | 10 (27.5) | 9 (24.1) | 3 (7.8) | 1 (2.5) | 2 (4.8) |
| Assaults (per 100,000) | 45 (197.6) | 39 (164.8) | 44 (184.2) | 46 (188.4) | 31 (112.6) | 47 (161.5) | 34 (111.1) | 46 (139.2) | 36 (103.2) | 44 (120.9) | 47 (125.8) | 62 (160.3) | 40 (99.4) | 36 (86.0) |
| Burglaries (per 100,000) | 88 (386.3) | 77 (325.3) | 77 (322.4) | 68 (278.5) | 61 (221.5) | 57 (195.8) | 63 (205.8) | 57 (172.5) | 34 (97.5) | 43 (118.1) | 23 (61.6) | 55 (142.2) | 36 (89.5) | 19 (45.4) |
| Thefts (per 100,000) | 362 (1,589) | 404 (1,707) | 367 (1,537) | 367 (1,503) | 379 (1,376) | 466 (1,601) | 509 (1,663) | 419 (1,268) | 527 (1,511) | 535 (1,470) | 456 (1,221) | 530 (1,370) | 347 (862.5) | 343 (819.6) |
| Auto thefts (per 100,000) | 13 (57.1) | 12 (50.7) | 15 (62.8) | 14 (57.3) | 19 (69.0) | 16 (55.0) | 12 (39.2) | 14 (42.4) | 52 (149.0) | 52 (142.9) | 43 (115.1) | 40 (103.4) | 27 (67.1) | 28 (66.9) |
| Arson (per 100,000) | 0 (0.0) | 1 (4.2) | 0 (0.0) | 2 (8.2) | 0 (0.0) | 1 (3.4) | 1 (3.3) | 0 (0.0) | 2 (5.7) | 0 (0.0) | 0 (0.0) | 1 (2.6) | 0 (0.0) | 0 (0.0) |
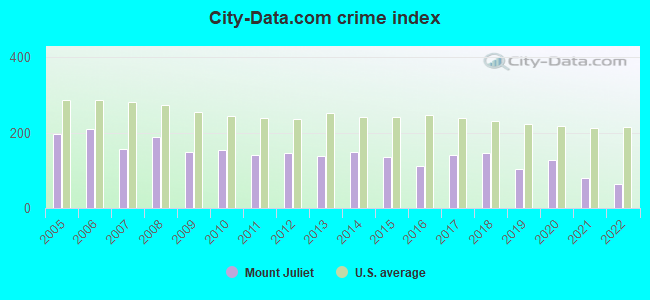
| City-Data.com crime index | 150.5 | 154.2 | 141.8 | 146.0 | 138.9 | 149.5 | 136.0 | 111.3 | 141.4 | 146.1 | 104.4 | 128.1 | 78.7 | 63.8 |
The City-Data.com crime index weighs serious crimes and violent crimes more heavily. Higher means more crime, U.S. average is 246.1. It adjusts for the number of visitors and daily workers commuting into cities.
Crime rate in Mount Juliet detailed stats: murders, rapes, robberies, assaults, burglaries, thefts, arson
Full-time law enforcement employees in 2021, including police officers: 83 (65 officers - 56 male; 9 female).
| Officers per 1,000 residents here: | 1.62 |
| Tennessee average: | 2.57 |
 Recent articles from our blog. Our writers, many of them Ph.D. graduates or candidates, create easy-to-read articles on a wide variety of topics.

 | Mount Juliet for family with kids? (13 replies) |
| Hendersonville VS Mount Juliet and surrounding areas??? (16 replies) |
| Ranking of Nashville's nicest suburbs (at least a try) (75 replies) |
| Hendersonville or Mount Juliet? (1 reply) |
| Tennessee's 2020 Census results (70 replies) |
| New construction home in Mount Juliet (10 replies) |
Latest news from Mount Juliet, TN collected exclusively by city-data.com from local newspapers, TV, and radio stations
Mount Juliet, TN City Guides:
Ancestries: American (15.2%), English (10.4%), Irish (7.6%), German (7.0%), European (4.3%), Egyptian (3.5%).
Current Local Time: CST time zone
Incorporated in 1972
Elevation: 550 feet
Land area: 16.2 square miles.
Population density: 2,619 people per square mile (average).
4,315 residents are foreign born (3.2% Asia, 3.1% Latin America, 2.0% Europe, 1.7% Africa).
| This city: | 10.3% |
| Tennessee: | 5.4% |
Median real estate property taxes paid for housing units with mortgages in 2022: $1,841 (0.4%)
Median real estate property taxes paid for housing units with no mortgage in 2022: $1,763 (0.4%)
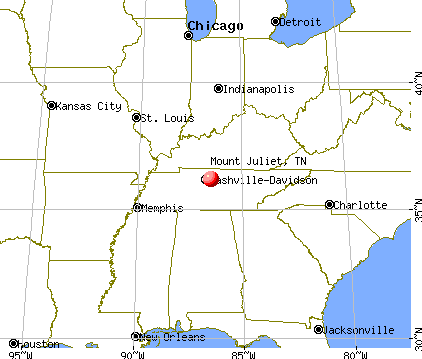
Nearest city with pop. 50,000+: Nashville-Davidson, TN  (14.3 miles , pop. 545,524).
Nearest city with pop. 1,000,000+: Chicago, IL (395.0 miles , pop. 2,896,016).
Nearest cities:
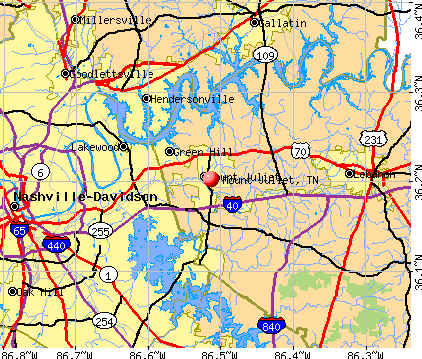
), ), ), ), ), Latitude: 36.20 N, Longitude: 86.51 W
Daytime population change due to commuting: -1,723 (-4.1%)
Workers who live and work in this city: 8,543 (38.9%)
Area code: 615

Mount Juliet tourist attractions:
Mount Juliet, Tennessee accommodation & food services, waste management - Economy and Business Data
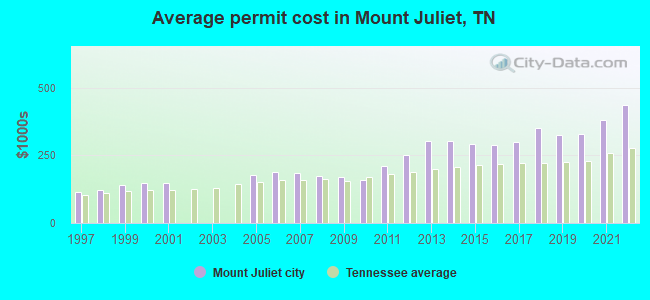
Single-family new house construction building permits:
- 2022: 155 buildings, average cost: $437,100
- 2021: 609 buildings, average cost: $379,900
- 2020: 649 buildings, average cost: $331,100
- 2019: 602 buildings, average cost: $327,000
- 2018: 485 buildings, average cost: $352,900
- 2017: 503 buildings, average cost: $299,700
- 2016: 428 buildings, average cost: $289,200
- 2015: 296 buildings, average cost: $291,100
- 2014: 362 buildings, average cost: $304,700
- 2013: 360 buildings, average cost: $304,900
- 2012: 386 buildings, average cost: $251,500
- 2011: 341 buildings, average cost: $210,200
- 2010: 347 buildings, average cost: $158,800
- 2009: 208 buildings, average cost: $170,700
- 2008: 337 buildings, average cost: $175,400
- 2007: 549 buildings, average cost: $185,200
- 2006: 388 buildings, average cost: $190,300
- 2005: 499 buildings, average cost: $178,800
- 2001: 293 buildings, average cost: $148,400
- 2000: 279 buildings, average cost: $148,800
- 1999: 240 buildings, average cost: $138,800
- 1998: 230 buildings, average cost: $120,500
- 1997: 149 buildings, average cost: $115,900
| Here: | 2.5% |
| Tennessee: | 3.0% |
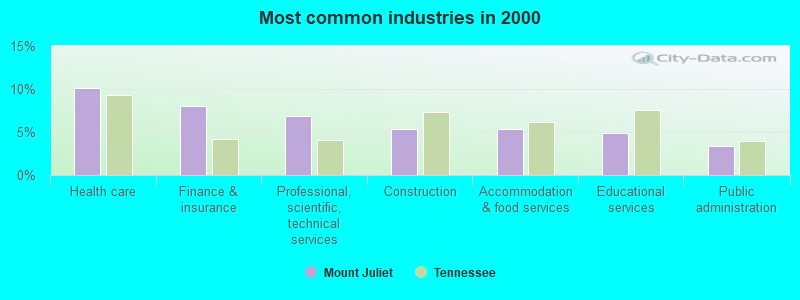
- Health care (10.1%)
- Finance & insurance (8.0%)
- Professional, scientific, technical services (6.8%)
- Construction (5.4%)
- Accommodation & food services (5.3%)
- Educational services (4.9%)
- Public administration (3.4%)
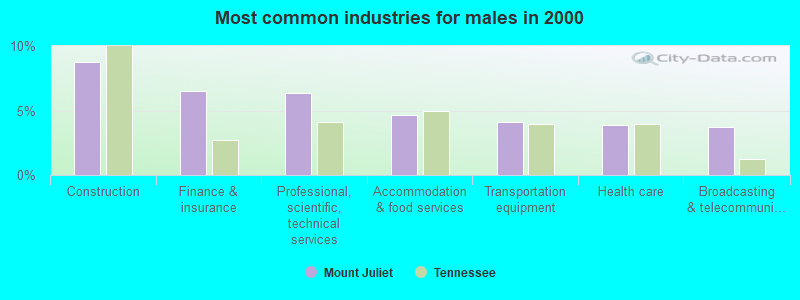
- Construction (8.8%)
- Finance & insurance (6.5%)
- Professional, scientific, technical services (6.4%)
- Accommodation & food services (4.6%)
- Transportation equipment (4.1%)
- Health care (3.9%)
- Broadcasting & telecommunications (3.7%)
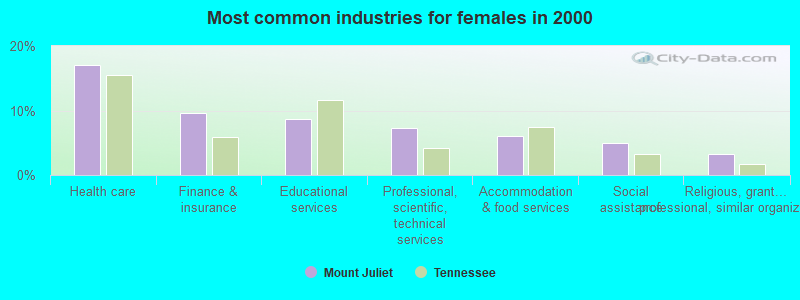
- Health care (17.1%)
- Finance & insurance (9.6%)
- Educational services (8.7%)
- Professional, scientific, technical services (7.3%)
- Accommodation & food services (6.0%)
- Social assistance (4.9%)
- Religious, grantmaking, civic, professional, similar organizations (3.2%)
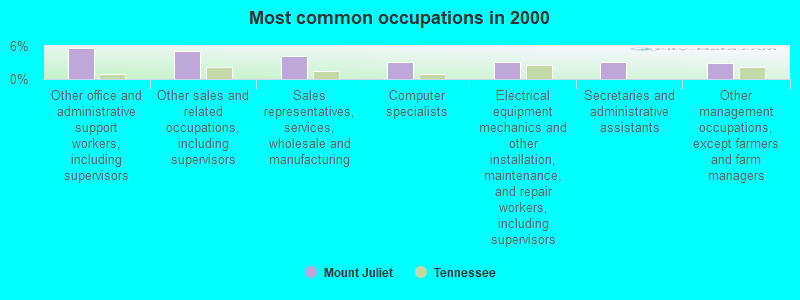
- Other office and administrative support workers, including supervisors (5.7%)
- Other sales and related occupations, including supervisors (5.2%)
- Sales representatives, services, wholesale and manufacturing (4.2%)
- Computer specialists (3.1%)
- Electrical equipment mechanics and other installation, maintenance, and repair workers, including supervisors (3.1%)
- Secretaries and administrative assistants (3.0%)
- Other management occupations, except farmers and farm managers (2.9%)
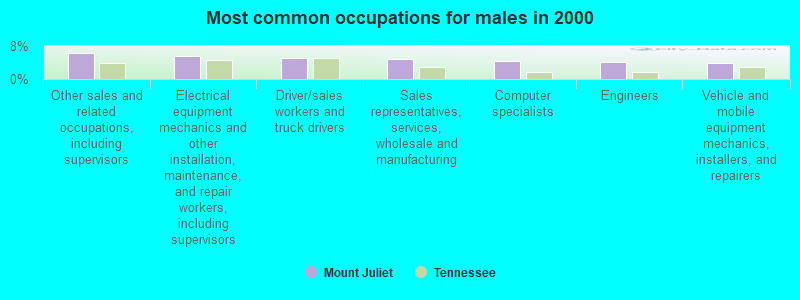
- Other sales and related occupations, including supervisors (6.2%)
- Electrical equipment mechanics and other installation, maintenance, and repair workers, including supervisors (5.7%)
- Driver/sales workers and truck drivers (5.0%)
- Sales representatives, services, wholesale and manufacturing (4.9%)
- Computer specialists (4.3%)
- Engineers (4.1%)
- Vehicle and mobile equipment mechanics, installers, and repairers (3.8%)
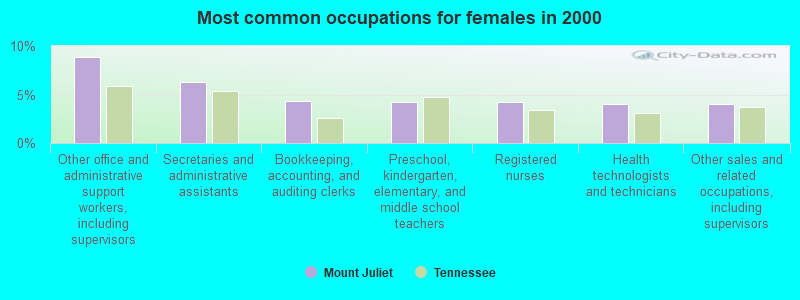
- Other office and administrative support workers, including supervisors (8.9%)
- Secretaries and administrative assistants (6.3%)
- Bookkeeping, accounting, and auditing clerks (4.3%)
- Preschool, kindergarten, elementary, and middle school teachers (4.3%)
- Registered nurses (4.2%)
- Health technologists and technicians (4.0%)
- Other sales and related occupations, including supervisors (4.0%)
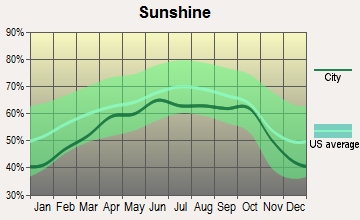
Average climate in Mount Juliet, Tennessee
Based on data reported by over 4,000 weather stations


|
|


(lower is better)
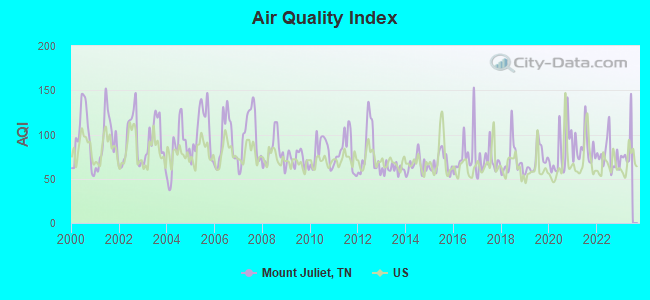
Air Quality Index (AQI) level in 2022 was 76.0. This is about average.
| City: | 76.0 |
| U.S.: | 72.6 |
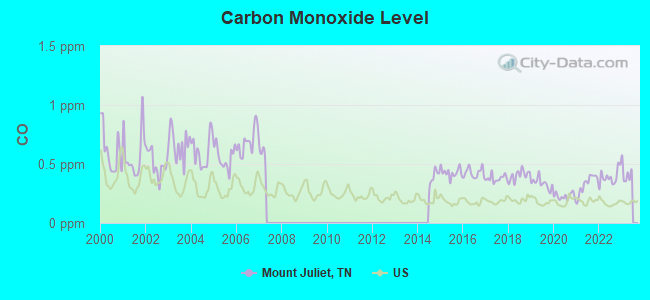
Carbon Monoxide (CO) [ppm] level in 2022 was 0.390. This is significantly worse than average. Closest monitor was 9.8 miles away from the city center.
| City: | 0.390 |
| U.S.: | 0.251 |
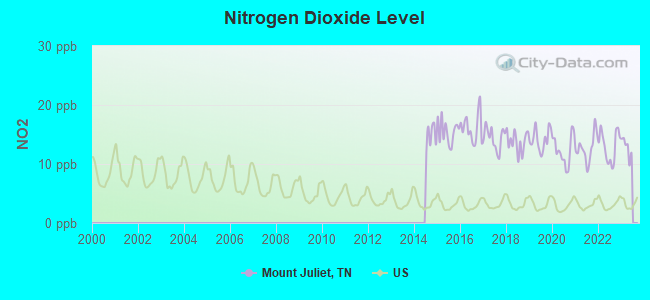
Nitrogen Dioxide (NO2) [ppb] level in 2022 was 13.0. This is significantly worse than average. Closest monitor was 7.2 miles away from the city center.
| City: | 13.0 |
| U.S.: | 5.1 |
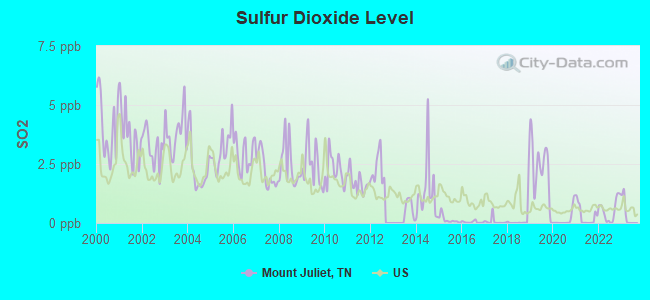
Sulfur Dioxide (SO2) [ppb] level in 2022 was 0.553. This is significantly better than average. Closest monitor was 7.2 miles away from the city center.
| City: | 0.553 |
| U.S.: | 1.515 |
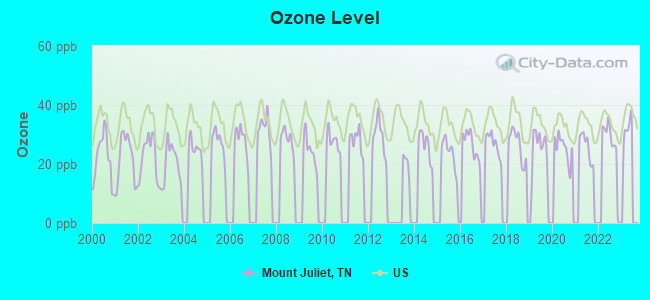
Ozone [ppb] level in 2022 was 26.8. This is better than average. Closest monitor was 12.9 miles away from the city center.
| City: | 26.8 |
| U.S.: | 33.3 |
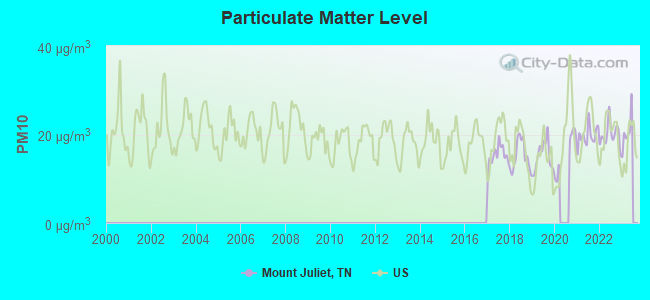
Particulate Matter (PM10) [µg/m3] level in 2022 was 20.0. This is about average. Closest monitor was 12.7 miles away from the city center.
| City: | 20.0 |
| U.S.: | 19.2 |
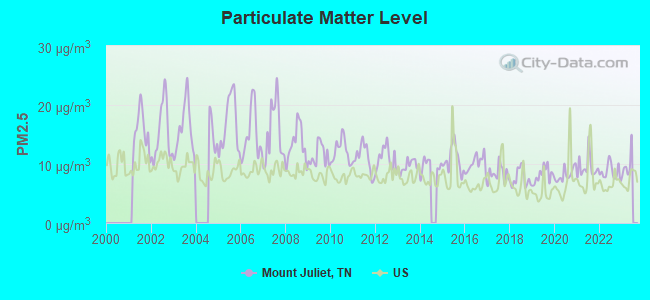
Particulate Matter (PM2.5) [µg/m3] level in 2022 was 8.68. This is about average. Closest monitor was 10.2 miles away from the city center.
| City: | 8.68 |
| U.S.: | 8.11 |
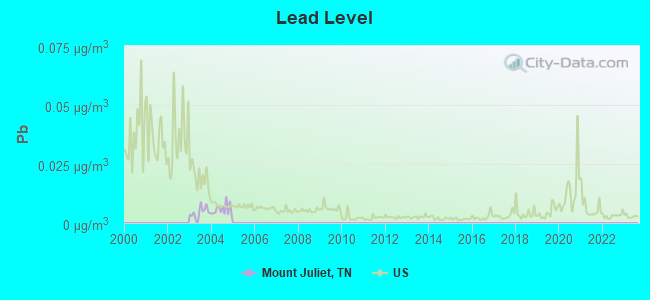
Lead (Pb) [µg/m3] level in 2004 was 0.00575. This is significantly better than average. Closest monitor was 7.2 miles away from the city center.
| City: | 0.00575 |
| U.S.: | 0.00931 |
Tornado activity:
Mount Juliet-area historical tornado activity is slightly above Tennessee state average. It is 68% greater than the overall U.S. average.
On 12/24/1988, a category F4 (max. wind speeds 207-260 mph) tornado 19.1 miles away from the Mount Juliet city center killed one person and injured 7 people and caused between $5,000,000 and $50,000,000 in damages.
On 4/27/1970, a category F4 tornado 25.3 miles away from the city center killed 3 people and injured 85 people and caused between $500,000 and $5,000,000 in damages.
Earthquake activity:
Mount Juliet-area historical earthquake activity is significantly above Tennessee state average. It is 183% greater than the overall U.S. average.On 4/18/2008 at 09:36:59, a magnitude 5.4 (5.1 MB, 4.8 MS, 5.4 MW, 5.2 MW, Class: Moderate, Intensity: VI - VII) earthquake occurred 172.9 miles away from the city center
On 4/18/2008 at 09:36:59, a magnitude 5.2 (5.2 MW, Depth: 8.9 mi) earthquake occurred 172.9 miles away from the city center
On 6/18/2002 at 17:37:15, a magnitude 5.0 (4.3 MB, 4.6 MW, 5.0 LG) earthquake occurred 141.8 miles away from the city center
On 4/29/2003 at 08:59:39, a magnitude 4.9 (4.4 MB, 4.6 MW, 4.9 LG, Class: Light, Intensity: IV - V) earthquake occurred 128.3 miles away from Mount Juliet center
On 7/27/1980 at 18:52:21, a magnitude 5.2 (5.1 MB, 4.7 MS, 5.0 UK, 5.2 UK) earthquake occurred 198.1 miles away from the city center
On 6/10/1987 at 23:48:54, a magnitude 5.1 (4.9 MB, 4.4 MS, 4.6 MS, 5.1 LG) earthquake occurred 196.1 miles away from the city center
Magnitude types: regional Lg-wave magnitude (LG), body-wave magnitude (MB), surface-wave magnitude (MS), moment magnitude (MW)
Natural disasters:
The number of natural disasters in Wilson County (10) is smaller than the US average (15).Major Disasters (Presidential) Declared: 6
Emergencies Declared: 2
Causes of natural disasters: Tornadoes: 6, Floods: 5, Storms: 5, Winds: 2, Winter Storms: 2, Flash Flood: 1, Hurricane: 1, Ice Storm: 1, Snowfall: 1, Other: 1 (Note: some incidents may be assigned to more than one category).

Hospitals and medical centers in Mount Juliet:
- ELK VALLEY HOME HEALTH (2442 N MT JULIET ROAD)
- MT JULIET HEALTH CARE CENTER (2650 NORTH MT JULIET ROAD)
Other hospitals and medical centers near Mount Juliet:
- TRISTAR SUMMIT MEDICAL CENTER Acute Care Hospitals (about 6 miles away; HERMITAGE, TN)
- SUMMIT SUBACUTE CARE UNIT (Nursing Home, about 6 miles away; HERMITAGE, TN)
- DCI SUMMIT (Dialysis Facility, about 6 miles away; HERMITAGE, TN)
- MCKENDREE VILLAGE INC (Nursing Home, about 6 miles away; HERMITAGE, TN)
- AMEDISYS HOME HEALTH SERVICES (Home Health Center, about 6 miles away; HERMITAGE, TN)
- CLOVER BOTTOM DEVELOPMENTAL CE (Hospital, about 8 miles away; NASHVILLE, TN)
- MIDDLE TN MENTAL HEALTH INSTITUTE (Hospital, about 9 miles away; NASHVILLE, TN)
Colleges/universities with over 2000 students nearest to Mount Juliet:
- Volunteer State Community College (about 12 miles; Gallatin, TN; Full-time enrollment: 5,311)
- Trevecca Nazarene University (about 15 miles; Nashville, TN; FT enrollment: 2,223)
- Belmont University (about 17 miles; Nashville, TN; FT enrollment: 5,795)
- Vanderbilt University (about 17 miles; Nashville, TN; FT enrollment: 10,518)
- Lipscomb University (about 18 miles; Nashville, TN; FT enrollment: 3,827)
- Tennessee State University (about 18 miles; Nashville, TN; FT enrollment: 7,341)
- Nashville State Community College (about 20 miles; Nashville, TN; FT enrollment: 6,436)
Public high school in Mount Juliet:
- MT. JULIET HIGH SCHOOL (Students: 1,614, Location: 1875 GOLDEN BEAR GATEWAY, Grades: 9-12)
Public elementary/middle schools in Mount Juliet:
- WEST WILSON MIDDLE SCHOOL (Students: 992, Location: 935 NORTH MT. JULIET RD, Grades: 6-8)
- MT. JULIET ELEMENTARY (Students: 887, Location: 2521 W. DIVISION ST, Grades: PK-5)
- W A WRIGHT ELEMENTARY (Students: 712, Location: 5017 MARKET PLACE, Grades: KG-5)
- RUTLAND ELEMENTARY (Students: 521, Location: 1995 SOUTH RUTLAND RD, Grades: PK-5)
- STONER CREEK ELEMENTARY (Students: 512, Location: 1035 NORTH MT. JULIET RD, Grades: PK-5)
- LAKEVIEW ELEMENTARY SCHOOL (Location: 6211 SAUNDERSVILLE RD, Grades: KG-5)
- WEST ELEMENTARY (Location: 9315 LEBANON RD, Grades: KG-5)
Points of interest:
Notable locations in Mount Juliet: Green Hill Station (A), Cedar Creek Boat Dock (B), Wilson Emergency Management Agency Station 3 Mount Juliet (C). Display/hide their locations on the map
Shopping Center: Valley Center Shopping Center (1). Display/hide its location on the map
Churches in Mount Juliet include: Green Hill Church (A), Pleasant Grove Church (B), Cloyd Church (C). Display/hide their locations on the map
Cemeteries: Wright Cemetery (1), Mount Juliet Cemetery (2). Display/hide their locations on the map
Reservoirs: Twin Lakes (A), Hidder Cove Lake (B), Benjamin Franklin Lake (C). Display/hide their locations on the map
Park in Mount Juliet: Mount Juliet Little League Park (1). Display/hide its location on the map
Tourist attractions: Christian Paradise (Cultural Attractions- Events- & Facilities; 12020 Lebanon Road) (1), Cedar Creek Sports Center (Amusement & Theme Parks; 10770 Lebanon Road) (2), Laser Q-Zar (Amusement & Theme Parks; 1343 North Mount Juliet Road) (3), Putt-Putt Golf & Games (10770 Lebanon Road) (4), MT Juliet Skate Center (4110 North Mount Juliet Road) (5), Franklin Group Travel (Tours & Charters; 1215 Horseshoe Cove) (6). Display/hide their approximate locations on the map
Court: License & Registration Information - County Court Clerk (65 East Hill Drive) (1). Display/hide its approximate location on the map
Drinking water stations with addresses in Mount Juliet and their reported violations in the past:
WEST WILSON UTILITY DISTRICT (Population served: 55,805, Surface water):Past health violations:
- MCL, Average - Between APR-2005 and JUN-2005, Contaminant: Total Haloacetic Acids (HAA5). Follow-up actions: St Compliance achieved (APR-01-2005), St Public Notif received (2 times from OCT-20-2005 to NOV-04-2005)
| This city: | 2.8 people |
| Tennessee: | 2.5 people |
| This city: | 77.9% |
| Whole state: | 67.3% |
| This city: | 4.8% |
| Whole state: | 5.8% |
Likely homosexual households (counted as self-reported same-sex unmarried-partner households)
- Lesbian couples: 0.4% of all households
- Gay men: 0.4% of all households
105 people in nursing homes in 2000
Banks with most branches in Mount Juliet (2011 data):
- Wilson Bank and Trust: Gladeville Tennessee Branch, Highway 70 Branch, Mt. Juliet Branch, Providence Office Branch. Info updated 2006/11/03: Bank assets: $1,567.4 mil, Deposits: $1,398.3 mil, headquarters in Lebanon, TN, positive income, Commercial Lending Specialization, 25 total offices, Holding Company: Wilson Bank Holding Company
- U.S. Bank National Association: Mt. Juliet Village Publix, Mount Juliet Branch, Providence Marketplace Kroger Branch. Info updated 2012/01/30: Bank assets: $330,470.8 mil, Deposits: $236,091.5 mil, headquarters in Cincinnati, OH, positive income, 3121 total offices, Holding Company: U.S. Bancorp
- First Bank: Firstbank Loan Production Office at 1008 Meb Court, branch established on 2011/04/21; Firstbank at 4110 North Mount Juliet Road, Suite 300, branch established on 2008/12/10. Info updated 2012/02/21: Bank assets: $2,074.4 mil, Deposits: $1,734.5 mil, headquarters in Lexington, TN, positive income, Commercial Lending Specialization, 54 total offices, Holding Company: First South Bancorp, Inc.
- First Freedom Bank: Providence Parkway Branch at Providence Pkwy, branch established on 2009/03/11; Mt. Juliet Branch at 12888 Lebanon Road, branch established on 2008/04/17. Info updated 2009/03/25: Bank assets: $237.1 mil, Deposits: $197.4 mil, headquarters in Lebanon, TN, positive income, Commercial Lending Specialization, 3 total offices, Holding Company: First Freedom Bancshares, Inc.
- Pinnacle National Bank: Bank Of The South Branch at 551 North Mt. Juliet Road, branch established on 2001/04/30; Lebanon Road Branch at 11400 Lebanon Road, branch established on 2003/12/15. Info updated 2010/01/06: Bank assets: $4,846.7 mil, Deposits: $3,690.4 mil, headquarters in Nashville, TN, positive income, Commercial Lending Specialization, 33 total offices, Holding Company: Pinnacle Financial Partners, Inc.
- First Tennessee Bank, National Association: Providence Financial Center Branch at 401 South Mt Juliet Road, Suite 133, branch established on 2008/07/28; Mt. Juliet Branch at 1283 North Mt. Juliet Road, branch established on 1974/11/18. Info updated 2009/09/08: Bank assets: $24,563.4 mil, Deposits: $16,402.1 mil, headquarters in Memphis, TN, positive income, Commercial Lending Specialization, 180 total offices, Holding Company: First Horizon National Corporation
- SunTrust Bank: Mt. Juliet Branch at 11359 Lebanon Road, branch established on 1978/06/17; Small Business Lending Branch 746 at 1691 North Mount Juliet Road, branch established on 1989/01/10. Info updated 2010/05/27: Bank assets: $171,291.7 mil, Deposits: $129,833.2 mil, headquarters in Atlanta, GA, positive income, Commercial Lending Specialization, 1716 total offices, Holding Company: Suntrust Banks, Inc.
- Regions Bank: Providence Branch at 301 Providence West Blvd, branch established on 1998/08/03; Providence Branch at 301 Providence West Blvd, branch established on 2004/06/30. Info updated 2011/02/24: Bank assets: $123,368.2 mil, Deposits: $98,301.3 mil, headquarters in Birmingham, AL, positive income, Commercial Lending Specialization, 1778 total offices, Holding Company: Regions Financial Corporation
- The Fort Sill National Bank: Mount Juliet Branch at 300 Pleasant Grove Rd, Suite 600, branch established on 2009/10/28. Info updated 2006/11/03: Bank assets: $369.8 mil, Deposits: $324.4 mil, headquarters in Fort Sill, OK, positive income, 71 total offices, Holding Company: Jrmb Ii, Inc
- 2 other banks with 2 local branches
For population 15 years and over in Mount Juliet:
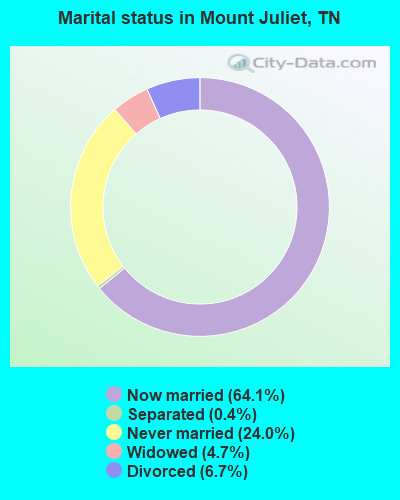
- Never married: 24.0%
- Now married: 64.1%
- Separated: 0.4%
- Widowed: 4.7%
- Divorced: 6.7%
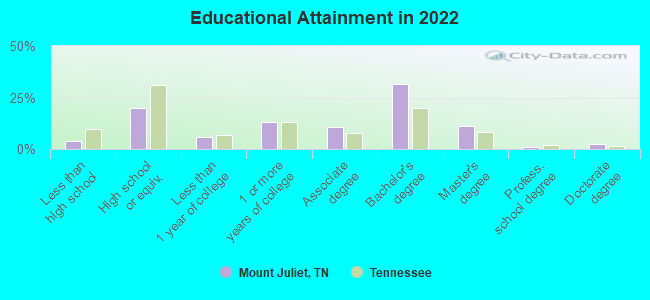
For population 25 years and over in Mount Juliet:
- High school or higher: 96.7%
- Bachelor's degree or higher: 47.9%
- Graduate or professional degree: 16.9%
- Unemployed: 2.7%
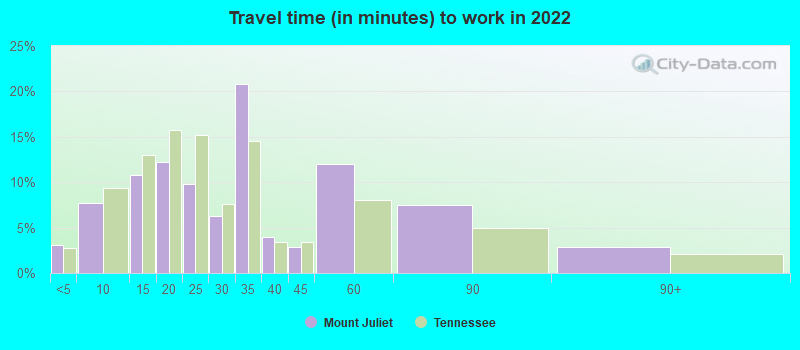
- Mean travel time to work (commute): 23.6 minutes

| Here: | 9.7 |
| Tennessee average: | 11.4 |
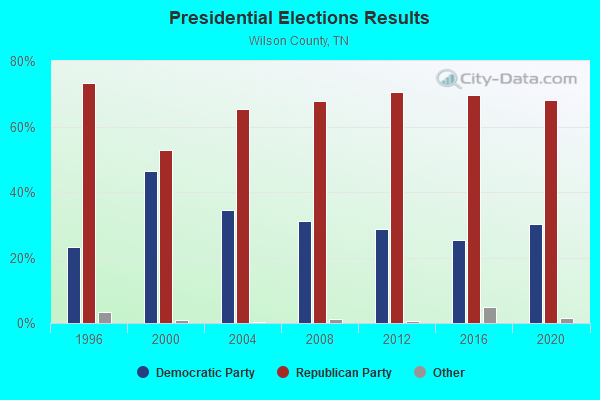
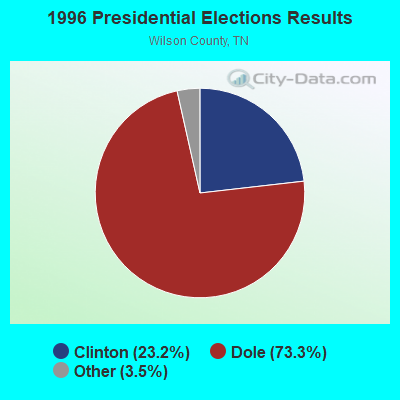
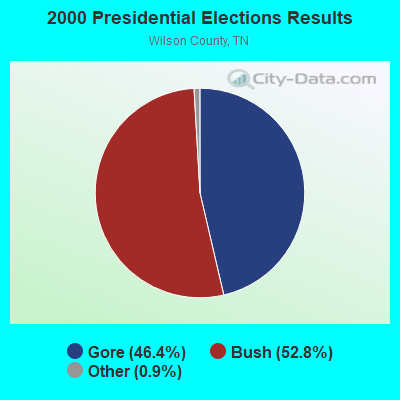
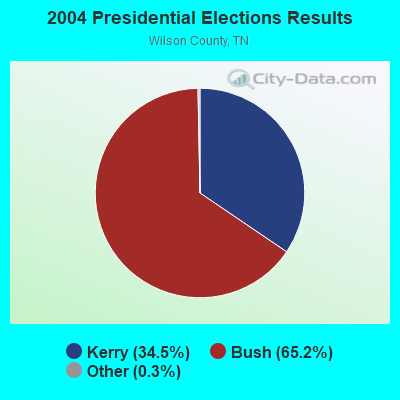
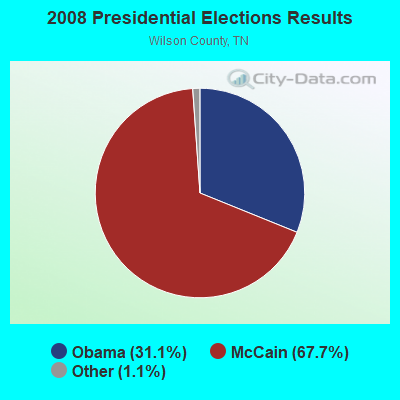


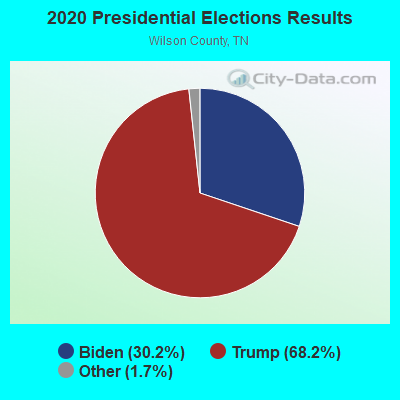
Graphs represent county-level data. Detailed 2008 Election Results
Religion statistics for Mount Juliet, TN (based on Wilson County data)
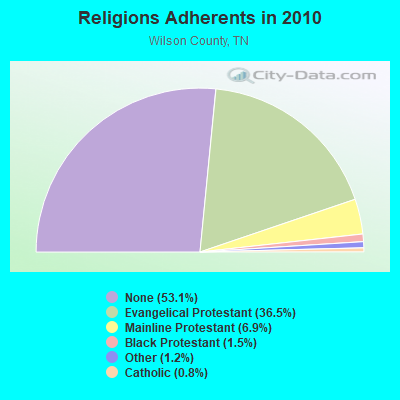
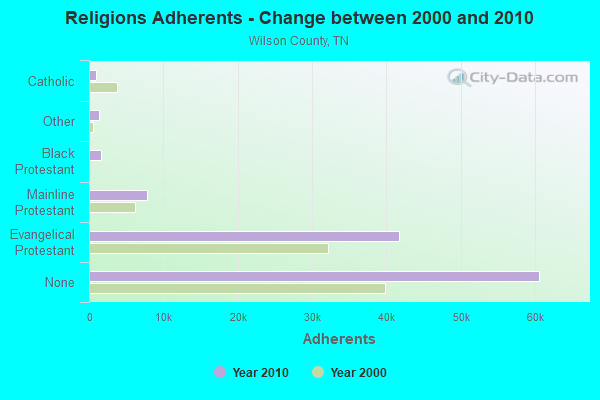
| Religion | Adherents | Congregations |
|---|---|---|
| Evangelical Protestant | 41,655 | 121 |
| Mainline Protestant | 7,843 | 26 |
| Black Protestant | 1,674 | 10 |
| Other | 1,353 | 7 |
| Catholic | 900 | 1 |
| None | 60,568 | - |
Food Environment Statistics:
| Here: | 1.51 / 10,000 pop. |
| Tennessee: | 1.99 / 10,000 pop. |
| This county: | 0.09 / 10,000 pop. |
| Tennessee: | 0.17 / 10,000 pop. |
| Here: | 0.38 / 10,000 pop. |
| Tennessee: | 0.65 / 10,000 pop. |
| Wilson County: | 4.61 / 10,000 pop. |
| Tennessee: | 5.16 / 10,000 pop. |
| Wilson County: | 6.12 / 10,000 pop. |
| State: | 6.56 / 10,000 pop. |
| Wilson County: | 9.9% |
| Tennessee: | 11.4% |
| Wilson County: | 29.3% |
| Tennessee: | 30.2% |
| This county: | 12.5% |
| Tennessee: | 13.5% |
Health and Nutrition:
| This city: | 53.9% |
| State: | 49.3% |
| Mount Juliet: | 54.1% |
| Tennessee: | 46.1% |
| Mount Juliet: | 28.1 |
| State: | 28.8 |
| Here: | 20.3% |
| Tennessee: | 21.0% |
| This city: | 7.9% |
| Tennessee: | 10.5% |
| Mount Juliet: | 6.9 |
| State: | 6.8 |
| This city: | 32.7% |
| Tennessee: | 33.9% |
| This city: | 61.9% |
| Tennessee: | 55.9% |
| This city: | 82.3% |
| Tennessee: | 79.1% |
More about Health and Nutrition of Mount Juliet, TN Residents
Mount Juliet government finances - Expenditure in 2021 (per resident):
- Current Operations - Police Protection: $7,776,000 ($182.76)
Sewerage: $7,095,000 ($166.75)
Regular Highways: $3,178,000 ($74.69)
Local Fire Protection: $2,516,000 ($59.13)
Central Staff Services: $2,300,000 ($54.06)
General Public Buildings: $1,394,000 ($32.76)
Parks and Recreation: $1,156,000 ($27.17)
Public Welfare - Other: $595,000 ($13.98)
Financial Administration: $517,000 ($12.15)
Judicial and Legal Services: $241,000 ($5.66)
- General - Interest on Debt: $549,000 ($12.90)
- Other Capital Outlay - Parks and Recreation: $1,637,000 ($38.47)
Police Protection: $885,000 ($20.80)
Local Fire Protection: $374,000 ($8.79)
Regular Highways: $151,000 ($3.55)
General Public Building: $73,000 ($1.72)
Central Staff Services: $22,000 ($0.52)
- Total Salaries and Wages: $10,799,000 ($253.81)
Mount Juliet government finances - Revenue in 2021 (per resident):
- Charges - Sewerage: $8,377,000 ($196.88)
Regular Highways: $462,000 ($10.86)
Parks and Recreation: $64,000 ($1.50)
Other: $56,000 ($1.32)
- Miscellaneous - Fines and Forfeits: $891,000 ($20.94)
General Revenue - Other: $634,000 ($14.90)
Interest Earnings: $381,000 ($8.95)
Sale of Property: $95,000 ($2.23)
Rents: $84,000 ($1.97)
- State Intergovernmental - Other: $2,566,000 ($60.31)
Highways: $2,532,000 ($59.51)
- Tax - General Sales and Gross Receipts: $17,892,000 ($420.51)
Other License: $4,137,000 ($97.23)
Other Selective Sales: $2,274,000 ($53.45)
Property: $2,117,000 ($49.76)
Alcoholic Beverage Sales: $1,855,000 ($43.60)
Public Utilities Sales: $1,009,000 ($23.71)
Mount Juliet government finances - Debt in 2021 (per resident):
- Long Term Debt - Beginning Outstanding - Unspecified Public Purpose: $15,885,000 ($373.34)
Outstanding Unspecified Public Purpose: $14,517,000 ($341.19)
Retired Unspecified Public Purpose: $10,032,000 ($235.78)
Issue, Unspecified Public Purpose: $8,663,000 ($203.61)
Mount Juliet government finances - Cash and Securities in 2021 (per resident):
- Other Funds - Cash and Securities: $75,735,000 ($1779.99)
| Businesses in Mount Juliet, TN | ||||
| Name | Count | Name | Count | |
|---|---|---|---|---|
| AT&T | 1 | Olive Garden | 1 | |
| Ace Hardware | 1 | Panera Bread | 1 | |
| Advance Auto Parts | 1 | Penske | 1 | |
| Bath & Body Works | 1 | PetSmart | 1 | |
| Burger King | 1 | Pizza Hut | 1 | |
| Chick-Fil-A | 1 | Publix Super Markets | 2 | |
| Chico's | 1 | Quiznos | 1 | |
| Cricket Wireless | 1 | Red Lobster | 1 | |
| Curves | 1 | Rite Aid | 1 | |
| Dairy Queen | 1 | Rue21 | 1 | |
| Discount Tire | 1 | SONIC Drive-In | 2 | |
| Domino's Pizza | 1 | Sprint Nextel | 2 | |
| FedEx | 7 | Starbucks | 1 | |
| Firestone Complete Auto Care | 1 | T-Mobile | 1 | |
| Ford | 1 | Taco Bell | 2 | |
| H&R Block | 1 | Target | 1 | |
| Hardee's | 1 | U-Haul | 1 | |
| Hilton | 1 | UPS | 5 | |
| Holiday Inn | 1 | Verizon Wireless | 2 | |
| Jones New York | 1 | Waffle House | 1 | |
| KFC | 1 | Walgreens | 1 | |
| Kroger | 2 | Walmart | 1 | |
| LensCrafters | 1 | |||
Strongest AM radio stations in Mount Juliet:
- WAMB (1160 AM; 50 kW; DONELSON, TN; Owner: GREAT SOUTHERN BROADCASTING COMPANY, INC.)
- WLAC (1510 AM; 50 kW; NASHVILLE, TN; Owner: CAPSTAR TX LIMITED PARTNERSHIP)
- WSM (650 AM; 50 kW; NASHVILLE, TN; Owner: GAYLORD ENTERTAINMENT COMPANY)
- WKDA (1200 AM; 50 kW; NASHVILLE, TN; Owner: RADIO NASHVILLE, INC.)
- WNQM (1300 AM; 50 kW; NASHVILLE, TN; Owner: WNQM. INC.)
- WPLN (1430 AM; 15 kW; MADISON, TN)
- WYFN (980 AM; 5 kW; NASHVILLE, TN; Owner: BIBLE BRADCASTING NETWORK, INC.)
- WCOR (900 AM; 5 kW; LEBANON, TN)
- WHIN (1010 AM; 5 kW; GALLATIN, TN; Owner: WHIN, INC.)
- WVOL (1470 AM; 5 kW; BERRY HILL, TN)
- WMDB (880 AM; daytime; 2 kW; NASHVILLE, TN; Owner: BABB BROADCASTING COMPANY)
- WYXE (1130 AM; daytime; 2 kW; GALLATIN, TN; Owner: JON GARY ENTERPRISES, INC.)
- WMGC (810 AM; 5 kW; MURFREESBORO, TN; Owner: RADIO 810 NASHVILLE, LIMITED)
Strongest FM radio stations in Mount Juliet:
- WMOT (89.5 FM; MURFREESBORO, TN; Owner: MIDDLE TENNESSEE STATE UNIVERSITY)
- WGFX (104.5 FM; GALLATIN, TN; Owner: CITADEL BROADCASTING COMPANY)
- WMAK (96.3 FM; MURFREESBORO, TN; Owner: SOUTH CENTRAL COMMUNICATIONS CORP.)
- WRVW (107.5 FM; LEBANON, TN; Owner: CAPSTAR TX LIMITED PARTNERSHIP)
- WNPL (106.7 FM; BELLE MEADE, TN; Owner: CUMULUS LICENSING CORP.)
- WSM-FM (95.5 FM; NASHVILLE, TN; Owner: CUMULUS LICENSING CORP.)
- WSIX-FM (97.9 FM; NASHVILLE, TN; Owner: CAPSTAR TX LIMITED PARTNERSHIP)
- WKDF (103.3 FM; NASHVILLE, TN; Owner: CITADEL BROADCASTING COMPANY)
- WNRQ (105.9 FM; NASHVILLE, TN; Owner: CAPSTAR TX LIMITED PARTNERSHIP)
- WRLT (100.1 FM; FRANKLIN, TN; Owner: TUNED-IN BROADCASTING, INC)
- WPLN-FM (90.3 FM; NASHVILLE, TN; Owner: NASHVILLE PUBLIC RADIO)
- WAYM (88.7 FM; COLUMBIA, TN; Owner: WAY-FM MEDIA GROUP, INC.)
- WRQQ (97.1 FM; GOODLETTSVILLE, TN; Owner: CUMULUS LICENSING CORP.)
- WJXA (92.9 FM; NASHVILLE, TN; Owner: SOUTH CENTRAL COMMUNICATIONS CORP.)
- WRVU (91.1 FM; NASHVILLE, TN; Owner: VANDERBILT STUDENT COMMUNICATIONS, INC.)
- WQQK (92.1 FM; HENDERSONVILLE, TN; Owner: PHOENIX OF HENDERSONVILLE, INC.)
- WBUZ (102.9 FM; LA VERGNE, TN; Owner: WYCQ, INC)
- WVCP (88.5 FM; GALLATIN, TN; Owner: VOLUNTEER STATE COMMUNITY COLLEGE)
- WANT (98.9 FM; LEBANON, TN; Owner: BAY-POINTE BROADCASTING, INC.)
- WFFI (93.7 FM; KINGSTON SPRINGS, TN; Owner: CARON BROADCASTING, INC.)
TV broadcast stations around Mount Juliet:
- WHTN (Channel 39; MURFREESBORO, TN; Owner: CHRISTIAN TELEVISION NETWORK, INC.)
- WTVF (Channel 5; NASHVILLE, TN; Owner: NEWSCHANNEL 5 NETWORK, LP)
- WNPX (Channel 28; COOKEVILLE, TN; Owner: PAXSON COMMUNICATIONS LICENSE COMPANY, LLC)
- WUXP-TV (Channel 30; NASHVILLE, TN; Owner: WUXP LICENSEE, LLC)
- WPGD (Channel 50; HENDERSONVILLE, TN; Owner: TRINITY BROADCASTING NETWORK)
- WSMV-TV (Channel 4; NASHVILLE, TN; Owner: MEREDITH CORPORATION)
- WZTV (Channel 17; NASHVILLE, TN; Owner: WZTV LICENSEE, LLC)
- WKRN-TV (Channel 2; NASHVILLE, TN; Owner: WKRN, G.P.)
- WNAB (Channel 58; NASHVILLE, TN; Owner: NASHVILLE LICENSE HOLDINGS, L.L.C.)
- WNPX-LP (Channel 20; NASHVILLE, TN; Owner: PAXSON COMMUNICATIONS LPTV, INC.)
- W36AK (Channel 36; NASHVILLE, TN; Owner: TRINITY BROADCASTING NETWORK)
- WIIW-LP (Channel 14; NASHVILLE, TN; Owner: EQUITY BROADCASTING CORPORATION)
- WNPT (Channel 8; NASHVILLE, TN; Owner: NASHVILLE PUBLIC TELEVISION, INC.)
- WJFB (Channel 66; LEBANON, TN; Owner: BRYANT BROADCASTING, INC.)
- WGAP-LP (Channel 26; NASHVILLE, TN; Owner: SOUTH CENTRAL COMMUNICATIONS CORP.)
- WJDE-LP (Channel 24; NASHVILLE, TN; Owner: SOUTH CENTRAL COMMUNICATIONS CORP.)
- WRMX-LP (Channel 12; NASHVILLE, TN; Owner: SOUTH CENTRAL COMMUNICATIONS CORP.)
- WJNK-LP (Channel 61; NASHVILLE, TN; Owner: THREE ANGELS BROADCASTING NETWORK, INC.)
- W52CT (Channel 52; NASHVILLE, TN; Owner: JKB ASSOCIATES, INC.)
- National Bridge Inventory (NBI) Statistics
- 42Number of bridges
- 253ft / 77.1mTotal length
- $4,768,000Total costs
- 700,651Total average daily traffic
- 80,472Total average daily truck traffic
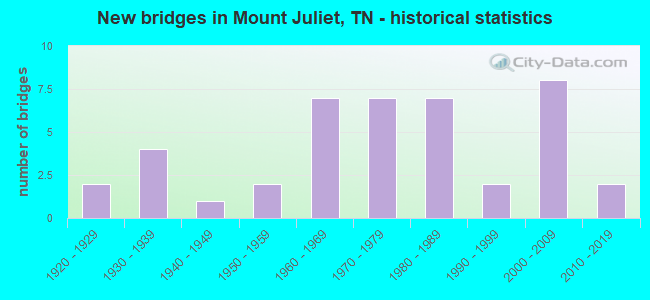
- New bridges - historical statistics
- 21920-1929
- 41930-1939
- 11940-1949
- 21950-1959
- 71960-1969
- 71970-1979
- 71980-1989
- 21990-1999
- 82000-2009
- 22010-2019
FCC Registered Broadcast Land Mobile Towers: 10 (See the full list of FCC Registered Broadcast Land Mobile Towers in Mount Juliet, TN)
FCC Registered Microwave Towers: 21 (See the full list of FCC Registered Microwave Towers in this town)
FCC Registered Amateur Radio Licenses: 221 (See the full list of FCC Registered Amateur Radio Licenses in Mount Juliet)
FAA Registered Aircraft Manufacturers and Dealers: 5 (See the full list of FAA Registered Manufacturers and Dealers in Mount Juliet)
FAA Registered Aircraft: 33 (See the full list of FAA Registered Aircraft)
| Home Mortgage Disclosure Act Aggregated Statistics For Year 2009 (Based on 4 partial tracts) | ||||||||||||
| A) FHA, FSA/RHS & VA Home Purchase Loans | B) Conventional Home Purchase Loans | C) Refinancings | D) Home Improvement Loans | F) Non-occupant Loans on < 5 Family Dwellings (A B C & D) | G) Loans On Manufactured Home Dwelling (A B C & D) | |||||||
|---|---|---|---|---|---|---|---|---|---|---|---|---|
| Number | Average Value | Number | Average Value | Number | Average Value | Number | Average Value | Number | Average Value | Number | Average Value | |
| LOANS ORIGINATED | 104 | $200,561 | 85 | $193,233 | 474 | $183,168 | 14 | $71,310 | 17 | $131,278 | 4 | $77,800 |
| APPLICATIONS APPROVED, NOT ACCEPTED | 5 | $181,528 | 6 | $152,335 | 36 | $191,848 | 4 | $66,208 | 0 | $0 | 0 | $0 |
| APPLICATIONS DENIED | 12 | $172,134 | 10 | $156,252 | 113 | $193,014 | 12 | $40,994 | 5 | $86,860 | 4 | $65,268 |
| APPLICATIONS WITHDRAWN | 20 | $196,974 | 15 | $205,177 | 102 | $184,670 | 6 | $59,407 | 3 | $114,297 | 0 | $0 |
| FILES CLOSED FOR INCOMPLETENESS | 2 | $220,995 | 1 | $164,640 | 21 | $180,466 | 1 | $31,440 | 1 | $159,450 | 0 | $0 |
Detailed HMDA statistics for the following Tracts: 0303.04 , 0303.06, 0303.07, 0309.01
| Private Mortgage Insurance Companies Aggregated Statistics For Year 2009 (Based on 4 partial tracts) | ||||
| A) Conventional Home Purchase Loans | B) Refinancings | |||
|---|---|---|---|---|
| Number | Average Value | Number | Average Value | |
| LOANS ORIGINATED | 16 | $223,367 | 23 | $235,691 |
| APPLICATIONS APPROVED, NOT ACCEPTED | 4 | $207,898 | 6 | $233,032 |
| APPLICATIONS DENIED | 1 | $193,950 | 3 | $229,623 |
| APPLICATIONS WITHDRAWN | 1 | $146,090 | 1 | $348,750 |
| FILES CLOSED FOR INCOMPLETENESS | 0 | $0 | 1 | $225,080 |
Detailed PMIC statistics for the following Tracts: 0303.04 , 0303.06, 0303.07, 0309.01
2002 - 2018 National Fire Incident Reporting System (NFIRS) incidents
- Fire incident types reported to NFIRS in Mount Juliet, TN
- 56050.3%Outside Fires
- 31928.6%Structure Fires
- 20718.6%Mobile Property/Vehicle Fires
- 282.5%Other
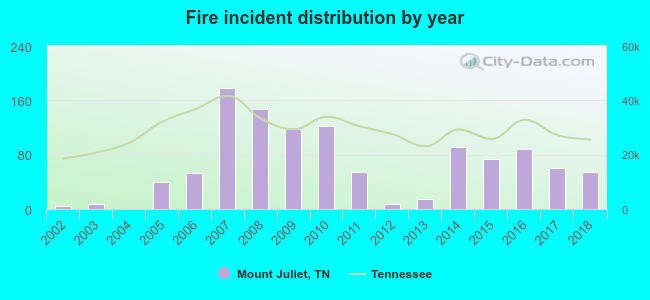 Based on the data from the years 2002 - 2018 the average number of fires per year is 66. The highest number of fire incidents - 178 took place in 2007, and the least - 0 in 2004. The data has a rising trend.
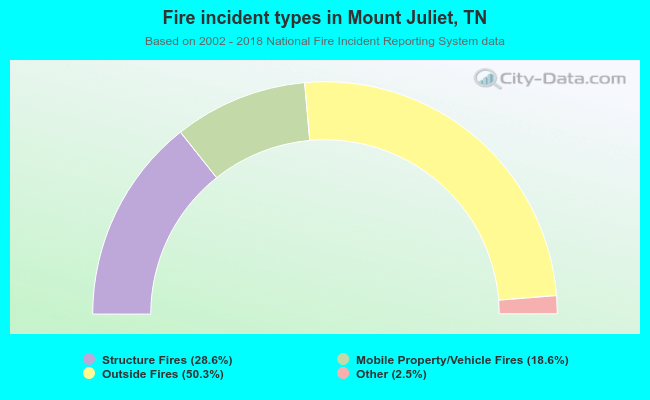 When looking into fire subcategories, the most reports belonged to: Outside Fires (50.3%), and Structure Fires (28.6%).
Fire-safe hotels and motels in Mount Juliet, Tennessee:
- Quality Inn & Suites, 1000 Herschel Dr, Mount Juliet, Tennessee 37122 , Phone: (615) 773-3600, Fax: (615) 773-3601
- Holiday Inn Express & Suites, 565 S Mt Juliet Rd, Mount Juliet, Tennessee 37122 , Phone: (615) 553-5200, Fax: (615) 553-5210
- Hampton Inn And Suites, 5001 Crossings Cir, Mount Juliet, Tennessee 37122 , Phone: (615) 553-5900, Fax: (615) 553-5901
- Comfort Suites Mount Juliet, 600 Red Ink Dr, Mount Juliet, Tennessee 37122 , Phone: (615) 206-3310, Fax: (615) 773-1455
- Courtyard by Marriott Nashville Mount Juliet, 1980 Providence Pkwy, Mount juliet, Tennessee 37122 , Phone: (866) 877-5879, Fax: (615) 432-4071
- Home2 Suites By Hilton, 110 Providence Trl, Mount juliet, Tennessee 37122 , Phone: (615) 288-1065, Fax: (615) 288-1066
- Staybridge Suites Mt. Juliet/ Nashville Area, 69 Belinda Pkwy, Mount juliet, Tennessee 37122 , Phone: (800) 238-8000, Fax: (615) 754-2112
| Most common first names in Mount Juliet, TN among deceased individuals | ||
| Name | Count | Lived (average) |
|---|---|---|
| James | 153 | 71.5 years |
| William | 126 | 71.6 years |
| Robert | 110 | 70.2 years |
| Mary | 108 | 78.8 years |
| John | 94 | 71.9 years |
| Charles | 60 | 71.5 years |
| George | 44 | 72.7 years |
| Joe | 41 | 74.9 years |
| Dorothy | 38 | 76.3 years |
| Margaret | 36 | 75.0 years |
| Most common last names in Mount Juliet, TN among deceased individuals | ||
| Last name | Count | Lived (average) |
|---|---|---|
| Smith | 73 | 74.5 years |
| Jones | 36 | 73.9 years |
| Wright | 36 | 79.0 years |
| Davis | 33 | 78.1 years |
| Williams | 33 | 79.2 years |
| Jackson | 30 | 72.3 years |
| Taylor | 27 | 72.0 years |
| Brown | 27 | 74.0 years |
| Johnson | 24 | 71.2 years |
| Martin | 23 | 75.3 years |
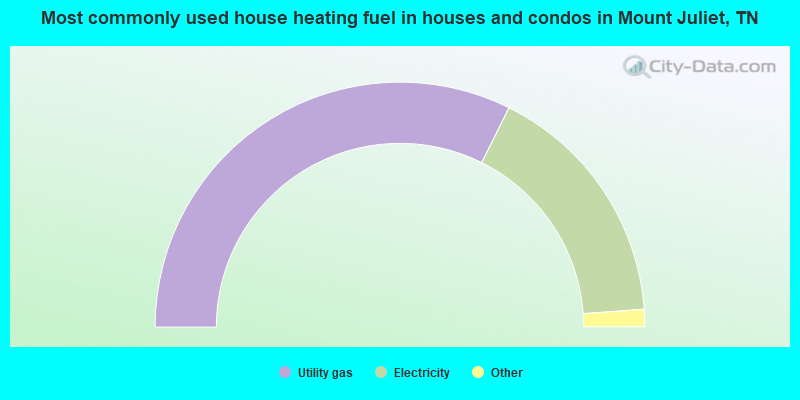
- 64.7%Utility gas
- 33.0%Electricity
- 1.9%Bottled, tank, or LP gas
- 0.3%No fuel used
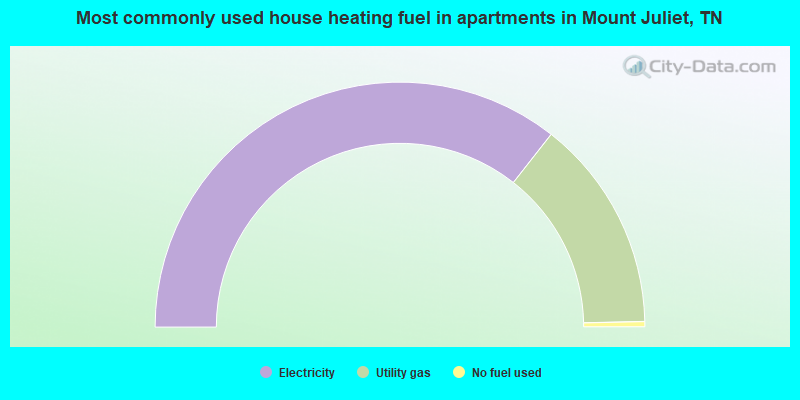
- 71.2%Electricity
- 28.1%Utility gas
- 0.7%No fuel used
Mount Juliet compared to Tennessee state average:
- Median household income above state average.
- Median house value above state average.
- Unemployed percentage significantly below state average.
- Black race population percentage above state average.
- Hispanic race population percentage significantly above state average.
- Foreign-born population percentage significantly above state average.
- Renting percentage below state average.
- House age significantly below state average.
- Number of college students above state average.
- Percentage of population with a bachelor's degree or higher above state average.
Mount Juliet on our top lists:
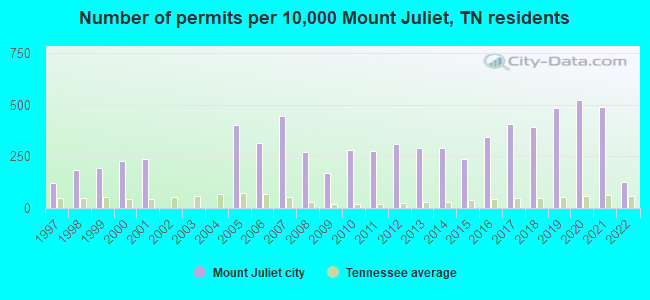
- #67 on the list of "Top 101 cities with most building permits per 10,000 residents (population 5,000+)"
- #29 on the list of "Top 101 counties with the largest number of people moving in compared to moving out (pop. 50,000+)"
- #97 on the list of "Top 101 counties with highest percentage of residents voting for Romney (Republican) in the 2012 Presidential Election (pop. 50,000+)"

|
|
Total of 57 patent applications in 2008-2024.