Hendersonville, Tennessee

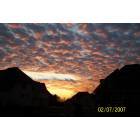
Hendersonville: Sunrise at Saunders Ferry Park

Hendersonville: Setting sun as viewed on W. Main St.

Hendersonville: Fog off the water at Saunder's Ferry Park
Hendersonville: Beautiful Hendersonville, TN Sky behind our home

Hendersonville: Sun rise in Hendersonville, TN (October 2003)

Hendersonville: Sunrise at Saunders Ferry Park

Hendersonville: January 2008 Sunset in Hendersonville
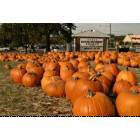
Hendersonville: Fall in Hendersonville
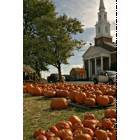
Hendersonville: Fall in Hendersonville
Hendersonville
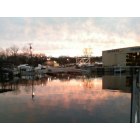
Hendersonville: Drakes Creek Marina the evening
- see
18
more - add
your
Submit your own pictures of this city and show them to the world
- OSM Map
- General Map
- Google Map
- MSN Map
Population change since 2000: +54.8%
| Males: 29,351 | |
| Females: 33,545 |
| Median resident age: | 40.6 years |
| Tennessee median age: | 39.2 years |
Zip codes: 37075.
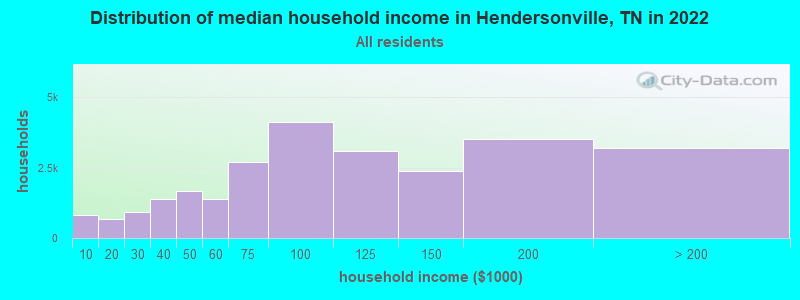
| Hendersonville: | $94,261 |
| TN: | $65,254 |
Estimated per capita income in 2022: $47,058 (it was $24,165 in 2000)
Hendersonville city income, earnings, and wages data
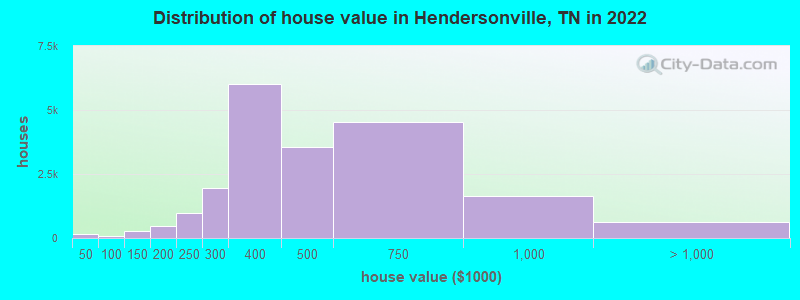
Estimated median house or condo value in 2022: $433,321 (it was $134,200 in 2000)
| Hendersonville: | $433,321 |
| TN: | $284,800 |
Mean prices in 2022: all housing units: $398,025; detached houses: $403,198; townhouses or other attached units: $224,781; in 2-unit structures: $133,065; in 3-to-4-unit structures: $123,543; in 5-or-more-unit structures: $166,012; mobile homes: $69,381
Median gross rent in 2022: $1,543.
Hendersonville, TN residents, houses, and apartments details
(5.9% for White Non-Hispanic residents, 10.6% for Black residents, 12.0% for Hispanic or Latino residents, 1.3% for other race residents, 5.9% for two or more races residents)
Detailed information about poverty and poor residents in Hendersonville, TN


Compare current foreclosures in Hendersonville, TN:
| Photo | Address | Area | Beds / Baths | Price | Details |
|---|---|---|---|---|---|

|
#1
Chippendale Dr
Hendersonville, TN 37075
|
1,819 sq. feet
|
1 baths 4 beds |
show details | |

|
#2
Manor Way
Hendersonville, TN 37075
|
- sq. feet
|
4 baths 6 beds |
show details | |

|
#3
Tamaras Ct
Hendersonville, TN 37075
|
2,638 sq. feet
|
3 baths - beds |
show details | |

|
#4
Burrus Ave
Hendersonville, TN 37075
|
1,384 sq. feet
|
1 baths - beds |
show details | |

|
#5
Lucinda Ln
Hendersonville, TN 37075
|
1,100 sq. feet
|
1 baths - beds |
show details | |

|
#6
Cumberland Hills Dr
Hendersonville, TN 37075
|
2,696 sq. feet
|
2 baths - beds |
show details | |

|
#7
N Birchwood Dr
Hendersonville, TN 37075
|
1,178 sq. feet
|
2 baths - beds |
show details | |

|
#8
Dennis Rd
Hendersonville, TN 37075
|
1,575 sq. feet
|
1 baths - beds |
show details | |

|
#9
Ashland Pt
Hendersonville, TN 37075
|
2,880 sq. feet
|
5 baths - beds |
show details | |

|
#10
Beaumont Dr
Hendersonville, TN 37075
|
2,532 sq. feet
|
3 baths - beds |
show details |
| Photo | Address | Area | Beds / Baths | Price | Details |
|---|---|---|---|---|---|

|
#11
Paradise Dr
Hendersonville, TN 37075
|
2,031 sq. feet
|
2 baths - beds |
show details | |

|
#12
S Valley Rd
Hendersonville, TN 37075
|
2,030 sq. feet
|
1 baths - beds |
show details | |

|
#13
Bluegrass Cir
Hendersonville, TN 37075
|
4,276 sq. feet
|
3 baths - beds |
show details | |

|
#14
Raindrop Ln
Hendersonville, TN 37075
|
1,133 sq. feet
|
2 baths - beds |
show details | |

|
#15
Cumberland Hills Dr
Hendersonville, TN 37075
|
2,709 sq. feet
|
2 baths - beds |
show details | |

|
#16
Bay Dr
Hendersonville, TN 37075
|
1,506 sq. feet
|
2 baths - beds |
show details | |

|
#17
Shoreside Dr
Hendersonville, TN 37075
|
3,132 sq. feet
|
2 baths - beds |
show details | |

|
#18
Robinhood Cir
Hendersonville, TN 37075
|
1,188 sq. feet
|
1 baths - beds |
show details | |

|
#19
Raindrop Ln # A
Hendersonville, TN 37075
|
1,620 sq. feet
|
2 baths - beds |
show details | |

|
#20
Herons Nest Ln
Hendersonville, TN 37075
|
3,061 sq. feet
|
2 baths - beds |
show details |
| Photo | Address | Area | Beds / Baths | Price | Details |
|---|---|---|---|---|---|

|
#21
Brookside Ct
Hendersonville, TN 37075
|
1,084 sq. feet
|
1 baths - beds |
show details | |

|
#22
Sandy Valley Rd
Hendersonville, TN 37075
|
1,440 sq. feet
|
1 baths - beds |
show details | |

|
#23
Valley View Ct
Hendersonville, TN 37075
|
1,234 sq. feet
|
2 baths - beds |
show details | |

|
#24
Country Hills Dr
Hendersonville, TN 37075
|
3,180 sq. feet
|
3 baths - beds |
show details | |

|
#25
Cumberland Hills Dr
Hendersonville, TN 37075
|
2,920 sq. feet
|
2 baths - beds |
show details | |

|
#26
Walton Ferry Rd Apt 102
Hendersonville, TN 37075
|
1,064 sq. feet
|
1 baths - beds |
show details | |

|
#27
Lake Ridge Dr
Hendersonville, TN 37075
|
2,102 sq. feet
|
3 baths - beds |
show details | |

|
#28
Paradise Dr
Hendersonville, TN 37075
|
2,440 sq. feet
|
3 baths - beds |
show details | |

|
#29
Berrywood Dr
Hendersonville, TN 37075
|
1,368 sq. feet
|
1 baths - beds |
show details | |

|
#30
Harbor Dr
Hendersonville, TN 37075
|
2,998 sq. feet
|
3 baths - beds |
show details |
| Photo | Address | Area | Beds / Baths | Price | Details |
|---|---|---|---|---|---|

|
#31
Creekwood Ln
Hendersonville, TN 37075
|
1,080 sq. feet
|
1 baths - beds |
show details | |

|
#32
Northlake Dr
Hendersonville, TN 37075
|
1,522 sq. feet
|
2 baths - beds |
show details | |

|
#33
Maple Dr
Hendersonville, TN 37075
|
1,732 sq. feet
|
2 baths - beds |
show details | |

|
#34
Keene Vly S
Hendersonville, TN 37075
|
2,405 sq. feet
|
3 baths - beds |
show details | |

|
#35
Moyna Dr
Hendersonville, TN 37075
|
1,100 sq. feet
|
2 baths - beds |
show details | |

|
#36
La Via Dr
Hendersonville, TN 37075
|
1,534 sq. feet
|
1 baths - beds |
show details | |

|
#37
Savo Bay
Hendersonville, TN 37075
|
1,975 sq. feet
|
3 baths - beds |
show details | |

|
#38
Leeward Pt
Hendersonville, TN 37075
|
3,700 sq. feet
|
3 baths - beds |
show details | |

|
#39
Stirlingshire Dr
Hendersonville, TN 37075
|
2,562 sq. feet
|
3 baths - beds |
show details | |

|
#40
Nokes Dr
Hendersonville, TN 37075
|
2,004 sq. feet
|
1 baths - beds |
show details |
| Photo | Address | Area | Beds / Baths | Price | Details |
|---|---|---|---|---|---|

|
#41
Devonshire Trl
Hendersonville, TN 37075
|
3,081 sq. feet
|
2 baths - beds |
show details | |

|
#42
Peartree Dr
Hendersonville, TN 37075
|
1,166 sq. feet
|
2 baths - beds |
show details | |

|
#43
Fulman Rd
Hendersonville, TN 37075
|
2,532 sq. feet
|
3 baths - beds |
show details | |

|
#44
Monthaven Park Pl
Hendersonville, TN 37075
|
- sq. feet
|
- baths - beds |
show details | |

|
#45
Hazelwood Dr Apt B6
Hendersonville, TN 37075
|
- sq. feet
|
- baths - beds |
show details | |

|
#46
Hickory Heights Dr Apt 35d
Hendersonville, TN 37075
|
- sq. feet
|
- baths - beds |
show details | |

|
#47
Williamsburg Dr Apt 310
Hendersonville, TN 37075
|
- sq. feet
|
- baths - beds |
show details | |

|
#48
Lakeside Park Dr
Hendersonville, TN 37075
|
- sq. feet
|
- baths - beds |
show details | |

|
#49
Tiffany Ln
Hendersonville, TN 37075
|
- sq. feet
|
- baths - beds |
show details | |

|
Check over 1 million property listings on Foreclosure.com!
|
browse all offers | |||


- 52,01881.6%White alone
- 5,6408.8%Black alone
- 3,6315.7%Hispanic
- 1,0991.7%Asian alone
- 1,0101.6%Two or more races
- 480.08%Other race alone
- 270.04%American Indian alone
- 260.04%Native Hawaiian and Other
Pacific Islander alone
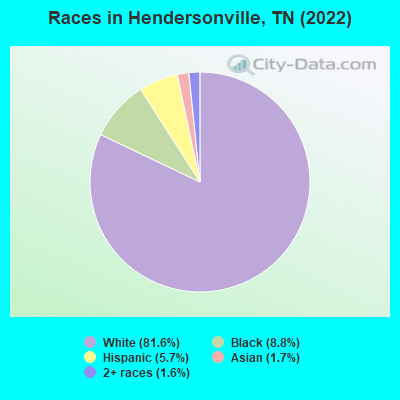
Races in Hendersonville detailed stats: ancestries, foreign born residents, place of birth
According to our research of Tennessee and other state lists, there were 38 registered sex offenders living in Hendersonville, Tennessee as of April 27, 2024.
The ratio of all residents to sex offenders in Hendersonville is 1,472 to 1.
The ratio of registered sex offenders to all residents in this city is much lower than the state average.
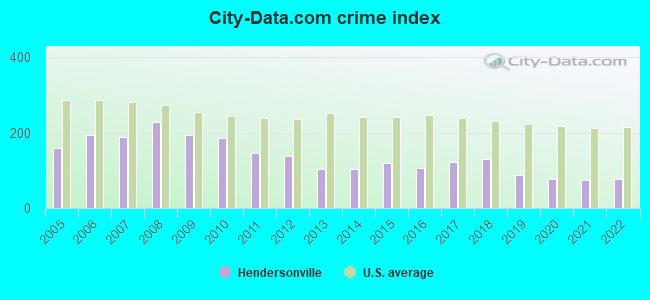
The City-Data.com crime index weighs serious crimes and violent crimes more heavily. Higher means more crime, U.S. average is 246.1. It adjusts for the number of visitors and daily workers commuting into cities.
- means the value is smaller than the state average.- means the value is about the same as the state average.
Crime rate in Hendersonville detailed stats: murders, rapes, robberies, assaults, burglaries, thefts, arson
Full-time law enforcement employees in 2021, including police officers: 151 (135 officers - 123 male; 12 female).
| Officers per 1,000 residents here: | 2.24 |
| Tennessee average: | 2.57 |
 Recent articles from our blog. Our writers, many of them Ph.D. graduates or candidates, create easy-to-read articles on a wide variety of topics.

 | Mount Juliet versus Hendersonville (95 replies) |
| Hendersonville VS Mount Juliet and surrounding areas??? (16 replies) |
| Hendersonville, TN for young kids/schools? (5 replies) |
| Hendersonville feels like SUBURBIA- need recommendations on local feel (12 replies) |
| La Vergne, Hermitage, Hendersonville and Smyrna (1 reply) |
| Hendersonville - White house utility (6 replies) |
Latest news from Hendersonville, TN collected exclusively by city-data.com from local newspapers, TV, and radio stations
Hendersonville, TN City Guides:
Ancestries: American (19.1%), English (17.3%), German (7.3%), Irish (6.6%), European (4.8%), Scottish (2.2%).
Current Local Time: CST time zone
Incorporated in 1901
Elevation: 459 feet
Land area: 27.3 square miles.
Population density: 2,302 people per square mile (low).
3,080 residents are foreign born (2.3% Latin America, 1.3% Asia, 0.8% Europe).
| This city: | 4.8% |
| Tennessee: | 5.4% |
Median real estate property taxes paid for housing units with mortgages in 2022: $2,434 (0.6%)
Median real estate property taxes paid for housing units with no mortgage in 2022: $2,449 (0.5%)
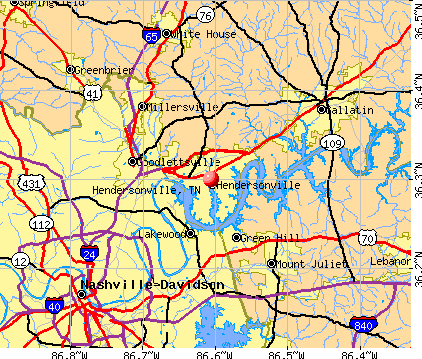
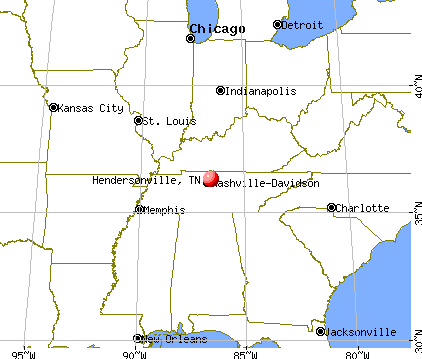
Nearest city with pop. 50,000+: Nashville-Davidson, TN  (13.3 miles , pop. 545,524).
Nearest city with pop. 1,000,000+: Chicago, IL (387.5 miles , pop. 2,896,016).
Nearest cities:
), ), ), ), )Latitude: 36.30 N, Longitude: 86.61 W
Daytime population change due to commuting: -6,538 (-10.3%)
Workers who live and work in this city: 15,573 (46.2%)
Area code: 615
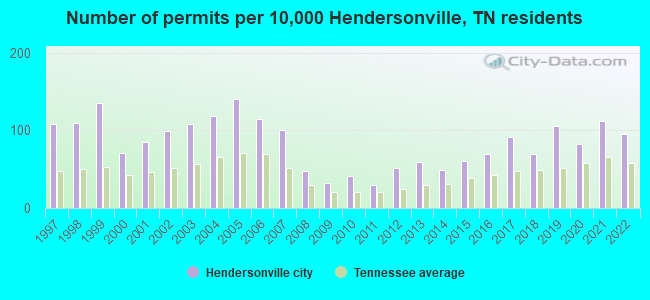
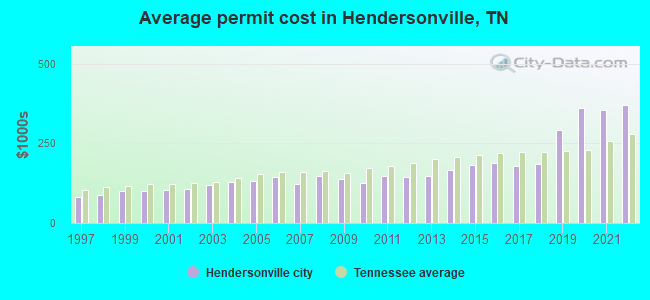
Single-family new house construction building permits:
- 2022: 384 buildings, average cost: $371,400
- 2021: 454 buildings, average cost: $354,000
- 2020: 335 buildings, average cost: $361,400
- 2019: 432 buildings, average cost: $292,500
- 2018: 282 buildings, average cost: $187,100
- 2017: 370 buildings, average cost: $177,600
- 2016: 279 buildings, average cost: $188,200
- 2015: 246 buildings, average cost: $183,200
- 2014: 198 buildings, average cost: $165,600
- 2013: 240 buildings, average cost: $148,500
- 2012: 206 buildings, average cost: $145,800
- 2011: 121 buildings, average cost: $147,200
- 2010: 166 buildings, average cost: $124,600
- 2009: 132 buildings, average cost: $137,900
- 2008: 197 buildings, average cost: $147,300
- 2007: 406 buildings, average cost: $124,000
- 2006: 464 buildings, average cost: $143,600
- 2005: 568 buildings, average cost: $130,900
- 2004: 479 buildings, average cost: $129,700
- 2003: 439 buildings, average cost: $119,100
- 2002: 403 buildings, average cost: $108,300
- 2001: 345 buildings, average cost: $105,300
- 2000: 290 buildings, average cost: $100,900
- 1999: 549 buildings, average cost: $100,900
- 1998: 442 buildings, average cost: $87,100
- 1997: 439 buildings, average cost: $81,800
| Here: | 2.2% |
| Tennessee: | 3.0% |
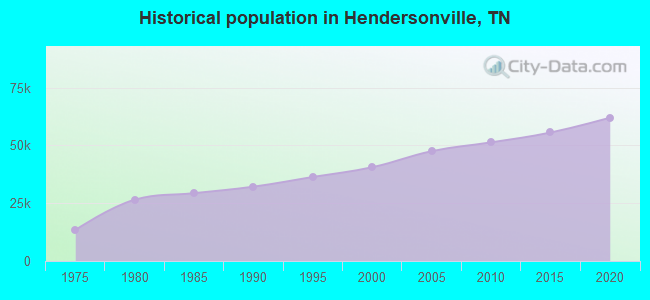
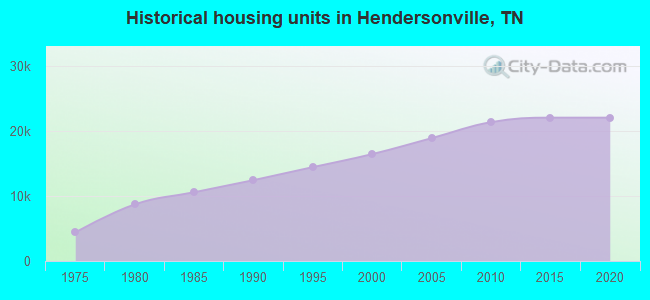
Population change in the 1990s: +7,816 (+23.8%).
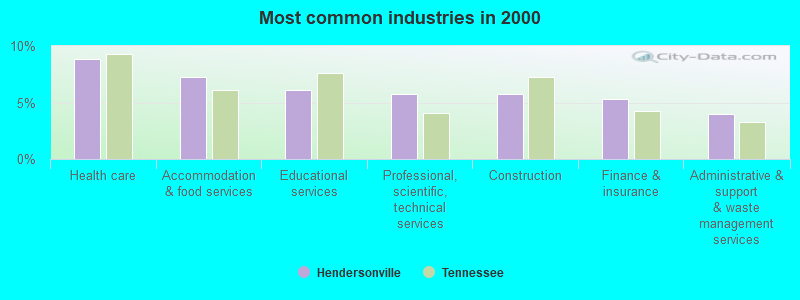
- Health care (8.8%)
- Accommodation & food services (7.2%)
- Educational services (6.1%)
- Professional, scientific, technical services (5.8%)
- Construction (5.7%)
- Finance & insurance (5.3%)
- Administrative & support & waste management services (4.0%)
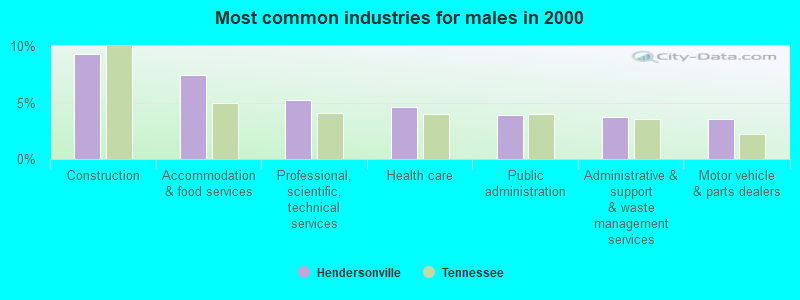
- Construction (9.3%)
- Accommodation & food services (7.4%)
- Professional, scientific, technical services (5.2%)
- Health care (4.6%)
- Public administration (3.9%)
- Administrative & support & waste management services (3.7%)
- Motor vehicle & parts dealers (3.5%)
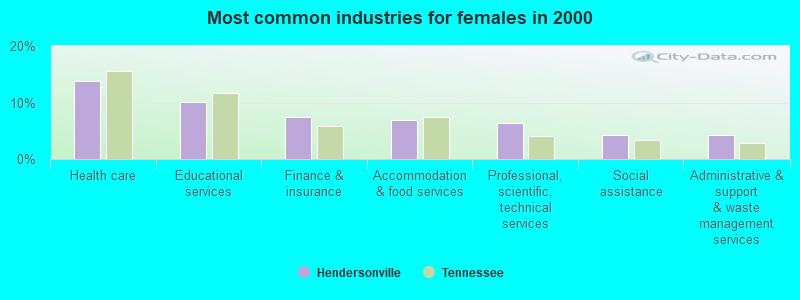
- Health care (13.7%)
- Educational services (10.1%)
- Finance & insurance (7.5%)
- Accommodation & food services (7.0%)
- Professional, scientific, technical services (6.4%)
- Social assistance (4.3%)
- Administrative & support & waste management services (4.3%)
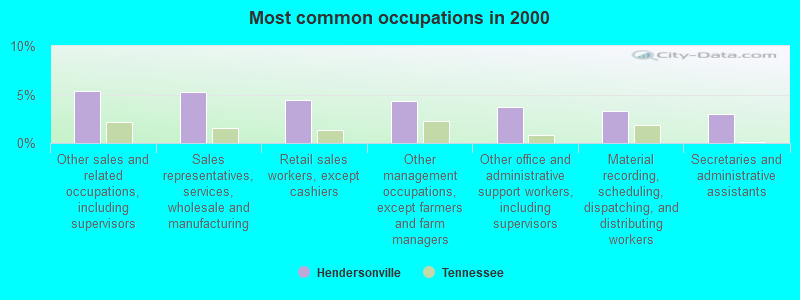
- Other sales and related occupations, including supervisors (5.4%)
- Sales representatives, services, wholesale and manufacturing (5.3%)
- Retail sales workers, except cashiers (4.4%)
- Other management occupations, except farmers and farm managers (4.3%)
- Other office and administrative support workers, including supervisors (3.7%)
- Material recording, scheduling, dispatching, and distributing workers (3.3%)
- Secretaries and administrative assistants (3.0%)
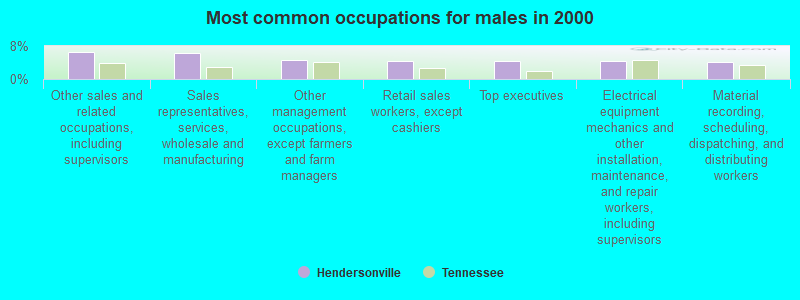
- Other sales and related occupations, including supervisors (6.5%)
- Sales representatives, services, wholesale and manufacturing (6.4%)
- Other management occupations, except farmers and farm managers (4.7%)
- Retail sales workers, except cashiers (4.4%)
- Top executives (4.3%)
- Electrical equipment mechanics and other installation, maintenance, and repair workers, including supervisors (4.3%)
- Material recording, scheduling, dispatching, and distributing workers (4.2%)
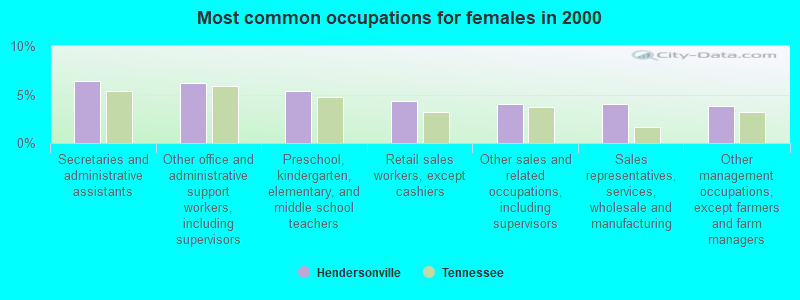
- Secretaries and administrative assistants (6.4%)
- Other office and administrative support workers, including supervisors (6.2%)
- Preschool, kindergarten, elementary, and middle school teachers (5.3%)
- Retail sales workers, except cashiers (4.4%)
- Other sales and related occupations, including supervisors (4.1%)
- Sales representatives, services, wholesale and manufacturing (4.0%)
- Other management occupations, except farmers and farm managers (3.8%)
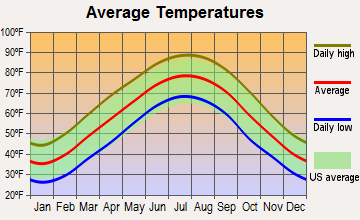
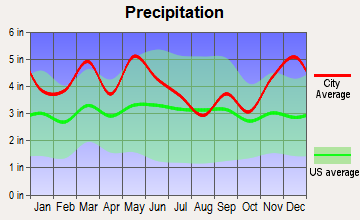
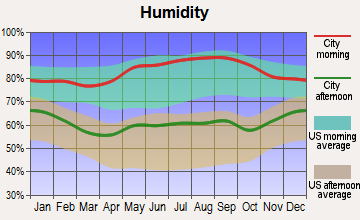
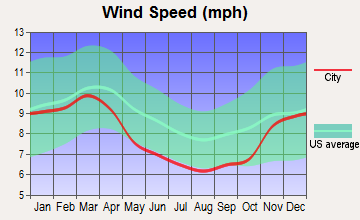
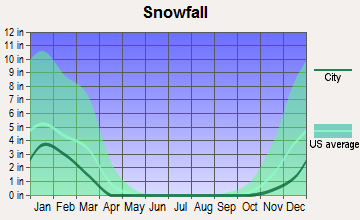
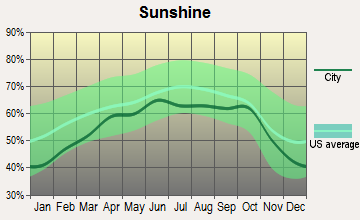
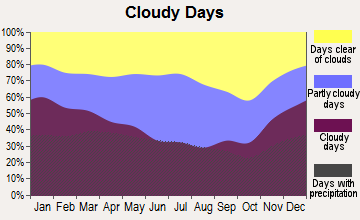
Average climate in Hendersonville, Tennessee
Based on data reported by over 4,000 weather stations
|
|

(lower is better)
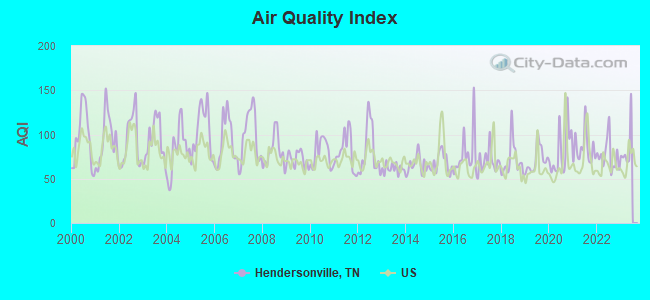
Air Quality Index (AQI) level in 2022 was 76.0. This is about average.
| City: | 76.0 |
| U.S.: | 72.6 |
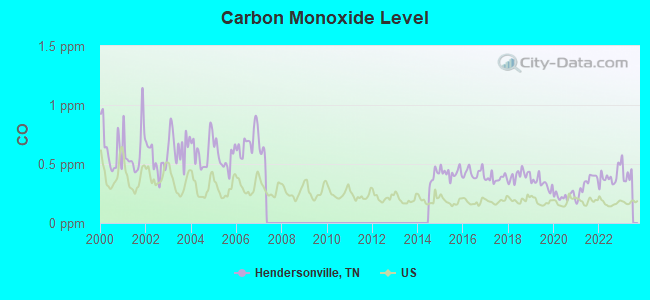
Carbon Monoxide (CO) [ppm] level in 2022 was 0.390. This is significantly worse than average. Closest monitor was 10.1 miles away from the city center.
| City: | 0.390 |
| U.S.: | 0.251 |
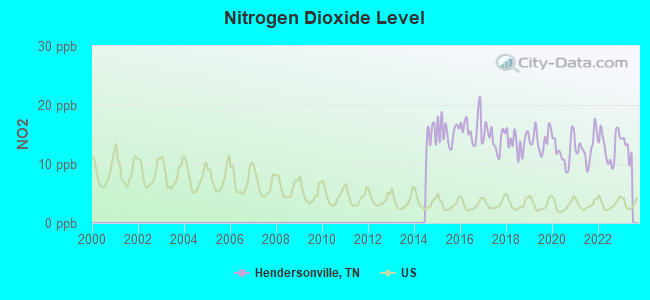
Nitrogen Dioxide (NO2) [ppb] level in 2022 was 13.0. This is significantly worse than average. Closest monitor was 2.6 miles away from the city center.
| City: | 13.0 |
| U.S.: | 5.1 |
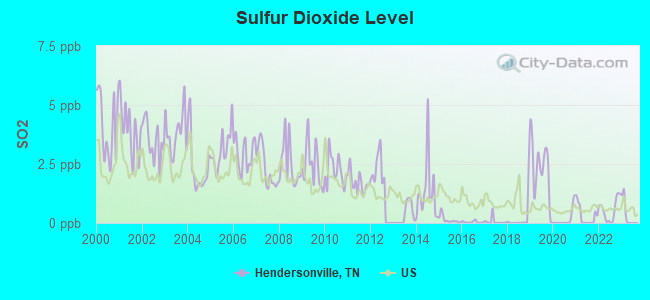
Sulfur Dioxide (SO2) [ppb] level in 2022 was 0.553. This is significantly better than average. Closest monitor was 2.6 miles away from the city center.
| City: | 0.553 |
| U.S.: | 1.515 |
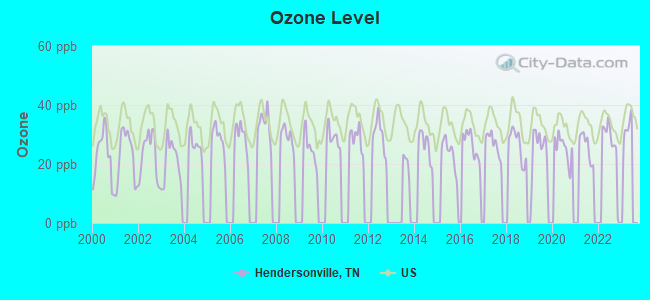
Ozone [ppb] level in 2022 was 26.8. This is better than average. Closest monitor was 10.1 miles away from the city center.
| City: | 26.8 |
| U.S.: | 33.3 |
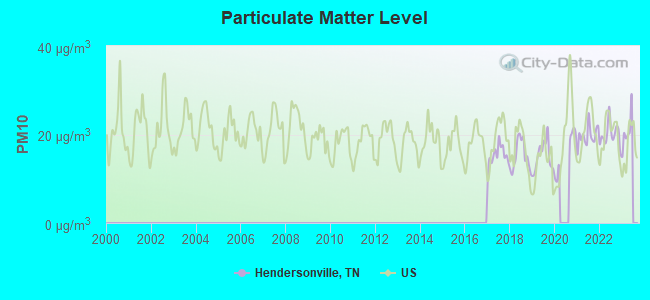
Particulate Matter (PM10) [µg/m3] level in 2022 was 20.0. This is about average. Closest monitor was 10.1 miles away from the city center.
| City: | 20.0 |
| U.S.: | 19.2 |
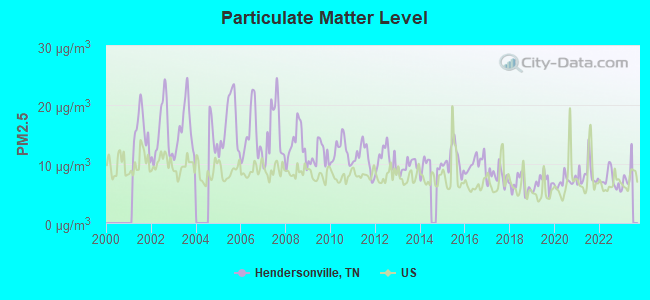
Particulate Matter (PM2.5) [µg/m3] level in 2022 was 7.25. This is about average. Closest monitor was 2.6 miles away from the city center.
| City: | 7.25 |
| U.S.: | 8.11 |
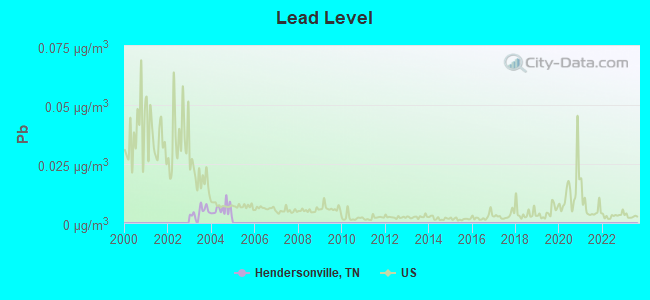
Lead (Pb) [µg/m3] level in 2004 was 0.00577. This is significantly better than average. Closest monitor was 5.3 miles away from the city center.
| City: | 0.00577 |
| U.S.: | 0.00931 |
Tornado activity:
Hendersonville-area historical tornado activity is slightly above Tennessee state average. It is 67% greater than the overall U.S. average.
On 12/24/1988, a category F4 (max. wind speeds 207-260 mph) tornado 21.1 miles away from the Hendersonville city center killed one person and injured 7 people and caused between $5,000,000 and $50,000,000 in damages.
On 4/27/1970, a category F4 tornado 21.7 miles away from the city center killed 3 people and injured 85 people and caused between $500,000 and $5,000,000 in damages.
Earthquake activity:
Hendersonville-area historical earthquake activity is significantly above Tennessee state average. It is 187% greater than the overall U.S. average.On 4/18/2008 at 09:36:59, a magnitude 5.4 (5.1 MB, 4.8 MS, 5.4 MW, 5.2 MW, Class: Moderate, Intensity: VI - VII) earthquake occurred 164.6 miles away from Hendersonville center
On 4/18/2008 at 09:36:59, a magnitude 5.2 (5.2 MW, Depth: 8.9 mi) earthquake occurred 164.6 miles away from Hendersonville center
On 6/18/2002 at 17:37:15, a magnitude 5.0 (4.3 MB, 4.6 MW, 5.0 LG) earthquake occurred 133.4 miles away from Hendersonville center
On 7/27/1980 at 18:52:21, a magnitude 5.2 (5.1 MB, 4.7 MS, 5.0 UK, 5.2 UK) earthquake occurred 197.1 miles away from Hendersonville center
On 4/29/2003 at 08:59:39, a magnitude 4.9 (4.4 MB, 4.6 MW, 4.9 LG, Class: Light, Intensity: IV - V) earthquake occurred 136.5 miles away from Hendersonville center
On 6/10/1987 at 23:48:54, a magnitude 5.1 (4.9 MB, 4.4 MS, 4.6 MS, 5.1 LG) earthquake occurred 187.9 miles away from the city center
Magnitude types: regional Lg-wave magnitude (LG), body-wave magnitude (MB), surface-wave magnitude (MS), moment magnitude (MW)
Natural disasters:
The number of natural disasters in Sumner County (14) is near the US average (15).Major Disasters (Presidential) Declared: 12
Emergencies Declared: 1
Causes of natural disasters: Storms: 11, Floods: 10, Tornadoes: 8, Winds: 3, Flash Flood: 1, Hurricane: 1, Ice Storm: 1, Winter Storm: 1, Other: 1 (Note: some incidents may be assigned to more than one category).

Hospitals and medical centers in Hendersonville:
- TRISTAR HENDERSONVILLE MEDICAL CENTER (Voluntary non-profit - Other, provides emergency services, 355 NEW SHACKLE ISLAND RD)
- HENDERSONVILLE NURSING HOME (672 W MAIN ST)
- NHC HEALTHCARE, HENDERSONVILLE (370 OLD SHACKLE ISLAND RD)
- FMC HENDERSONVILLE (230 NEW SHACKLE ISLAND ROAD)
- NOVA HOME HEALTH SERVICES (146 IMPERIAL BLVD)
Colleges/universities with over 2000 students nearest to Hendersonville:
- Volunteer State Community College (about 8 miles; Gallatin, TN; Full-time enrollment: 5,311)
- Trevecca Nazarene University (about 14 miles; Nashville, TN; FT enrollment: 2,223)
- Tennessee State University (about 16 miles; Nashville, TN; FT enrollment: 7,341)
- Vanderbilt University (about 16 miles; Nashville, TN; FT enrollment: 10,518)
- Belmont University (about 16 miles; Nashville, TN; FT enrollment: 5,795)
- Lipscomb University (about 18 miles; Nashville, TN; FT enrollment: 3,827)
- Nashville State Community College (about 19 miles; Nashville, TN; FT enrollment: 6,436)
Public high schools in Hendersonville:
- HENDERSONVILLE HIGH SCHOOL (Students: 1,445, Location: 123 CHEROKEE RD, Grades: 9-12)
- BEECH SR HIGH SCHOOL (Students: 1,216, Location: 3126 LONG HOLLOW PK, Grades: 9-12)
- MERROL HYDE MAGNET SCHOOL (Students: 588, Location: 128 TOWNSHIP DR, Grades: KG-12)
Private high schools in Hendersonville:
Biggest public elementary/middle schools in Hendersonville:
- JACK ANDERSON ELEMENTARY (Students: 925, Location: 250 SHUTES LA, Grades: PK-5)
- T. W. HUNTER MIDDLE SCHOOL (Students: 887, Location: 2101 NEW HOPE RD, Grades: 6-8)
- INDIAN LAKE ELEMENTARY (Students: 578, Location: 505 INDIAN LAKE RD, Grades: KG-5)
- V G HAWKINS MIDDLE SCHOOL (Students: 566, Location: 487 A. WALTON FERRY RD, Grades: 6-8)
- ROBERT E ELLIS MIDDLE (Students: 534, Location: 100 INDIAN LAKE RD, Grades: 6-8)
- BEECH ELEMENTARY (Students: 530, Location: 3120 LONG HOLLOW PK, Grades: PK-5)
- GENE W. BROWN ELEMENTARY (Students: 512, Location: 174 IMPERIAL BL, Grades: KG-5)
- WALTON FERRY ELEMENTARY (Students: 510, Location: 732 WALTON FERRY RD, Grades: KG-5)
- GEORGE A WHITTEN ELEMENTARY (Students: 470, Location: 140 SCOTCH ST, Grades: KG-5)
- NANNIE BERRY ELEMENTARY (Students: 452, Location: 138 INDIAN LAKE RD, Grades: PK-5)
User-submitted facts and corrections:
- Beech Senior High School (Students: 1479 3126 Long Hollow Pk Grades 09-12)
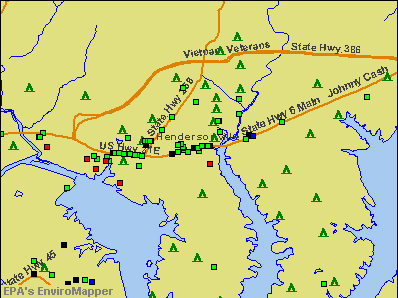
Points of interest:
Notable locations in Hendersonville: Drakes Creek Marina (A), Creekwood Marina (B), Bluegrass Golf and Country Club (C), Blue Grass County Club Dock (D), Anchor High Marina (E), Hendersonville Fire Department Station 5 (F), Hendersonville Fire Department Station 6 (G), Hendersonville Fire Department Station 3 (H), Johnny Cash Museum (I), Rock Castle (J), Hendersonville City Hall (K), Hendersonville Fire Department Station 2 (L), Hendersonville Fire Department Station 1 (M), Hendersonville Fire Department Station 4 (N). Display/hide their locations on the map
Shopping Centers: Walton Mall (1), Watson Mall Shopping Center (2), Sumner County Shopping Center (3), Maple Row Shopping Center (4), Imperial Square Shopping Center (5), Holders Shopping Center (6), Hills Shopping Center (7), City Square Shopping Center (8). Display/hide their locations on the map
Main business address in Hendersonville: SHOLODGE INC (A). Display/hide its location on the map
Churches in Hendersonville include: Stark Knob Church (A), First Assembly of God Church (B), Saint Joseph of Arimathea Episcopal Church (C). Display/hide their locations on the map
Cemeteries: Stark Knob Cemetery (1), Woodlawn Cemetery (2). Display/hide their locations on the map
Lake: Anderson Lake (A). Display/hide its location on the map
Streams, rivers, and creeks: Drakes Creek (A), Center Point Branch (B). Display/hide their locations on the map
Parks in Hendersonville include: Saundersville Access Area (1), Twitty City-Music Village USA (2), Saunders Ferry Park (3), Rockland Recreation Area (4), Hendersonville Park (5), Avondale Access Area (6), Old Lock Three Access Area (7), Stark Knob Access Area (8), Walton Ferry Access Area (9). Display/hide their locations on the map
Tourist attractions: Hendersonville Strike and Spare (Amusement & Theme Parks; 460 West Main Street) (1), Circus World (Amusement & Theme Parks; 460 West Main Street) (2), Rhoades National Corporation (40 Industrial Park Drive Suite D) (3). Display/hide their approximate locations on the map
Hotels: Amerisuites (330 East Main Street) (1), Intown Suites Hendersonville (1017 West Main Street) (2), Four Seasons Auto Sales (118 Old Shackle Island R) (3), Hendersonville Inn (179 West Main Street) (4), Canfield Inn (179 West Main Street) (5), Amerisuites Nashville Hendersonville (330 E Main St) (6). Display/hide their approximate locations on the map
Birthplace of: Jeff Jarrett - Professional wrestler, Tommy Rich - Professional wrestler, John Baptist Morris - Catholic bishop, Andy Wicke - College basketball player (Belmont Bruins), Carl Hinkle - Football player, Chambers Stevens - Actor and author, Chandler Knox - College basketball player (Middle Tenn. St. Blue Raiders), John Jenkins (basketball) - NBA player.
Drinking water stations with addresses in Hendersonville and their reported violations in the past:
HENDERSONVILLE U D (Population served: 49,144, Surface water):Past monitoring violations:
- Record Keeping - In JUL-23-2008, Contaminant: IESWTR. Follow-up actions: St Violation/Reminder Notice (AUG-25-2008), St Public Notif requested (AUG-25-2008), St Compliance achieved (JUL-24-2011)
- Monitoring, Repeat Major (TCR) - In NOV-2006, Contaminant: Coliform (TCR). Follow-up actions: St Compliance achieved (DEC-31-2006), St Public Notif requested (JUL-26-2007), St Violation/Reminder Notice (JUL-26-2007)
- Monitoring, Repeat Major (TCR) - In SEP-2006, Contaminant: Coliform (TCR). Follow-up actions: St Compliance achieved (OCT-31-2006), St Violation/Reminder Notice (JUL-26-2007), St Public Notif received (JUL-26-2007), St Public Notif requested (JUL-26-2007), St Compliance achieved (JUL-26-2007), St Public Notif received (JUL-15-2008)
- Monitoring, Repeat Major (TCR) - In APR-2006, Contaminant: Coliform (TCR). Follow-up actions: St Violation/Reminder Notice (JUL-26-2007), St Public Notif requested (JUL-26-2007)
Drinking water stations with addresses in Hendersonville that have no violations reported:
- POW WOW POINT CAMP (Serves IN, Population served: 40, Primary Water Source Type: Groundwater)
| This city: | 2.5 people |
| Tennessee: | 2.5 people |
| This city: | 70.8% |
| Whole state: | 67.3% |
| This city: | 5.0% |
| Whole state: | 5.8% |
Likely homosexual households (counted as self-reported same-sex unmarried-partner households)
- Lesbian couples: 0.4% of all households
- Gay men: 0.2% of all households
People in group quarters in Hendersonville in 2010:
- 128 people in nursing facilities/skilled-nursing facilities
- 9 people in group homes intended for adults
- 2 people in workers' group living quarters and job corps centers
People in group quarters in Hendersonville in 2000:
- 219 people in nursing homes
- 5 people in wards in general hospitals for patients who have no usual home elsewhere
- 5 people in other workers' dormitories
Banks with most branches in Hendersonville (2011 data):
- First State Bank: Hendersonville Branch at 291 East Main Street, branch established on 2004/12/13; Hendersonville Ii Branch at 1040 Glenbrook Way, branch established on 2006/03/21. Info updated 2006/11/03: Bank assets: $1,646.2 mil, Deposits: $1,393.0 mil, headquarters in Union City, TN, positive income, Commercial Lending Specialization, 32 total offices, Holding Company: Community First Bancshares, Inc.
- First Tennessee Bank, National Association: Indian Lake Branch at 216 Indian Lake Blvd., branch established on 2006/06/30; Hendersonville Branch at 429 West Main Street, branch established on 1977/11/15. Info updated 2009/09/08: Bank assets: $24,563.4 mil, Deposits: $16,402.1 mil, headquarters in Memphis, TN, positive income, Commercial Lending Specialization, 180 total offices, Holding Company: First Horizon National Corporation
- SunTrust Bank: Hendersonville Branch at 443 West Main Street, branch established on 1989/06/12; Indian Lake Branch - 841 at 221 East Main Street, branch established on 2001/02/20. Info updated 2010/05/27: Bank assets: $171,291.7 mil, Deposits: $129,833.2 mil, headquarters in Atlanta, GA, positive income, Commercial Lending Specialization, 1716 total offices, Holding Company: Suntrust Banks, Inc.
- Volunteer State Bank: East Main Street Branch at 323 East Main Street, branch established on 2010/03/29; New Shackle Island Branch at 530 New Shackle Island Road, branch established on 2007/01/04. Info updated 2006/11/03: Bank assets: $383.7 mil, Deposits: $311.8 mil, headquarters in Portland, TN, positive income, Commercial Lending Specialization, 9 total offices, Holding Company: Volunteer State Bancshares, Inc.
- Fifth Third Bank: Hendersonville Veterans Branch at 1044 Glenbrook Way, branch established on 2004/11/22; Hendersonville- Callender Lane Banki at 380 East Main Street, branch established on 2004/05/10. Info updated 2009/10/05: Bank assets: $114,540.4 mil, Deposits: $89,689.1 mil, headquarters in Cincinnati, OH, positive income, Commercial Lending Specialization, 1378 total offices, Holding Company: Fifth Third Bancorp
- Regions Bank: Hendersonville Branch at 249 East Main Street, branch established on 1988/04/11; Glenbrook Branch at 1042 Glenbrook Way, branch established on 2004/09/20. Info updated 2011/02/24: Bank assets: $123,368.2 mil, Deposits: $98,301.3 mil, headquarters in Birmingham, AL, positive income, Commercial Lending Specialization, 1778 total offices, Holding Company: Regions Financial Corporation
- Bank of America, National Association: Hendersonville West at 451 West Main Street, branch established on 1976/07/12; Hendersonville North Branch at 345 East Main Street, branch established on 1991/11/18. Info updated 2009/11/18: Bank assets: $1,451,969.3 mil, Deposits: $1,077,176.8 mil, headquarters in Charlotte, NC, positive income, 5782 total offices, Holding Company: Bank Of America Corporation
- U.S. Bank National Association: Hendersonville Branch at 169 East Main Street, branch established on 1969/01/02; Hendersonville Kroger Branch at 1010 Glenbrook Way, branch established on 2008/05/12. Info updated 2012/01/30: Bank assets: $330,470.8 mil, Deposits: $236,091.5 mil, headquarters in Cincinnati, OH, positive income, 3121 total offices, Holding Company: U.S. Bancorp
- Capital Bank, National Association: New Shackle Island Branch at 303 New Shackle Island, branch established on 1997/09/15; Indian Lake Boulevard Branch at 117 Indian Lake Boulevard, branch established on 1997/10/14. Info updated 2011/09/21: Bank assets: $6,448.0 mil, Deposits: $5,135.4 mil, headquarters in Miami, FL, positive income, Commercial Lending Specialization, 152 total offices, Holding Company: North American Financial Holdings, Inc.
- 6 other banks with 6 local branches
For population 15 years and over in Hendersonville:
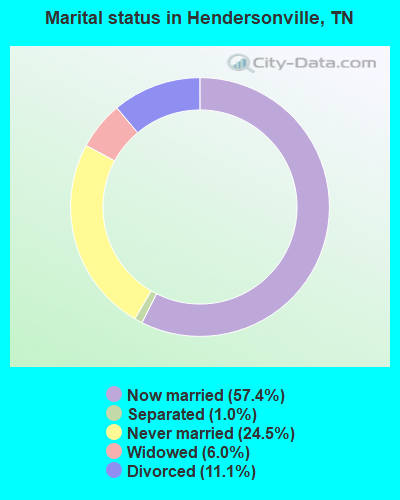
- Never married: 24.5%
- Now married: 57.4%
- Separated: 1.0%
- Widowed: 6.0%
- Divorced: 11.1%
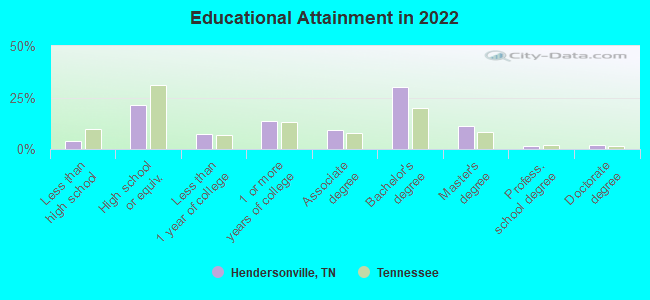
For population 25 years and over in Hendersonville:
- High school or higher: 95.1%
- Bachelor's degree or higher: 41.7%
- Graduate or professional degree: 14.0%
- Unemployed: 3.6%
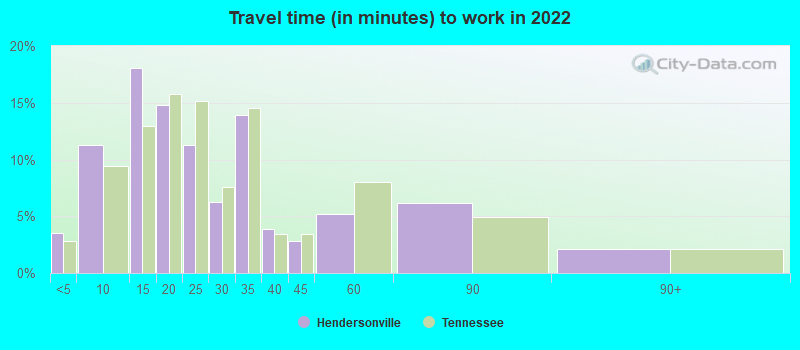
- Mean travel time to work (commute): 21.9 minutes
| Here: | 9.3 |
| Tennessee average: | 11.4 |
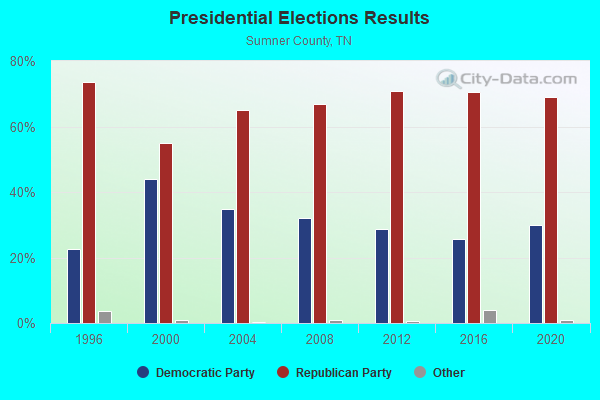
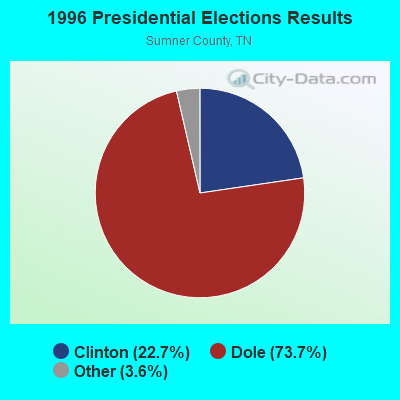
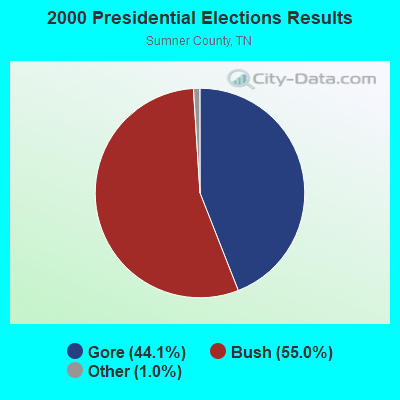
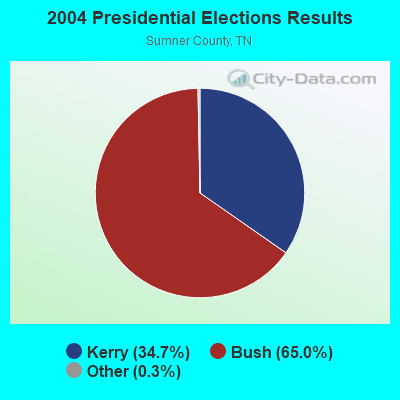
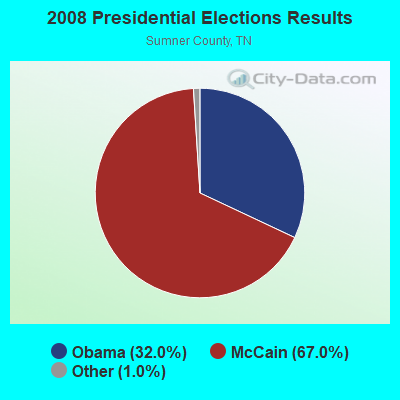

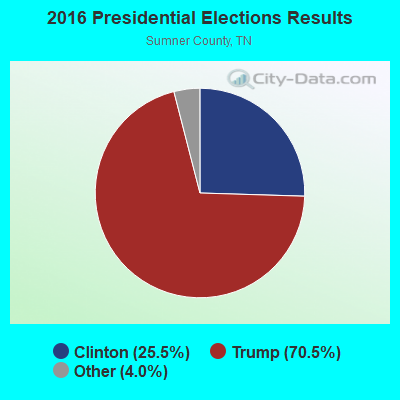
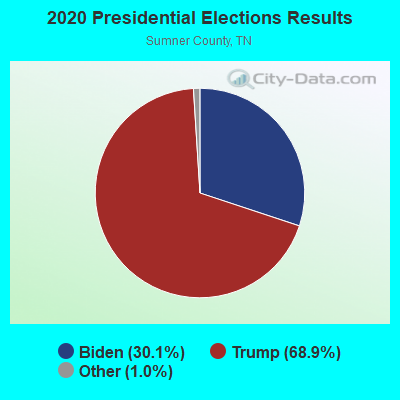
Graphs represent county-level data. Detailed 2008 Election Results
Political contributions by individuals in Hendersonville, TN
Religion statistics for Hendersonville, TN (based on Sumner County data)
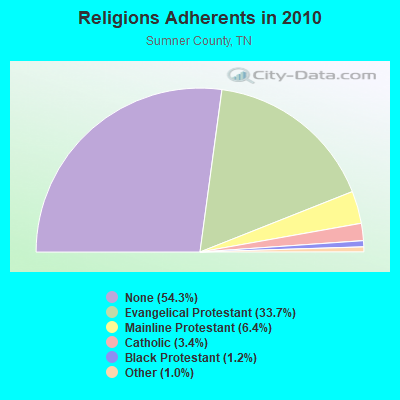
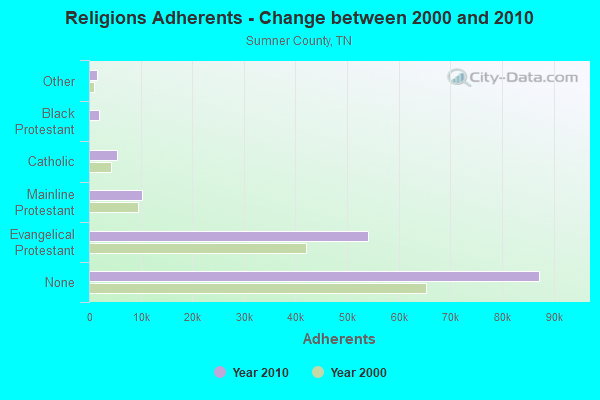
| Religion | Adherents | Congregations |
|---|---|---|
| Evangelical Protestant | 54,140 | 135 |
| Mainline Protestant | 10,205 | 27 |
| Catholic | 5,500 | 2 |
| Black Protestant | 1,961 | 9 |
| Other | 1,579 | 6 |
| None | 87,260 | - |
Food Environment Statistics:
| This county: | 1.77 / 10,000 pop. |
| Tennessee: | 1.99 / 10,000 pop. |
| Here: | 0.07 / 10,000 pop. |
| Tennessee: | 0.17 / 10,000 pop. |
| Sumner County: | 0.39 / 10,000 pop. |
| Tennessee: | 0.65 / 10,000 pop. |
| Sumner County: | 4.26 / 10,000 pop. |
| Tennessee: | 5.16 / 10,000 pop. |
| Sumner County: | 5.64 / 10,000 pop. |
| State: | 6.56 / 10,000 pop. |
| Here: | 12.1% |
| State: | 11.4% |
| Here: | 28.2% |
| Tennessee: | 30.2% |
| Sumner County: | 16.7% |
| Tennessee: | 13.5% |
Health and Nutrition:
| Here: | 51.3% |
| Tennessee: | 49.3% |
| This city: | 49.5% |
| Tennessee: | 46.1% |
| Here: | 28.6 |
| Tennessee: | 28.8 |
| Here: | 21.4% |
| Tennessee: | 21.0% |
| Hendersonville: | 9.6% |
| Tennessee: | 10.5% |
| Hendersonville: | 6.8 |
| Tennessee: | 6.8 |
| This city: | 34.6% |
| State: | 33.9% |
| Hendersonville: | 58.5% |
| Tennessee: | 55.9% |
| This city: | 79.6% |
| Tennessee: | 79.1% |
More about Health and Nutrition of Hendersonville, TN Residents
| Local government employment and payroll (March 2022) | |||||
| Function | Full-time employees | Monthly full-time payroll | Average yearly full-time wage | Part-time employees | Monthly part-time payroll |
|---|---|---|---|---|---|
| Firefighters | 109 | $593,424 | $65,331 | 0 | $0 |
| Police Protection - Officers | 93 | $684,304 | $88,297 | 0 | $0 |
| Streets and Highways | 29 | $144,832 | $59,930 | 1 | $1,687 |
| Parks and Recreation | 21 | $90,719 | $51,839 | 13 | $14,965 |
| Other Government Administration | 19 | $65,460 | $41,343 | 1 | $908 |
| Police - Other | 14 | $68,933 | $59,085 | 10 | $14,655 |
| Fire - Other | 11 | $37,530 | $40,942 | 0 | $0 |
| Financial Administration | 10 | $54,629 | $65,555 | 1 | $624 |
| Other and Unallocable | 10 | $48,566 | $58,279 | 1 | $1,143 |
| Housing and Community Development (Local) | 8 | $45,767 | $68,651 | 2 | $1,551 |
| Judicial and Legal | 4 | $22,607 | $67,821 | 0 | $0 |
| Totals for Government | 328 | $1,856,770 | $67,931 | 29 | $35,534 |
Hendersonville government finances - Expenditure in 2021 (per resident):
- Construction - Local Fire Protection: $1,674,000 ($26.62)
Parks and Recreation: $983,000 ($15.63)
Regular Highways: $573,000 ($9.11)
Public Welfare Institutions: $425,000 ($6.76)
Police Protection: $189,000 ($3.00)
Housing and Community Development: $177,000 ($2.81)
- Current Operations - Police Protection: $13,442,000 ($213.72)
Local Fire Protection: $10,554,000 ($167.80)
Solid Waste Management: $6,268,000 ($99.66)
Regular Highways: $5,586,000 ($88.81)
Central Staff Services: $3,625,000 ($57.63)
General - Other: $2,520,000 ($40.07)
Parks and Recreation: $2,324,000 ($36.95)
Financial Administration: $1,118,000 ($17.78)
Sewerage: $1,096,000 ($17.43)
Protective Inspection and Regulation - Other: $773,000 ($12.29)
Judicial and Legal Services: $461,000 ($7.33)
Public Welfare - Other: $148,000 ($2.35)
Libraries: $51,000 ($0.81)
Housing and Community Development: $20,000 ($0.32)
Health - Other: $12,000 ($0.19)
- General - Interest on Debt: $373,000 ($5.93)
- Other Capital Outlay - Parks and Recreation: $575,000 ($9.14)
Police Protection: $504,000 ($8.01)
Regular Highways: $154,000 ($2.45)
Sewerage: $108,000 ($1.72)
Local Fire Protection: $107,000 ($1.70)
Protective Inspection and Regulation - Other: $26,000 ($0.41)
- Total Salaries and Wages: $22,644,000 ($360.02)
Hendersonville government finances - Revenue in 2021 (per resident):
- Charges - Solid Waste Management: $5,551,000 ($88.26)
Sewerage: $2,553,000 ($40.59)
Parks and Recreation: $382,000 ($6.07)
- Federal Intergovernmental - Public Welfare: $425,000 ($6.76)
- Local Intergovernmental - General Local Government Support: $42,000 ($0.67)
- Miscellaneous - General Revenue - Other: $2,402,000 ($38.19)
Donations From Private Sources: $614,000 ($9.76)
Fines and Forfeits: $386,000 ($6.14)
Interest Earnings: $28,000 ($0.45)
Sale of Property: $6,000 ($0.10)
- State Intergovernmental - General Local Government Support: $7,279,000 ($115.73)
Highways: $2,152,000 ($34.22)
Other: $672,000 ($10.68)
Housing and Community Development: $636,000 ($10.11)
Public Welfare: $140,000 ($2.23)
- Tax - General Sales and Gross Receipts: $16,816,000 ($267.36)
Property: $14,282,000 ($227.07)
Alcoholic Beverage Sales: $1,871,000 ($29.75)
Other Selective Sales: $116,000 ($1.84)
Hendersonville government finances - Debt in 2021 (per resident):
- Long Term Debt - Beginning Outstanding - Unspecified Public Purpose: $12,206,000 ($194.07)
Outstanding Unspecified Public Purpose: $10,545,000 ($167.66)
Retired Unspecified Public Purpose: $1,661,000 ($26.41)
Hendersonville government finances - Cash and Securities in 2021 (per resident):
- Other Funds - Cash and Securities: $23,041,000 ($366.33)
| Businesses in Hendersonville, TN | ||||
| Name | Count | Name | Count | |
|---|---|---|---|---|
| ALDI | 1 | Kmart | 1 | |
| AT&T | 1 | Kroger | 2 | |
| Ace Hardware | 1 | La-Z-Boy | 1 | |
| Advance Auto Parts | 1 | Lane Bryant | 1 | |
| Ann Taylor | 1 | Little Caesars Pizza | 1 | |
| Arby's | 1 | Lowe's | 1 | |
| AutoZone | 1 | MasterBrand Cabinets | 2 | |
| Barnes & Noble | 1 | Maurices | 1 | |
| Baskin-Robbins | 1 | McDonald's | 2 | |
| Bath & Body Works | 1 | New Balance | 1 | |
| Blockbuster | 1 | New York & Co | 1 | |
| Buffalo Wild Wings | 1 | Nike | 1 | |
| Burger King | 1 | Office Depot | 1 | |
| CVS | 1 | Panera Bread | 1 | |
| Cache | 1 | Papa John's Pizza | 1 | |
| Chick-Fil-A | 1 | Pizza Hut | 1 | |
| Chico's | 1 | Publix Super Markets | 1 | |
| Coldwater Creek | 1 | Qdoba Mexican Grill | 1 | |
| Cracker Barrel | 1 | RadioShack | 1 | |
| Cricket Wireless | 2 | Red Robin | 1 | |
| Curves | 1 | Rite Aid | 2 | |
| DHL | 1 | SONIC Drive-In | 2 | |
| Dairy Queen | 1 | Shoe Carnival | 1 | |
| Decora Cabinetry | 2 | Sprint Nextel | 1 | |
| Discount Tire | 1 | Staples | 1 | |
| Domino's Pizza | 1 | Starbucks | 2 | |
| FedEx | 8 | Steak 'n Shake | 1 | |
| GNC | 1 | T-Mobile | 2 | |
| GameStop | 1 | Taco Bell | 2 | |
| Gap | 1 | Talbots | 1 | |
| Gymboree | 1 | Target | 1 | |
| H&R Block | 2 | U-Haul | 2 | |
| Holiday Inn | 1 | UPS | 10 | |
| Home Depot | 1 | Verizon Wireless | 1 | |
| Hyundai | 1 | Victoria's Secret | 1 | |
| InTown Suites | 1 | Waffle House | 1 | |
| JoS. A. Bank | 1 | Walgreens | 2 | |
| Justice | 1 | Walmart | 1 | |
| KFC | 1 | Wendy's | 1 | |
| Kincaid | 1 | YMCA | 1 | |
Strongest AM radio stations in Hendersonville:
- WLAC (1510 AM; 50 kW; NASHVILLE, TN; Owner: CAPSTAR TX LIMITED PARTNERSHIP)
- WAMB (1160 AM; 50 kW; DONELSON, TN; Owner: GREAT SOUTHERN BROADCASTING COMPANY, INC.)
- WPLN (1430 AM; 15 kW; MADISON, TN)
- WKDA (1200 AM; 50 kW; NASHVILLE, TN; Owner: RADIO NASHVILLE, INC.)
- WSM (650 AM; 50 kW; NASHVILLE, TN; Owner: GAYLORD ENTERTAINMENT COMPANY)
- WNQM (1300 AM; 50 kW; NASHVILLE, TN; Owner: WNQM. INC.)
- WYFN (980 AM; 5 kW; NASHVILLE, TN; Owner: BIBLE BRADCASTING NETWORK, INC.)
- WCOR (900 AM; 5 kW; LEBANON, TN)
- WHIN (1010 AM; 5 kW; GALLATIN, TN; Owner: WHIN, INC.)
- WVOL (1470 AM; 5 kW; BERRY HILL, TN)
- WYXE (1130 AM; daytime; 2 kW; GALLATIN, TN; Owner: JON GARY ENTERPRISES, INC.)
- WMDB (880 AM; daytime; 2 kW; NASHVILLE, TN; Owner: BABB BROADCASTING COMPANY)
- WMRO (1560 AM; 2 kW; GALLATIN, TN; Owner: CLASSIC BROADCASTING, INC.)
Strongest FM radio stations in Hendersonville:
- WGFX (104.5 FM; GALLATIN, TN; Owner: CITADEL BROADCASTING COMPANY)
- WMAK (96.3 FM; MURFREESBORO, TN; Owner: SOUTH CENTRAL COMMUNICATIONS CORP.)
- WRVW (107.5 FM; LEBANON, TN; Owner: CAPSTAR TX LIMITED PARTNERSHIP)
- WRQQ (97.1 FM; GOODLETTSVILLE, TN; Owner: CUMULUS LICENSING CORP.)
- WNPL (106.7 FM; BELLE MEADE, TN; Owner: CUMULUS LICENSING CORP.)
- WQQK (92.1 FM; HENDERSONVILLE, TN; Owner: PHOENIX OF HENDERSONVILLE, INC.)
- WSM-FM (95.5 FM; NASHVILLE, TN; Owner: CUMULUS LICENSING CORP.)
- WMOT (89.5 FM; MURFREESBORO, TN; Owner: MIDDLE TENNESSEE STATE UNIVERSITY)
- WSIX-FM (97.9 FM; NASHVILLE, TN; Owner: CAPSTAR TX LIMITED PARTNERSHIP)
- WKDF (103.3 FM; NASHVILLE, TN; Owner: CITADEL BROADCASTING COMPANY)
- WNRQ (105.9 FM; NASHVILLE, TN; Owner: CAPSTAR TX LIMITED PARTNERSHIP)
- WPLN-FM (90.3 FM; NASHVILLE, TN; Owner: NASHVILLE PUBLIC RADIO)
- WAYM (88.7 FM; COLUMBIA, TN; Owner: WAY-FM MEDIA GROUP, INC.)
- WJXA (92.9 FM; NASHVILLE, TN; Owner: SOUTH CENTRAL COMMUNICATIONS CORP.)
- WVCP (88.5 FM; GALLATIN, TN; Owner: VOLUNTEER STATE COMMUNITY COLLEGE)
- WRLT (100.1 FM; FRANKLIN, TN; Owner: TUNED-IN BROADCASTING, INC)
- WRVU (91.1 FM; NASHVILLE, TN; Owner: VANDERBILT STUDENT COMMUNICATIONS, INC.)
- W230AD (93.9 FM; GALLATIN, TN; Owner: TREVECCA NAZARENE UNIVERSITY, INC.)
- WFFI (93.7 FM; KINGSTON SPRINGS, TN; Owner: CARON BROADCASTING, INC.)
- W271AB (102.1 FM; NASHVILLE, TN; Owner: MONTGOMERY BROADCASTING COMPANY)
TV broadcast stations around Hendersonville:
- WIIW-LP (Channel 14; NASHVILLE, TN; Owner: EQUITY BROADCASTING CORPORATION)
- WTVF (Channel 5; NASHVILLE, TN; Owner: NEWSCHANNEL 5 NETWORK, LP)
- WNPX (Channel 28; COOKEVILLE, TN; Owner: PAXSON COMMUNICATIONS LICENSE COMPANY, LLC)
- WUXP-TV (Channel 30; NASHVILLE, TN; Owner: WUXP LICENSEE, LLC)
- WPGD (Channel 50; HENDERSONVILLE, TN; Owner: TRINITY BROADCASTING NETWORK)
- WNPX-LP (Channel 20; NASHVILLE, TN; Owner: PAXSON COMMUNICATIONS LPTV, INC.)
- WSMV-TV (Channel 4; NASHVILLE, TN; Owner: MEREDITH CORPORATION)
- WZTV (Channel 17; NASHVILLE, TN; Owner: WZTV LICENSEE, LLC)
- WKRN-TV (Channel 2; NASHVILLE, TN; Owner: WKRN, G.P.)
- W36AK (Channel 36; NASHVILLE, TN; Owner: TRINITY BROADCASTING NETWORK)
- WHTN (Channel 39; MURFREESBORO, TN; Owner: CHRISTIAN TELEVISION NETWORK, INC.)
- WGAP-LP (Channel 26; NASHVILLE, TN; Owner: SOUTH CENTRAL COMMUNICATIONS CORP.)
- WJDE-LP (Channel 24; NASHVILLE, TN; Owner: SOUTH CENTRAL COMMUNICATIONS CORP.)
- WRMX-LP (Channel 12; NASHVILLE, TN; Owner: SOUTH CENTRAL COMMUNICATIONS CORP.)
- WNAB (Channel 58; NASHVILLE, TN; Owner: NASHVILLE LICENSE HOLDINGS, L.L.C.)
- WNPT (Channel 8; NASHVILLE, TN; Owner: NASHVILLE PUBLIC TELEVISION, INC.)
- WJNK-LP (Channel 61; NASHVILLE, TN; Owner: THREE ANGELS BROADCASTING NETWORK, INC.)
- W52CT (Channel 52; NASHVILLE, TN; Owner: JKB ASSOCIATES, INC.)
- WJFB (Channel 66; LEBANON, TN; Owner: BRYANT BROADCASTING, INC.)
- National Bridge Inventory (NBI) Statistics
- 84Number of bridges
- 997ft / 304mTotal length
- $37,159,000Total costs
- 2,045,422Total average daily traffic
- 240,321Total average daily truck traffic
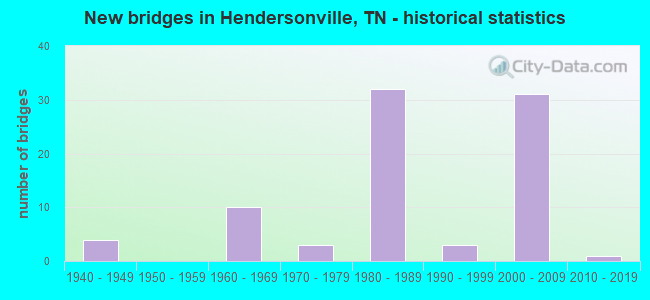
- New bridges - historical statistics
- 41940-1949
- 101960-1969
- 31970-1979
- 321980-1989
- 31990-1999
- 312000-2009
- 12010-2019
FCC Registered Commercial Land Mobile Towers: 2 (See the full list of FCC Registered Commercial Land Mobile Towers in Hendersonville, TN)
FCC Registered Private Land Mobile Towers: 3 (See the full list of FCC Registered Private Land Mobile Towers)
FCC Registered Broadcast Land Mobile Towers: 21 (See the full list of FCC Registered Broadcast Land Mobile Towers)
FCC Registered Microwave Towers: 25 (See the full list of FCC Registered Microwave Towers in this town)
FCC Registered Paging Towers: 1 (See the full list of FCC Registered Paging Towers)
FCC Registered Maritime Coast & Aviation Ground Towers: 1 (See the full list of FCC Registered Maritime Coast & Aviation Ground Towers)
FCC Registered Amateur Radio Licenses: 315 (See the full list of FCC Registered Amateur Radio Licenses in Hendersonville)
FAA Registered Aircraft Manufacturers and Dealers: 4 (See the full list of FAA Registered Manufacturers and Dealers in Hendersonville)
FAA Registered Aircraft: 59 (See the full list of FAA Registered Aircraft)
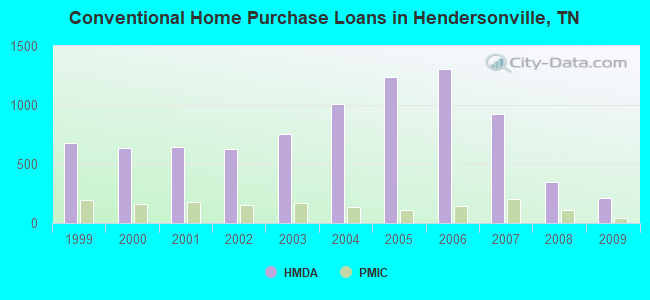
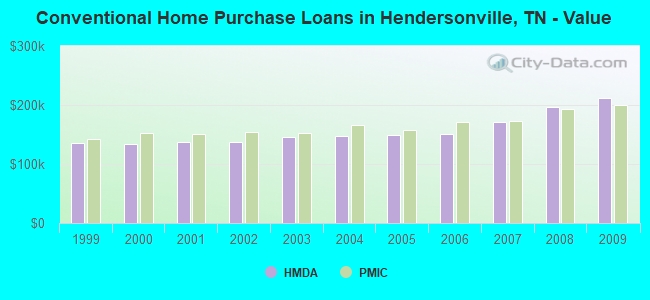
| Home Mortgage Disclosure Act Aggregated Statistics For Year 2009 (Based on 5 full and 3 partial tracts) | ||||||||||||
| A) FHA, FSA/RHS & VA Home Purchase Loans | B) Conventional Home Purchase Loans | C) Refinancings | D) Home Improvement Loans | F) Non-occupant Loans on < 5 Family Dwellings (A B C & D) | G) Loans On Manufactured Home Dwelling (A B C & D) | |||||||
|---|---|---|---|---|---|---|---|---|---|---|---|---|
| Number | Average Value | Number | Average Value | Number | Average Value | Number | Average Value | Number | Average Value | Number | Average Value | |
| LOANS ORIGINATED | 291 | $181,311 | 215 | $211,395 | 1,251 | $187,369 | 35 | $72,946 | 70 | $159,471 | 1 | $48,170 |
| APPLICATIONS APPROVED, NOT ACCEPTED | 9 | $174,200 | 11 | $202,090 | 73 | $171,151 | 2 | $6,600 | 1 | $183,740 | 0 | $0 |
| APPLICATIONS DENIED | 22 | $170,229 | 16 | $168,863 | 323 | $191,848 | 39 | $26,005 | 13 | $180,188 | 2 | $12,000 |
| APPLICATIONS WITHDRAWN | 43 | $173,285 | 39 | $202,250 | 284 | $184,171 | 16 | $65,463 | 12 | $165,511 | 0 | $0 |
| FILES CLOSED FOR INCOMPLETENESS | 1 | $445,470 | 2 | $231,960 | 49 | $179,021 | 1 | $141,350 | 0 | $0 | 0 | $0 |
Detailed HMDA statistics for the following Tracts: 0210.02 , 0210.03, 0211.01, 0211.02, 0211.03, 0212.01, 0212.02, 0212.03
| Private Mortgage Insurance Companies Aggregated Statistics For Year 2009 (Based on 5 full and 3 partial tracts) | ||||||
| A) Conventional Home Purchase Loans | B) Refinancings | C) Non-occupant Loans on < 5 Family Dwellings (A & B) | ||||
|---|---|---|---|---|---|---|
| Number | Average Value | Number | Average Value | Number | Average Value | |
| LOANS ORIGINATED | 44 | $199,739 | 49 | $201,240 | 1 | $108,000 |
| APPLICATIONS APPROVED, NOT ACCEPTED | 5 | $287,292 | 12 | $197,982 | 0 | $0 |
| APPLICATIONS DENIED | 3 | $173,520 | 14 | $209,624 | 4 | $166,225 |
| APPLICATIONS WITHDRAWN | 1 | $133,170 | 5 | $206,802 | 1 | $108,000 |
| FILES CLOSED FOR INCOMPLETENESS | 1 | $239,880 | 0 | $0 | 0 | $0 |
Detailed PMIC statistics for the following Tracts: 0210.02 , 0210.03, 0211.01, 0211.02, 0211.03, 0212.01, 0212.02, 0212.03
2002 - 2018 National Fire Incident Reporting System (NFIRS) incidents
- Fire incident types reported to NFIRS in Hendersonville, TN
- 1,01945.0%Outside Fires
- 70931.3%Structure Fires
- 39017.2%Mobile Property/Vehicle Fires
- 1456.4%Other
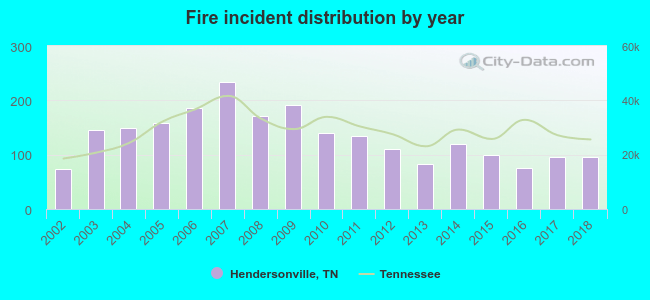 According to the data from the years 2002 - 2018 the average number of fire incidents per year is 133. The highest number of reported fires - 233 took place in 2007, and the least - 74 in 2002. The data has a rising trend.
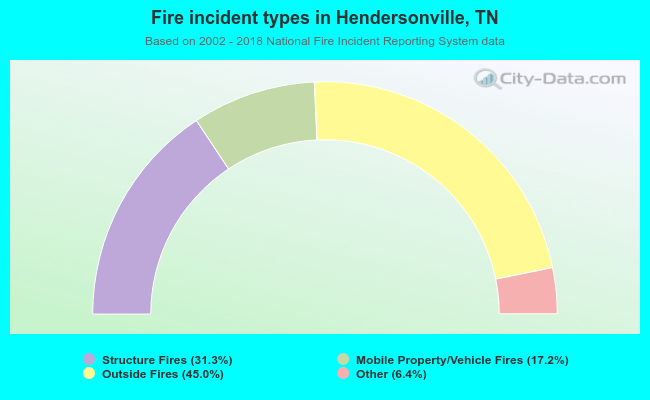 When looking into fire subcategories, the most reports belonged to: Outside Fires (45.0%), and Structure Fires (31.3%).
Fire-safe hotels and motels in Hendersonville, Tennessee:
- Hyatt Place Nashville Northeast, 330 E Main St, Hendersonville, Tennessee 37075 , Phone: (615) 826-4301, Fax: (615) 826-2845
- Intown Suites Nashville North, 1017 W Main St, Hendersonville, Tennessee 37075 , Phone: (615) 826-7798, Fax: (615) 264-0698
- Hampton Inn & Suites Hendersonville, 111 Saundersville Rd, Hendersonville, Tennessee 37075 , Phone: (615) 751-5066, Fax: (615) 751-5067
- Fairfield Inn & Suites, 303 Indian Lake Blvd, Hendersonville, Tennessee 37075 , Phone: (615) 590-8998
| Most common first names in Hendersonville, TN among deceased individuals | ||
| Name | Count | Lived (average) |
|---|---|---|
| James | 223 | 73.5 years |
| Mary | 202 | 80.5 years |
| William | 197 | 73.9 years |
| John | 152 | 74.7 years |
| Robert | 127 | 72.5 years |
| Charles | 115 | 71.7 years |
| Thomas | 81 | 74.6 years |
| Dorothy | 80 | 77.9 years |
| Margaret | 74 | 78.3 years |
| George | 62 | 74.9 years |
| Most common last names in Hendersonville, TN among deceased individuals | ||
| Last name | Count | Lived (average) |
|---|---|---|
| Smith | 89 | 74.9 years |
| Johnson | 64 | 77.8 years |
| Jones | 59 | 73.9 years |
| Taylor | 49 | 75.9 years |
| Williams | 47 | 74.0 years |
| Brown | 44 | 77.3 years |
| Davis | 42 | 72.6 years |
| Anderson | 39 | 76.0 years |
| Miller | 36 | 75.1 years |
| Jackson | 32 | 75.7 years |
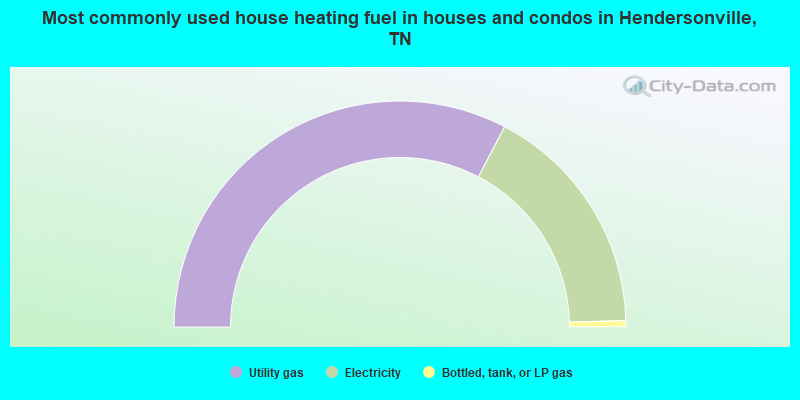
- 65.2%Utility gas
- 33.7%Electricity
- 0.9%Bottled, tank, or LP gas
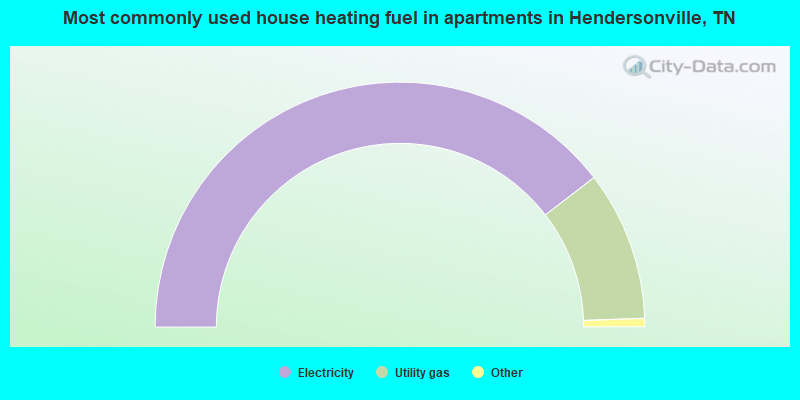
- 79.2%Electricity
- 19.8%Utility gas
- 0.9%No fuel used
- 0.2%Bottled, tank, or LP gas
Hendersonville compared to Tennessee state average:
- Median house value above state average.
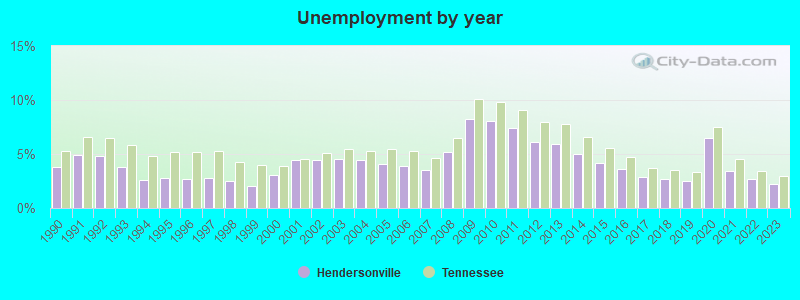
- Unemployed percentage significantly below state average.
- Length of stay since moving in significantly above state average.
- House age below state average.
- Percentage of population with a bachelor's degree or higher above state average.
Hendersonville on our top lists:
- #16 on the list of "Top 100 high-educated but low-earning cities (pop. 50,000+)"
- #30 on the list of "Top 101 cities with the most people below the poverty level, excluding cities with 15% or more of residents in college and with the median age below 28 (population 50,000+)"
- #37 on the list of "Top 101 cities with the most people below 50% of the poverty level, excluding cities with 15% or more of residents in college and with the median age below 28 (population 50,000+)"
- #37 on the list of "Top 101 cities with largest percentage of females in industries: administrative and support and waste management services (population 50,000+)"
- #38 on the list of "Top 101 cities with the lowest number of auto thefts per 100,000 residents (population 50,000+)"
- #38 on the list of "Top 100 safest cities (lowest city-data.com crime index) (pop. 50,000+)"
- #43 on the list of "Top 101 cities with largest percentage of females in occupations: health technologists and technicians (population 50,000+)"
- #45 on the list of "Top 101 cities with the smallest city-data.com crime index per police officer (population 50,000+)"
- #53 on the list of "Top 101 cities with largest percentage of females in industries: real estate and rental and leasing (population 50,000+)"
- #58 on the list of "Top 101 cities with the lowest number of burglaries per 100,000 residents (population 50,000+)"
- #69 on the list of "Top 101 cities with the least people below the poverty level (population 50,000+)"
- #73 on the list of "Top 101 cities with the lowest number of robberies per 100,000 residents (population 50,000+)"
- #77 on the list of "Top 100 cities with biggest houses (pop. 50,000+)"
- #80 on the list of "Top 101 cities that people commute from (largest negative percentage daily daytime population change due to commuting) (population 50,000+)"
- #93 on the list of "Top 101 cities with the lowest city-data.com crime index (population 50,000+)"
- #95 on the list of "Top 101 cities with most building permits per 10,000 residents (population 50,000+)"
- #98 on the list of "Top 101 cities with largest percentage of males in occupations: arts, design, entertainment, sports, and media occupations (population 50,000+)"
- #77 on the list of "Top 101 counties with the largest number of people moving in compared to moving out (pop. 50,000+)"
- #83 on the list of "Top 101 counties with the lowest percentage of residents relocating from foreign countries between 2010 and 2011 (pop. 50,000+)"
- #91 on the list of "Top 101 counties with highest percentage of residents voting for Romney (Republican) in the 2012 Presidential Election (pop. 50,000+)"

|
|
Total of 171 patent applications in 2008-2024.