Gallatin, Tennessee Submit your own pictures of this city and show them to the world
OSM Map
General Map
Google Map
MSN Map
OSM Map
General Map
Google Map
MSN Map
OSM Map
General Map
Google Map
MSN Map
OSM Map
General Map
Google Map
MSN Map
Please wait while loading the map...
Population in 2022: 48,194 (97% urban, 3% rural). Population change since 2000: +107.5%Males: 23,819 Females: 24,375
March 2022 cost of living index in Gallatin: 89.2 (less than average, U.S. average is 100) Percentage of residents living in poverty in 2022: 13.4%for White Non-Hispanic residents , 36.7% for Black residents , 23.7% for Hispanic or Latino residents , 46.0% for American Indian residents , 27.3% for other race residents , 7.7% for two or more races residents )
Profiles of local businesses
Business Search - 14 Million verified businesses
Data:
Median household income ($)
Median household income (% change since 2000)
Household income diversity
Ratio of average income to average house value (%)
Ratio of average income to average rent
Median household income ($) - White
Median household income ($) - Black or African American
Median household income ($) - Asian
Median household income ($) - Hispanic or Latino
Median household income ($) - American Indian and Alaska Native
Median household income ($) - Multirace
Median household income ($) - Other Race
Median household income for houses/condos with a mortgage ($)
Median household income for apartments without a mortgage ($)
Races - White alone (%)
Races - White alone (% change since 2000)
Races - Black alone (%)
Races - Black alone (% change since 2000)
Races - American Indian alone (%)
Races - American Indian alone (% change since 2000)
Races - Asian alone (%)
Races - Asian alone (% change since 2000)
Races - Hispanic (%)
Races - Hispanic (% change since 2000)
Races - Native Hawaiian and Other Pacific Islander alone (%)
Races - Native Hawaiian and Other Pacific Islander alone (% change since 2000)
Races - Two or more races (%)
Races - Two or more races (% change since 2000)
Races - Other race alone (%)
Races - Other race alone (% change since 2000)
Racial diversity
Unemployment (%)
Unemployment (% change since 2000)
Unemployment (%) - White
Unemployment (%) - Black or African American
Unemployment (%) - Asian
Unemployment (%) - Hispanic or Latino
Unemployment (%) - American Indian and Alaska Native
Unemployment (%) - Multirace
Unemployment (%) - Other Race
Population density (people per square mile)
Population - Males (%)
Population - Females (%)
Population - Males (%) - White
Population - Males (%) - Black or African American
Population - Males (%) - Asian
Population - Males (%) - Hispanic or Latino
Population - Males (%) - American Indian and Alaska Native
Population - Males (%) - Multirace
Population - Males (%) - Other Race
Population - Females (%) - White
Population - Females (%) - Black or African American
Population - Females (%) - Asian
Population - Females (%) - Hispanic or Latino
Population - Females (%) - American Indian and Alaska Native
Population - Females (%) - Multirace
Population - Females (%) - Other Race
Coronavirus confirmed cases (Apr 27, 2024)
Deaths caused by coronavirus (Apr 27, 2024)
Coronavirus confirmed cases (per 100k population) (Apr 27, 2024)
Deaths caused by coronavirus (per 100k population) (Apr 27, 2024)
Daily increase in number of cases (Apr 27, 2024)
Weekly increase in number of cases (Apr 27, 2024)
Cases doubled (in days) (Apr 27, 2024)
Hospitalized patients (Apr 18, 2022)
Negative test results (Apr 18, 2022)
Total test results (Apr 18, 2022)
COVID Vaccine doses distributed (per 100k population) (Sep 19, 2023)
COVID Vaccine doses administered (per 100k population) (Sep 19, 2023)
COVID Vaccine doses distributed (Sep 19, 2023)
COVID Vaccine doses administered (Sep 19, 2023)
Likely homosexual households (%)
Likely homosexual households (% change since 2000)
Likely homosexual households - Lesbian couples (%)
Likely homosexual households - Lesbian couples (% change since 2000)
Likely homosexual households - Gay men (%)
Likely homosexual households - Gay men (% change since 2000)
Cost of living index
Median gross rent ($)
Median contract rent ($)
Median monthly housing costs ($)
Median house or condo value ($)
Median house or condo value ($ change since 2000)
Mean house or condo value by units in structure - 1, detached ($)
Mean house or condo value by units in structure - 1, attached ($)
Mean house or condo value by units in structure - 2 ($)
Mean house or condo value by units in structure by units in structure - 3 or 4 ($)
Mean house or condo value by units in structure - 5 or more ($)
Mean house or condo value by units in structure - Boat, RV, van, etc. ($)
Mean house or condo value by units in structure - Mobile home ($)
Median house or condo value ($) - White
Median house or condo value ($) - Black or African American
Median house or condo value ($) - Asian
Median house or condo value ($) - Hispanic or Latino
Median house or condo value ($) - American Indian and Alaska Native
Median house or condo value ($) - Multirace
Median house or condo value ($) - Other Race
Median resident age
Resident age diversity
Median resident age - Males
Median resident age - Females
Median resident age - White
Median resident age - Black or African American
Median resident age - Asian
Median resident age - Hispanic or Latino
Median resident age - American Indian and Alaska Native
Median resident age - Multirace
Median resident age - Other Race
Median resident age - Males - White
Median resident age - Males - Black or African American
Median resident age - Males - Asian
Median resident age - Males - Hispanic or Latino
Median resident age - Males - American Indian and Alaska Native
Median resident age - Males - Multirace
Median resident age - Males - Other Race
Median resident age - Females - White
Median resident age - Females - Black or African American
Median resident age - Females - Asian
Median resident age - Females - Hispanic or Latino
Median resident age - Females - American Indian and Alaska Native
Median resident age - Females - Multirace
Median resident age - Females - Other Race
Commute - mean travel time to work (minutes)
Travel time to work - Less than 5 minutes (%)
Travel time to work - Less than 5 minutes (% change since 2000)
Travel time to work - 5 to 9 minutes (%)
Travel time to work - 5 to 9 minutes (% change since 2000)
Travel time to work - 10 to 19 minutes (%)
Travel time to work - 10 to 19 minutes (% change since 2000)
Travel time to work - 20 to 29 minutes (%)
Travel time to work - 20 to 29 minutes (% change since 2000)
Travel time to work - 30 to 39 minutes (%)
Travel time to work - 30 to 39 minutes (% change since 2000)
Travel time to work - 40 to 59 minutes (%)
Travel time to work - 40 to 59 minutes (% change since 2000)
Travel time to work - 60 to 89 minutes (%)
Travel time to work - 60 to 89 minutes (% change since 2000)
Travel time to work - 90 or more minutes (%)
Travel time to work - 90 or more minutes (% change since 2000)
Marital status - Never married (%)
Marital status - Now married (%)
Marital status - Separated (%)
Marital status - Widowed (%)
Marital status - Divorced (%)
Median family income ($)
Median family income (% change since 2000)
Median non-family income ($)
Median non-family income (% change since 2000)
Median per capita income ($)
Median per capita income (% change since 2000)
Median family income ($) - White
Median family income ($) - Black or African American
Median family income ($) - Asian
Median family income ($) - Hispanic or Latino
Median family income ($) - American Indian and Alaska Native
Median family income ($) - Multirace
Median family income ($) - Other Race
Median year house/condo built
Median year apartment built
Year house built - Built 2005 or later (%)
Year house built - Built 2000 to 2004 (%)
Year house built - Built 1990 to 1999 (%)
Year house built - Built 1980 to 1989 (%)
Year house built - Built 1970 to 1979 (%)
Year house built - Built 1960 to 1969 (%)
Year house built - Built 1950 to 1959 (%)
Year house built - Built 1940 to 1949 (%)
Year house built - Built 1939 or earlier (%)
Average household size
Household density (households per square mile)
Average household size - White
Average household size - Black or African American
Average household size - Asian
Average household size - Hispanic or Latino
Average household size - American Indian and Alaska Native
Average household size - Multirace
Average household size - Other Race
Occupied housing units (%)
Vacant housing units (%)
Owner occupied housing units (%)
Renter occupied housing units (%)
Vacancy status - For rent (%)
Vacancy status - For sale only (%)
Vacancy status - Rented or sold, not occupied (%)
Vacancy status - For seasonal, recreational, or occasional use (%)
Vacancy status - For migrant workers (%)
Vacancy status - Other vacant (%)
Residents with income below the poverty level (%)
Residents with income below 50% of the poverty level (%)
Children below poverty level (%)
Poor families by family type - Married-couple family (%)
Poor families by family type - Male, no wife present (%)
Poor families by family type - Female, no husband present (%)
Poverty status for native-born residents (%)
Poverty status for foreign-born residents (%)
Poverty among high school graduates not in families (%)
Poverty among people who did not graduate high school not in families (%)
Residents with income below the poverty level (%) - White
Residents with income below the poverty level (%) - Black or African American
Residents with income below the poverty level (%) - Asian
Residents with income below the poverty level (%) - Hispanic or Latino
Residents with income below the poverty level (%) - American Indian and Alaska Native
Residents with income below the poverty level (%) - Multirace
Residents with income below the poverty level (%) - Other Race
Air pollution - Air Quality Index (AQI)
Air pollution - CO
Air pollution - NO2
Air pollution - SO2
Air pollution - Ozone
Air pollution - PM10
Air pollution - PM25
Air pollution - Pb
Crime - Murders per 100,000 population
Crime - Rapes per 100,000 population
Crime - Robberies per 100,000 population
Crime - Assaults per 100,000 population
Crime - Burglaries per 100,000 population
Crime - Thefts per 100,000 population
Crime - Auto thefts per 100,000 population
Crime - Arson per 100,000 population
Crime - City-data.com crime index
Crime - Violent crime index
Crime - Property crime index
Crime - Murders per 100,000 population (5 year average)
Crime - Rapes per 100,000 population (5 year average)
Crime - Robberies per 100,000 population (5 year average)
Crime - Assaults per 100,000 population (5 year average)
Crime - Burglaries per 100,000 population (5 year average)
Crime - Thefts per 100,000 population (5 year average)
Crime - Auto thefts per 100,000 population (5 year average)
Crime - Arson per 100,000 population (5 year average)
Crime - City-data.com crime index (5 year average)
Crime - Violent crime index (5 year average)
Crime - Property crime index (5 year average)
1996 Presidential Elections Results (%) - Democratic Party (Clinton)
1996 Presidential Elections Results (%) - Republican Party (Dole)
1996 Presidential Elections Results (%) - Other
2000 Presidential Elections Results (%) - Democratic Party (Gore)
2000 Presidential Elections Results (%) - Republican Party (Bush)
2000 Presidential Elections Results (%) - Other
2004 Presidential Elections Results (%) - Democratic Party (Kerry)
2004 Presidential Elections Results (%) - Republican Party (Bush)
2004 Presidential Elections Results (%) - Other
2008 Presidential Elections Results (%) - Democratic Party (Obama)
2008 Presidential Elections Results (%) - Republican Party (McCain)
2008 Presidential Elections Results (%) - Other
2012 Presidential Elections Results (%) - Democratic Party (Obama)
2012 Presidential Elections Results (%) - Republican Party (Romney)
2012 Presidential Elections Results (%) - Other
2016 Presidential Elections Results (%) - Democratic Party (Clinton)
2016 Presidential Elections Results (%) - Republican Party (Trump)
2016 Presidential Elections Results (%) - Other
2020 Presidential Elections Results (%) - Democratic Party (Biden)
2020 Presidential Elections Results (%) - Republican Party (Trump)
2020 Presidential Elections Results (%) - Other
Ancestries Reported - Arab (%)
Ancestries Reported - Czech (%)
Ancestries Reported - Danish (%)
Ancestries Reported - Dutch (%)
Ancestries Reported - English (%)
Ancestries Reported - French (%)
Ancestries Reported - French Canadian (%)
Ancestries Reported - German (%)
Ancestries Reported - Greek (%)
Ancestries Reported - Hungarian (%)
Ancestries Reported - Irish (%)
Ancestries Reported - Italian (%)
Ancestries Reported - Lithuanian (%)
Ancestries Reported - Norwegian (%)
Ancestries Reported - Polish (%)
Ancestries Reported - Portuguese (%)
Ancestries Reported - Russian (%)
Ancestries Reported - Scotch-Irish (%)
Ancestries Reported - Scottish (%)
Ancestries Reported - Slovak (%)
Ancestries Reported - Subsaharan African (%)
Ancestries Reported - Swedish (%)
Ancestries Reported - Swiss (%)
Ancestries Reported - Ukrainian (%)
Ancestries Reported - United States (%)
Ancestries Reported - Welsh (%)
Ancestries Reported - West Indian (%)
Ancestries Reported - Other (%)
Educational Attainment - No schooling completed (%)
Educational Attainment - Less than high school (%)
Educational Attainment - High school or equivalent (%)
Educational Attainment - Less than 1 year of college (%)
Educational Attainment - 1 or more years of college (%)
Educational Attainment - Associate degree (%)
Educational Attainment - Bachelor's degree (%)
Educational Attainment - Master's degree (%)
Educational Attainment - Professional school degree (%)
Educational Attainment - Doctorate degree (%)
School Enrollment - Nursery, preschool (%)
School Enrollment - Kindergarten (%)
School Enrollment - Grade 1 to 4 (%)
School Enrollment - Grade 5 to 8 (%)
School Enrollment - Grade 9 to 12 (%)
School Enrollment - College undergrad (%)
School Enrollment - Graduate or professional (%)
School Enrollment - Not enrolled in school (%)
School enrollment - Public schools (%)
School enrollment - Private schools (%)
School enrollment - Not enrolled (%)
Median number of rooms in houses and condos
Median number of rooms in apartments
Housing units lacking complete plumbing facilities (%)
Housing units lacking complete kitchen facilities (%)
Density of houses
Urban houses (%)
Rural houses (%)
Households with people 60 years and over (%)
Households with people 65 years and over (%)
Households with people 75 years and over (%)
Households with one or more nonrelatives (%)
Households with no nonrelatives (%)
Population in households (%)
Family households (%)
Nonfamily households (%)
Population in families (%)
Family households with own children (%)
Median number of bedrooms in owner occupied houses
Mean number of bedrooms in owner occupied houses
Median number of bedrooms in renter occupied houses
Mean number of bedrooms in renter occupied houses
Median number of vehichles in owner occupied houses
Mean number of vehichles in owner occupied houses
Median number of vehichles in renter occupied houses
Mean number of vehichles in renter occupied houses
Mortgage status - with mortgage (%)
Mortgage status - with second mortgage (%)
Mortgage status - with home equity loan (%)
Mortgage status - with both second mortgage and home equity loan (%)
Mortgage status - without a mortgage (%)
Average family size
Average family size - White
Average family size - Black or African American
Average family size - Asian
Average family size - Hispanic or Latino
Average family size - American Indian and Alaska Native
Average family size - Multirace
Average family size - Other Race
Geographical mobility - Same house 1 year ago (%)
Geographical mobility - Moved within same county (%)
Geographical mobility - Moved from different county within same state (%)
Geographical mobility - Moved from different state (%)
Geographical mobility - Moved from abroad (%)
Place of birth - Born in state of residence (%)
Place of birth - Born in other state (%)
Place of birth - Native, outside of US (%)
Place of birth - Foreign born (%)
Housing units in structures - 1, detached (%)
Housing units in structures - 1, attached (%)
Housing units in structures - 2 (%)
Housing units in structures - 3 or 4 (%)
Housing units in structures - 5 to 9 (%)
Housing units in structures - 10 to 19 (%)
Housing units in structures - 20 to 49 (%)
Housing units in structures - 50 or more (%)
Housing units in structures - Mobile home (%)
Housing units in structures - Boat, RV, van, etc. (%)
House/condo owner moved in on average (years ago)
Renter moved in on average (years ago)
Year householder moved into unit - Moved in 1999 to March 2000 (%)
Year householder moved into unit - Moved in 1995 to 1998 (%)
Year householder moved into unit - Moved in 1990 to 1994 (%)
Year householder moved into unit - Moved in 1980 to 1989 (%)
Year householder moved into unit - Moved in 1970 to 1979 (%)
Year householder moved into unit - Moved in 1969 or earlier (%)
Means of transportation to work - Drove car alone (%)
Means of transportation to work - Carpooled (%)
Means of transportation to work - Public transportation (%)
Means of transportation to work - Bus or trolley bus (%)
Means of transportation to work - Streetcar or trolley car (%)
Means of transportation to work - Subway or elevated (%)
Means of transportation to work - Railroad (%)
Means of transportation to work - Ferryboat (%)
Means of transportation to work - Taxicab (%)
Means of transportation to work - Motorcycle (%)
Means of transportation to work - Bicycle (%)
Means of transportation to work - Walked (%)
Means of transportation to work - Other means (%)
Working at home (%)
Industry diversity
Most Common Industries - Agriculture, forestry, fishing and hunting, and mining (%)
Most Common Industries - Agriculture, forestry, fishing and hunting (%)
Most Common Industries - Mining, quarrying, and oil and gas extraction (%)
Most Common Industries - Construction (%)
Most Common Industries - Manufacturing (%)
Most Common Industries - Wholesale trade (%)
Most Common Industries - Retail trade (%)
Most Common Industries - Transportation and warehousing, and utilities (%)
Most Common Industries - Transportation and warehousing (%)
Most Common Industries - Utilities (%)
Most Common Industries - Information (%)
Most Common Industries - Finance and insurance, and real estate and rental and leasing (%)
Most Common Industries - Finance and insurance (%)
Most Common Industries - Real estate and rental and leasing (%)
Most Common Industries - Professional, scientific, and management, and administrative and waste management services (%)
Most Common Industries - Professional, scientific, and technical services (%)
Most Common Industries - Management of companies and enterprises (%)
Most Common Industries - Administrative and support and waste management services (%)
Most Common Industries - Educational services, and health care and social assistance (%)
Most Common Industries - Educational services (%)
Most Common Industries - Health care and social assistance (%)
Most Common Industries - Arts, entertainment, and recreation, and accommodation and food services (%)
Most Common Industries - Arts, entertainment, and recreation (%)
Most Common Industries - Accommodation and food services (%)
Most Common Industries - Other services, except public administration (%)
Most Common Industries - Public administration (%)
Occupation diversity
Most Common Occupations - Management, business, science, and arts occupations (%)
Most Common Occupations - Management, business, and financial occupations (%)
Most Common Occupations - Management occupations (%)
Most Common Occupations - Business and financial operations occupations (%)
Most Common Occupations - Computer, engineering, and science occupations (%)
Most Common Occupations - Computer and mathematical occupations (%)
Most Common Occupations - Architecture and engineering occupations (%)
Most Common Occupations - Life, physical, and social science occupations (%)
Most Common Occupations - Education, legal, community service, arts, and media occupations (%)
Most Common Occupations - Community and social service occupations (%)
Most Common Occupations - Legal occupations (%)
Most Common Occupations - Education, training, and library occupations (%)
Most Common Occupations - Arts, design, entertainment, sports, and media occupations (%)
Most Common Occupations - Healthcare practitioners and technical occupations (%)
Most Common Occupations - Health diagnosing and treating practitioners and other technical occupations (%)
Most Common Occupations - Health technologists and technicians (%)
Most Common Occupations - Service occupations (%)
Most Common Occupations - Healthcare support occupations (%)
Most Common Occupations - Protective service occupations (%)
Most Common Occupations - Fire fighting and prevention, and other protective service workers including supervisors (%)
Most Common Occupations - Law enforcement workers including supervisors (%)
Most Common Occupations - Food preparation and serving related occupations (%)
Most Common Occupations - Building and grounds cleaning and maintenance occupations (%)
Most Common Occupations - Personal care and service occupations (%)
Most Common Occupations - Sales and office occupations (%)
Most Common Occupations - Sales and related occupations (%)
Most Common Occupations - Office and administrative support occupations (%)
Most Common Occupations - Natural resources, construction, and maintenance occupations (%)
Most Common Occupations - Farming, fishing, and forestry occupations (%)
Most Common Occupations - Construction and extraction occupations (%)
Most Common Occupations - Installation, maintenance, and repair occupations (%)
Most Common Occupations - Production, transportation, and material moving occupations (%)
Most Common Occupations - Production occupations (%)
Most Common Occupations - Transportation occupations (%)
Most Common Occupations - Material moving occupations (%)
People in Group quarters - Institutionalized population (%)
People in Group quarters - Correctional institutions (%)
People in Group quarters - Federal prisons and detention centers (%)
People in Group quarters - Halfway houses (%)
People in Group quarters - Local jails and other confinement facilities (including police lockups) (%)
People in Group quarters - Military disciplinary barracks (%)
People in Group quarters - State prisons (%)
People in Group quarters - Other types of correctional institutions (%)
People in Group quarters - Nursing homes (%)
People in Group quarters - Hospitals/wards, hospices, and schools for the handicapped (%)
People in Group quarters - Hospitals/wards and hospices for chronically ill (%)
People in Group quarters - Hospices or homes for chronically ill (%)
People in Group quarters - Military hospitals or wards for chronically ill (%)
People in Group quarters - Other hospitals or wards for chronically ill (%)
People in Group quarters - Hospitals or wards for drug/alcohol abuse (%)
People in Group quarters - Mental (Psychiatric) hospitals or wards (%)
People in Group quarters - Schools, hospitals, or wards for the mentally retarded (%)
People in Group quarters - Schools, hospitals, or wards for the physically handicapped (%)
People in Group quarters - Institutions for the deaf (%)
People in Group quarters - Institutions for the blind (%)
People in Group quarters - Orthopedic wards and institutions for the physically handicapped (%)
People in Group quarters - Wards in general hospitals for patients who have no usual home elsewhere (%)
People in Group quarters - Wards in military hospitals for patients who have no usual home elsewhere (%)
People in Group quarters - Juvenile institutions (%)
People in Group quarters - Long-term care (%)
People in Group quarters - Homes for abused, dependent, and neglected children (%)
People in Group quarters - Residential treatment centers for emotionally disturbed children (%)
People in Group quarters - Training schools for juvenile delinquents (%)
People in Group quarters - Short-term care, detention or diagnostic centers for delinquent children (%)
People in Group quarters - Type of juvenile institution unknown (%)
People in Group quarters - Noninstitutionalized population (%)
People in Group quarters - College dormitories (includes college quarters off campus) (%)
People in Group quarters - Military quarters (%)
People in Group quarters - On base (%)
People in Group quarters - Barracks, unaccompanied personnel housing (UPH), (Enlisted/Officer), ;and similar group living quarters for military personnel (%)
People in Group quarters - Transient quarters for temporary residents (%)
People in Group quarters - Military ships (%)
People in Group quarters - Group homes (%)
People in Group quarters - Homes or halfway houses for drug/alcohol abuse (%)
People in Group quarters - Homes for the mentally ill (%)
People in Group quarters - Homes for the mentally retarded (%)
People in Group quarters - Homes for the physically handicapped (%)
People in Group quarters - Other group homes (%)
People in Group quarters - Religious group quarters (%)
People in Group quarters - Dormitories (%)
People in Group quarters - Agriculture workers' dormitories on farms (%)
People in Group quarters - Job Corps and vocational training facilities (%)
People in Group quarters - Other workers' dormitories (%)
People in Group quarters - Crews of maritime vessels (%)
People in Group quarters - Other nonhousehold living situations (%)
People in Group quarters - Other noninstitutional group quarters (%)
Residents speaking English at home (%)
Residents speaking English at home - Born in the United States (%)
Residents speaking English at home - Native, born elsewhere (%)
Residents speaking English at home - Foreign born (%)
Residents speaking Spanish at home (%)
Residents speaking Spanish at home - Born in the United States (%)
Residents speaking Spanish at home - Native, born elsewhere (%)
Residents speaking Spanish at home - Foreign born (%)
Residents speaking other language at home (%)
Residents speaking other language at home - Born in the United States (%)
Residents speaking other language at home - Native, born elsewhere (%)
Residents speaking other language at home - Foreign born (%)
Class of Workers - Employee of private company (%)
Class of Workers - Self-employed in own incorporated business (%)
Class of Workers - Private not-for-profit wage and salary workers (%)
Class of Workers - Local government workers (%)
Class of Workers - State government workers (%)
Class of Workers - Federal government workers (%)
Class of Workers - Self-employed workers in own not incorporated business and Unpaid family workers (%)
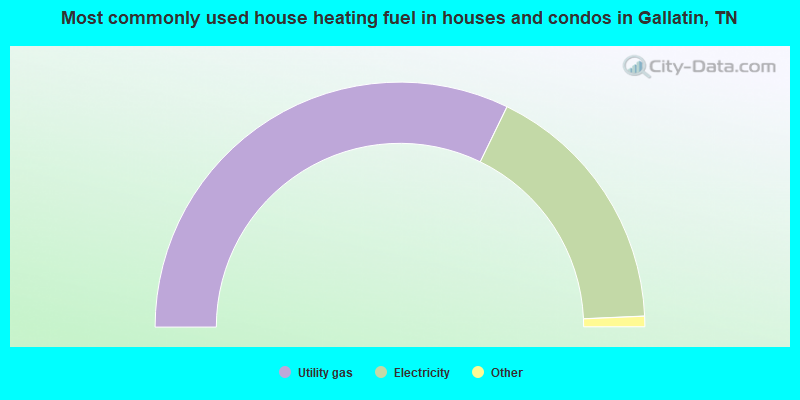
House heating fuel used in houses and condos - Utility gas (%)
House heating fuel used in houses and condos - Bottled, tank, or LP gas (%)
House heating fuel used in houses and condos - Electricity (%)
House heating fuel used in houses and condos - Fuel oil, kerosene, etc. (%)
House heating fuel used in houses and condos - Coal or coke (%)
House heating fuel used in houses and condos - Wood (%)
House heating fuel used in houses and condos - Solar energy (%)
House heating fuel used in houses and condos - Other fuel (%)
House heating fuel used in houses and condos - No fuel used (%)
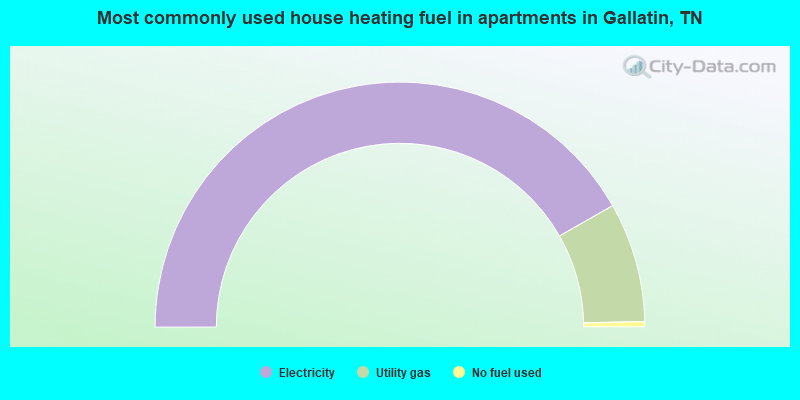
House heating fuel used in apartments - Utility gas (%)
House heating fuel used in apartments - Bottled, tank, or LP gas (%)
House heating fuel used in apartments - Electricity (%)
House heating fuel used in apartments - Fuel oil, kerosene, etc. (%)
House heating fuel used in apartments - Coal or coke (%)
House heating fuel used in apartments - Wood (%)
House heating fuel used in apartments - Solar energy (%)
House heating fuel used in apartments - Other fuel (%)
House heating fuel used in apartments - No fuel used (%)
Armed forces status - In Armed Forces (%)
Armed forces status - Civilian (%)
Armed forces status - Civilian - Veteran (%)
Armed forces status - Civilian - Nonveteran (%)
Fatal accidents locations in years 2005-2021
Fatal accidents locations in 2005
Fatal accidents locations in 2006
Fatal accidents locations in 2007
Fatal accidents locations in 2008
Fatal accidents locations in 2009
Fatal accidents locations in 2010
Fatal accidents locations in 2011
Fatal accidents locations in 2012
Fatal accidents locations in 2013
Fatal accidents locations in 2014
Fatal accidents locations in 2015
Fatal accidents locations in 2016
Fatal accidents locations in 2017
Fatal accidents locations in 2018
Fatal accidents locations in 2019
Fatal accidents locations in 2020
Fatal accidents locations in 2021
Alcohol use - People drinking some alcohol every month (%)
Alcohol use - People not drinking at all (%)
Alcohol use - Average days/month drinking alcohol
Alcohol use - Average drinks/week
Alcohol use - Average days/year people drink much
Audiometry - Average condition of hearing (%)
Audiometry - People that can hear a whisper from across a quiet room (%)
Audiometry - People that can hear normal voice from across a quiet room (%)
Audiometry - Ears ringing, roaring, buzzing (%)
Audiometry - Had a job exposure to loud noise (%)
Audiometry - Had off-work exposure to loud noise (%)
Blood Pressure & Cholesterol - Has high blood pressure (%)
Blood Pressure & Cholesterol - Checking blood pressure at home (%)
Blood Pressure & Cholesterol - Frequently checking blood cholesterol (%)
Blood Pressure & Cholesterol - Has high cholesterol level (%)
Consumer Behavior - Money monthly spent on food at supermarket/grocery store
Consumer Behavior - Money monthly spent on food at other stores
Consumer Behavior - Money monthly spent on eating out
Consumer Behavior - Money monthly spent on carryout/delivered foods
Consumer Behavior - Income spent on food at supermarket/grocery store (%)
Consumer Behavior - Income spent on food at other stores (%)
Consumer Behavior - Income spent on eating out (%)
Consumer Behavior - Income spent on carryout/delivered foods (%)
Current Health Status - General health condition (%)
Current Health Status - Blood donors (%)
Current Health Status - Has blood ever tested for HIV virus (%)
Current Health Status - Left-handed people (%)
Dermatology - People using sunscreen (%)
Diabetes - Diabetics (%)
Diabetes - Had a blood test for high blood sugar (%)
Diabetes - People taking insulin (%)
Diet Behavior & Nutrition - Diet health (%)
Diet Behavior & Nutrition - Milk product consumption (# of products/month)
Diet Behavior & Nutrition - Meals not home prepared (#/week)
Diet Behavior & Nutrition - Meals from fast food or pizza place (#/week)
Diet Behavior & Nutrition - Ready-to-eat foods (#/month)
Diet Behavior & Nutrition - Frozen meals/pizza (#/month)
Drug Use - People that ever used marijuana or hashish (%)
Drug Use - Ever used hard drugs (%)
Drug Use - Ever used any form of cocaine (%)
Drug Use - Ever used heroin (%)
Drug Use - Ever used methamphetamine (%)
Health Insurance - People covered by health insurance (%)
Kidney Conditions-Urology - Avg. # of times urinating at night
Medical Conditions - People with asthma (%)
Medical Conditions - People with anemia (%)
Medical Conditions - People with psoriasis (%)
Medical Conditions - People with overweight (%)
Medical Conditions - Elderly people having difficulties in thinking or remembering (%)
Medical Conditions - People who ever received blood transfusion (%)
Medical Conditions - People having trouble seeing even with glass/contacts (%)
Medical Conditions - People with arthritis (%)
Medical Conditions - People with gout (%)
Medical Conditions - People with congestive heart failure (%)
Medical Conditions - People with coronary heart disease (%)
Medical Conditions - People with angina pectoris (%)
Medical Conditions - People who ever had heart attack (%)
Medical Conditions - People who ever had stroke (%)
Medical Conditions - People with emphysema (%)
Medical Conditions - People with thyroid problem (%)
Medical Conditions - People with chronic bronchitis (%)
Medical Conditions - People with any liver condition (%)
Medical Conditions - People who ever had cancer or malignancy (%)
Mental Health - People who have little interest in doing things (%)
Mental Health - People feeling down, depressed, or hopeless (%)
Mental Health - People who have trouble sleeping or sleeping too much (%)
Mental Health - People feeling tired or having little energy (%)
Mental Health - People with poor appetite or overeating (%)
Mental Health - People feeling bad about themself (%)
Mental Health - People who have trouble concentrating on things (%)
Mental Health - People moving or speaking slowly or too fast (%)
Mental Health - People having thoughts they would be better off dead (%)
Oral Health - Average years since last visit a dentist
Oral Health - People embarrassed because of mouth (%)
Oral Health - People with gum disease (%)
Oral Health - General health of teeth and gums (%)
Oral Health - Average days a week using dental floss/device
Oral Health - Average days a week using mouthwash for dental problem
Oral Health - Average number of teeth
Pesticide Use - Households using pesticides to control insects (%)
Pesticide Use - Households using pesticides to kill weeds (%)
Physical Activity - People doing vigorous-intensity work activities (%)
Physical Activity - People doing moderate-intensity work activities (%)
Physical Activity - People walking or bicycling (%)
Physical Activity - People doing vigorous-intensity recreational activities (%)
Physical Activity - People doing moderate-intensity recreational activities (%)
Physical Activity - Average hours a day doing sedentary activities
Physical Activity - Average hours a day watching TV or videos
Physical Activity - Average hours a day using computer
Physical Functioning - People having limitations keeping them from working (%)
Physical Functioning - People limited in amount of work they can do (%)
Physical Functioning - People that need special equipment to walk (%)
Physical Functioning - People experiencing confusion/memory problems (%)
Physical Functioning - People requiring special healthcare equipment (%)
Prescription Medications - Average number of prescription medicines taking
Preventive Aspirin Use - Adults 40+ taking low-dose aspirin (%)
Reproductive Health - Vaginal deliveries (%)
Reproductive Health - Cesarean deliveries (%)
Reproductive Health - Deliveries resulted in a live birth (%)
Reproductive Health - Pregnancies resulted in a delivery (%)
Reproductive Health - Women breastfeeding newborns (%)
Reproductive Health - Women that had a hysterectomy (%)
Reproductive Health - Women that had both ovaries removed (%)
Reproductive Health - Women that have ever taken birth control pills (%)
Reproductive Health - Women taking birth control pills (%)
Reproductive Health - Women that have ever used Depo-Provera or injectables (%)
Reproductive Health - Women that have ever used female hormones (%)
Sexual Behavior - People 18+ that ever had sex (vaginal, anal, or oral) (%)
Sexual Behavior - Males 18+ that ever had vaginal sex with a woman (%)
Sexual Behavior - Males 18+ that ever performed oral sex on a woman (%)
Sexual Behavior - Males 18+ that ever had anal sex with a woman (%)
Sexual Behavior - Males 18+ that ever had any sex with a man (%)
Sexual Behavior - Females 18+ that ever had vaginal sex with a man (%)
Sexual Behavior - Females 18+ that ever performed oral sex on a man (%)
Sexual Behavior - Females 18+ that ever had anal sex with a man (%)
Sexual Behavior - Females 18+ that ever had any kind of sex with a woman (%)
Sexual Behavior - Average age people first had sex
Sexual Behavior - Average number of female sex partners in lifetime (males 18+)
Sexual Behavior - Average number of female vaginal sex partners in lifetime (males 18+)
Sexual Behavior - Average age people first performed oral sex on a woman (18+)
Sexual Behavior - Average number of woman performed oral sex on in lifetime (18+)
Sexual Behavior - Average number of male sex partners in lifetime (males 18+)
Sexual Behavior - Average number of male anal sex partners in lifetime (males 18+)
Sexual Behavior - Average age people first performed oral sex on a man (18+)
Sexual Behavior - Average number of male oral sex partners in lifetime (18+)
Sexual Behavior - People using protection when performing oral sex (%)
Sexual Behavior - Average number of times people have vaginal or anal sex a year
Sexual Behavior - People having sex without condom (%)
Sexual Behavior - Average number of male sex partners in lifetime (females 18+)
Sexual Behavior - Average number of male vaginal sex partners in lifetime (females 18+)
Sexual Behavior - Average number of female sex partners in lifetime (females 18+)
Sexual Behavior - Circumcised males 18+ (%)
Sleep Disorders - Average hours sleeping at night
Sleep Disorders - People that has trouble sleeping (%)
Smoking-Cigarette Use - People smoking cigarettes (%)
Taste & Smell - People 40+ having problems with smell (%)
Taste & Smell - People 40+ having problems with taste (%)
Taste & Smell - People 40+ that ever had wisdom teeth removed (%)
Taste & Smell - People 40+ that ever had tonsils teeth removed (%)
Taste & Smell - People 40+ that ever had a loss of consciousness because of a head injury (%)
Taste & Smell - People 40+ that ever had a broken nose or other serious injury to face or skull (%)
Taste & Smell - People 40+ that ever had two or more sinus infections (%)
Weight - Average height (inches)
Weight - Average weight (pounds)
Weight - Average BMI
Weight - People that are obese (%)
Weight - People that ever were obese (%)
Weight - People trying to lose weight (%)
Officers per 1,000 residents here:
1.72Tennessee average:
2.57
Latest news from Gallatin, TN collected exclusively by city-data.com from local newspapers, TV, and radio stations
Gallatin, TN City Guides: Ancestries: American (21.6%), English (9.6%), Irish (5.8%), German (5.0%), European (4.3%), Italian (1.6%).
Current Local Time:
Land area: 22.0 square miles.
Population density: 2,193 people per square mile (low).
2,821 residents are foreign born (3.1% Latin America , 1.8% Asia ).
This city:
6.1%Tennessee:
5.4%
Median real estate property taxes paid for housing units with mortgages in 2022: $1,823 (0.5%)Median real estate property taxes paid for housing units with no mortgage in 2022: $1,895 (0.5%)
Nearest city with pop. 50,000+: Nashville-Davidson, TN
Nearest city with pop. 1,000,000+: Chicago, IL
Nearest cities:
Latitude: 36.38 N, Longitude: 86.45 W
Daytime population change due to commuting: +4,846 (+10.4%)Workers who live and work in this city: 11,766 (52.2%)
Single-family new house construction building permits:
2022: 688 buildings , average cost: $314,2002021: 763 buildings , average cost: $297,9002020: 686 buildings , average cost: $241,0002019: 447 buildings , average cost: $266,6002018: 537 buildings , average cost: $260,9002017: 506 buildings , average cost: $230,4002016: 551 buildings , average cost: $239,7002015: 418 buildings , average cost: $224,0002014: 368 buildings , average cost: $214,5002013: 313 buildings , average cost: $173,7002012: 199 buildings , average cost: $224,0002011: 157 buildings , average cost: $186,5002010: 100 buildings , average cost: $142,1002009: 222 buildings , average cost: $213,3002008: 341 buildings , average cost: $165,7002007: 348 buildings , average cost: $218,9002006: 503 buildings , average cost: $165,1002005: 370 buildings , average cost: $234,9002004: 320 buildings , average cost: $177,5002003: 272 buildings , average cost: $156,4002002: 211 buildings , average cost: $120,9002001: 157 buildings , average cost: $115,1002000: 115 buildings , average cost: $104,2001999: 206 buildings , average cost: $113,0001998: 138 buildings , average cost: $113,4001997: 134 buildings , average cost: $111,100Unemployment in December 2023:
Population change in the 1990s: +4,135 (+21.7%).
Most common occupations in Gallatin, TN (%)
Both Males Females
Other production occupations, including supervisors (6.1%)
Material recording, scheduling, dispatching, and distributing workers (4.5%)
Building and grounds cleaning and maintenance occupations (4.4%)
Assemblers and fabricators (4.1%)
Other sales and related occupations, including supervisors (3.9%)
Driver/sales workers and truck drivers (3.4%)
Other management occupations, except farmers and farm managers (3.3%)
Other production occupations, including supervisors (7.4%)
Driver/sales workers and truck drivers (6.3%)
Material recording, scheduling, dispatching, and distributing workers (5.3%)
Building and grounds cleaning and maintenance occupations (5.2%)
Electrical equipment mechanics and other installation, maintenance, and repair workers, including supervisors (5.0%)
Metal workers and plastic workers (4.7%)
Assemblers and fabricators (4.4%)
Secretaries and administrative assistants (5.3%)
Other office and administrative support workers, including supervisors (5.2%)
Information and record clerks, except customer service representatives (4.8%)
Other production occupations, including supervisors (4.6%)
Preschool, kindergarten, elementary, and middle school teachers (4.3%)
Other sales and related occupations, including supervisors (4.0%)
Laborers and material movers, hand (3.8%)
Tornado activity:
Gallatin-area historical tornado activity is slightly above Tennessee state average. It is 66% greater than the overall U.S. average.
On 4/27/1970, a category F4 (max. wind speeds 207-260 mph) tornado 12.5 miles away from the Gallatin city center killed 3 people and injured 85 people and caused between $500,000 and $5,000,000 in damages.
On 2/5/2008, a category F3 (max. wind speeds 158-206 mph) tornado 6.2 miles away from the city center killed 22 people and injured 63 people and caused $28 million in damages.
Earthquake activity:
Gallatin-area historical earthquake activity is significantly above Tennessee state average. It is 179% greater than the overall U.S. average. On 4/18/2008 at 09:36:59, a magnitude 5.4 (5.1 MB, 4.8 MS, 5.4 MW, 5.2 MW, Class: Moderate, Intensity: VI - VII) earthquake occurred 163.5 miles away from the city center On 4/18/2008 at 09:36:59, a magnitude 5.2 (5.2 MW, Depth: 8.9 mi) earthquake occurred 163.4 miles away from the city center On 6/18/2002 at 17:37:15, a magnitude 5.0 (4.3 MB, 4.6 MW, 5.0 LG) earthquake occurred 133.0 miles away from the city center On 7/27/1980 at 18:52:21, a magnitude 5.2 (5.1 MB, 4.7 MS, 5.0 UK, 5.2 UK) earthquake occurred 187.0 miles away from Gallatin center On 4/29/2003 at 08:59:39, a magnitude 4.9 (4.4 MB, 4.6 MW, 4.9 LG, Class: Light, Intensity: IV - V) earthquake occurred 138.5 miles away from Gallatin center On 6/10/1987 at 23:48:54, a magnitude 5.1 (4.9 MB, 4.4 MS, 4.6 MS, 5.1 LG) earthquake occurred 186.1 miles away from the city center Magnitude types: regional Lg-wave magnitude (LG), body-wave magnitude (MB), surface-wave magnitude (MS), moment magnitude (MW) Natural disasters: The number of natural disasters in Sumner County (14) is near the US average (15).Major Disasters (Presidential) Declared: 12Emergencies Declared: 1Storms: 11, Floods: 10, Tornadoes: 8, Winds: 3, Flash Flood: 1, Hurricane: 1, Ice Storm: 1, Winter Storm: 1, Other: 1 (Note: some incidents may be assigned to more than one category). Hospitals and medical centers in Gallatin: SUMNER REGIONAL MEDICAL CENTER (Proprietary, 555 HARTSVILLE PIKE) (CLOSED) SUMNER REGIONAL MEDICAL TCU (555 HARTSVILLE PIKE)
GALLATIN HEALTH CARE CENTER, LLC (438 NORTH WATER AVE)
GOLDEN LIVINGCENTER - BRANDYWOOD (555 E BLEDSOE)
SWANSON NH (647 PACE ST)
RAI GALLATIN (270 E MAIN STREET)
RCG GALLATIN (561 SOUTH WATER STREET)
SUMNER DIALYSIS (300 STEAMPLANT ROAD, SUITE 270)
SUMNER HOMECARE (575 EAST BLEDSOE STREET SUITE 2)
College/University in Gallatin: Volunteer State Community College Full-time enrollment: 5,311; Location: 1480 Nashville Pike; Public; Website: www.volstate.edu)
Other colleges/universities with over 2000 students near Gallatin:
Trevecca Nazarene University (about 24 miles; Nashville, TN ; Full-time enrollment: 2,223)
Vanderbilt University (about 26 miles; Nashville, TN ; FT enrollment: 10,518)
Belmont University (about 26 miles; Nashville, TN ; FT enrollment: 5,795)
Tennessee State University (about 26 miles; Nashville, TN ; FT enrollment: 7,341)
Lipscomb University (about 28 miles; Nashville, TN ; FT enrollment: 3,827)
Nashville State Community College (about 29 miles; Nashville, TN ; FT enrollment: 6,436)
Middle Tennessee State University (about 38 miles; Murfreesboro, TN ; FT enrollment: 21,628)
Public high schools in Gallatin: GALLATIN SENIOR HIGH SCHOOL Students: 1,585, Location: 700 DAN P. HERRON DR, Grades: 9-12)STATION CAMP HIGH SCHOOL Students: 900, Location: 1040 BISON TR, Grades: 9-12)R T FISHER ALTERNATIVE Students: 134, Location: 455 NORTH BOYERS, Grades: KG-12)E B WILSON Location: 695 E MAIN ST RD, Grades: 9-12)
SUMNER COUNTY MIDDLE COLLEGE HIGH SCHOOL Location: 695 EAST MAIN ST, Grades: 11-12)
Private high school in Gallatin: SOUTHSIDE CHRISTIAN SCHOOL Students: 11, Location: 1028 S WATER AVE, Grades: 3-12)
Public elementary/middle schools in Gallatin: BENNY C. BILLS ELEMENTARY SCHOOL Students: 725, Location: 1030 UNION SCHOOL RD, Grades: PK-5)JOE SHAFER MIDDLE SCHOOL Students: 640, Location: 240 ALBERT GALLATIN BL, Grades: 6-8)VENA STUART ELEMENTARY Students: 635, Location: 780 HART ST, Grades: PK-5)RUCKER STEWART MIDDLE Students: 612, Location: 350 HANCOCK ST, Grades: 6-8)GUILD ELEMENTARY Students: 543, Location: 1018 SOUTH WATER ST, Grades: PK-5)HOWARD ELEMENTARY Students: 485, Location: 805 LONG HOLLOW PK, Grades: PK-5)UNION ELEMENTARY SCHOOL Location: 516 CARSON ST, Grades: PK-5)
STATION CAMP MIDDLE SCHOOL Location: 281 BIG STATION CAMP BL, Grades: 6-8)
STATION CAMP ELEMENTARY Location: 1020 BISON TR, Grades: KG-5)
Private elementary/middle schools in Gallatin: SUMNER ACADEMY Students: 212, Location: 464 NICHOLS LN, Grades: PK-8)
ST JOHN VIANNEY CATHOLIC SCHOOL Students: 120, Location: 501 N WATER AVE, Grades: PK-8)
See full list of schools located in Gallatin Library in Gallatin: GALLATIN PUBLIC LIBRARY OF SUMNER COUNTY Operating income: $267,377; Location: 658 HARTSVILLE PIKE; 33,908 books ; 929 audio materials ; 1,373 video materials ; 1 local licensed databases ; 32 state licensed databases ; 41 print serial subscriptions )
Notable locations in Gallatin: (A) , Steam Plant Road Industrial Area (B) , Long Hollow Golf Course (C) , Green-Little Industrial Park (D) , Gallatin Marina (E) , Galatin Country Club (F) , Bradley Industrial Park (G) , Number One (H) , Gallatin City Fire Department Station 3 (I) , Sumner County Library (J) , Sumner County Courthouse (K) , Gallatin City Fire Department Station 2 (L) , Gallatin City Fire Department Station 1 (M) , Gallatin City Hall (N) , Sumner County Ambulance Service (O) , Professional Medical Transportation (P) , First Call Ambulance Service Sumner (Q) . Display/hide their locations on the map
Shopping Centers: (1) , Depot Square Shopping Center (2) . Display/hide their locations on the map
Churches in Gallatin include: (A) , College Heights Baptist Church (B) , First Baptist Church (C) , First Presbyterian Church (D) , First United Methodist Church (E) , Free Indeed Fellowship Church (F) , Key Church (G) , Peach Valley Church (H) , Nashville Road Church (I) . Display/hide their locations on the map
Cemetery: (1) . Display/hide its location on the map
Creek: (A) . Display/hide its location on the map
Parks in Gallatin include: (1) , Gallatin City Park (2) , Clearview Park (3) , Cedar Grove Access Area (4) . Display/hide their locations on the map
Tourist attractions: (1) , Sumner County - Archives (Cultural Attractions- Events- & Facilities; 155 East Main Street) (2) , Trousdale Place (Historical Places & Services; 183 West Main Street) (3) , Sumner County Museum (Cultural Attractions- Events- & Facilities; 183 West Main Street) (4) . Display/hide their approximate locations on the map
Hotels: (1) , Four Seasons Auto Sales (1280 South Water Avenue) (2) , Galemont Parkway Apartments (420 South Water Avenue) (3) , Hampton Inn Gallatin- TN (980 Village Green Crossing) (4) , Hancock House Bed & Breakfast (2144 Nashville Pike) (5) , Best Value Inn (101 W Broadway) (6) , Jameson Inn Gallatin (Sj) (1001 Village Green Xing) (7) . Display/hide their approximate locations on the map
Courts: (1) , Sumner County Of Government - Criminal Court (105 Public Square) (2) , Sumner County Government - Clerk of Circuit & Criminal Court (100 Courthouse) (3) , Sumner County Government - Judge of the Criminal Court (200 Courthouse) (4) , Sumner County Government - Judge of Circuit Court (100 Courthouse) (5) , Sumner County Government - Judge Of Chancery Court (300 Courthouse) (6) , Sumner County Government - Clerk of General Sessions Court (117 West Smith Street) (7) . Display/hide their approximate locations on the map
Birthplace of: Bill "Hoss" Allen - Radio DJ, Brent Alexander - 2005 NFL player (New York Giants, born : Jul 10, 1971), Huell Howser - Voice actor, John Dement - Politician, Johnny Maddox - Pianist, William M. Gwin - Politician, Edgar Bright Wilson - Chemist, Charles B. Mitchel - Politician, Lynn Bomar - Football player, Ray Oldham - Football player.
Sumner County has a predicted average indoor radon screening level between 2 and 4 pCi/L (pico curies per liter) - Moderate Potential Drinking water stations with addresses in Gallatin that have no violations reported:
GALLATIN WATER DEPARTMENT (Population served: 41,959, Primary Water Source Type: Surface water)
Average household size: This city:
2.5 peopleTennessee:
2.5 people
Percentage of family households: This city:
66.2%Whole state:
67.3%
Percentage of households with unmarried partners: This city:
6.6%Whole state:
5.8%
Likely homosexual households (counted as self-reported same-sex unmarried-partner households)
Lesbian couples: 0.4% of all households Gay men: 0.2% of all households
People in group quarters in Gallatin in 2010:
549 people in local jails and other municipal confinement facilities
308 people in nursing facilities/skilled-nursing facilities
13 people in correctional facilities intended for juveniles
13 people in emergency and transitional shelters (with sleeping facilities) for people experiencing homelessness
7 people in workers' group living quarters and job corps centers
People in group quarters in Gallatin in 2000:
441 people in nursing homes
275 people in local jails and other confinement facilities (including police lockups)
60 people in other noninstitutional group quarters
34 people in homes for the mentally retarded
22 people in homes for abused, dependent, and neglected children
4 people in other nonhousehold living situations
Banks with most branches in Gallatin (2011 data):
U.S. Bank National Association: Savannah Way Kroger Branch, Gallatin Branch, Greensboro Village Safeway Branch. Info updated 2012/01/30: Bank assets: $330,470.8 mil, Deposits: $236,091.5 mil, headquarters in Cincinnati, OH, positive income , 3121 total offices , Holding Company: U.S. Bancorp
Regions Bank: Village Green Branch at 110 N Belvedere Drive, branch established on 1985/07/08; Gallatin Main at 285 East Main Street, branch established on 1890/01/01. Info updated 2011/02/24: Bank assets: $123,368.2 mil, Deposits: $98,301.3 mil, headquarters in Birmingham, AL, positive income , Commercial Lending Specialization, 1778 total offices , Holding Company: Regions Financial Corporation
Sumner Bank & Trust: West Broadway Branch at 240 West Broadway, branch established on 2007/05/21; at 780 Browns Lane, branch established on 2005/04/04. Info updated 2010/07/06: Bank assets: $156.2 mil, Deposits: $126.5 mil, local headquarters , positive income , Commercial Lending Specialization, 4 total offices
Volunteer State Bank: Greensboro Village Branch at 1553 Nashville Pike, branch established on 2011/04/01; Branch at 615 Nashville Pike, branch established on 1980/05/15. Info updated 2006/11/03: Bank assets: $383.7 mil, Deposits: $311.8 mil, headquarters in Portland, TN, positive income , Commercial Lending Specialization, 9 total offices , Holding Company: Volunteer State Bancshares, Inc.
Commerce Union Bank: Gallatin Branch at 1204 Nashville Pike, branch established on 2007/05/16; East Main Branch at 425 East Main Street, branch established on 2010/05/07. Info updated 2006/08/21: Bank assets: $208.9 mil, Deposits: $158.1 mil, headquarters in Springfield, TN, positive income , Commercial Lending Specialization, 3 total offices
Wilson Bank and Trust: Wilson Bank And Trust Loan Productio at 393 Maple Street, Suite 100-A, branch established on 2011/02/01; Gallatin Office at 455 West Main Street, branch established on 2011/02/01. Info updated 2006/11/03: Bank assets: $1,567.4 mil, Deposits: $1,398.3 mil, headquarters in Lebanon, TN, positive income , Commercial Lending Specialization, 25 total offices , Holding Company: Wilson Bank Holding Company
Capital Bank, National Association: Gallatin Branch at 250 West Broadway, branch established on 1991/11/18; Nashville Pike Branch at 710 Nashville Pike, branch established on 1990/01/16. Info updated 2011/09/21: Bank assets: $6,448.0 mil, Deposits: $5,135.4 mil, headquarters in Miami, FL, positive income , Commercial Lending Specialization, 152 total offices , Holding Company: North American Financial Holdings, Inc.
Fifth Third Bank: Gallatin Branch at 1131 Nashville Pike, branch established on 2004/10/27. Info updated 2009/10/05: Bank assets: $114,540.4 mil, Deposits: $89,689.1 mil, headquarters in Cincinnati, OH, positive income , Commercial Lending Specialization, 1378 total offices , Holding Company: Fifth Third Bancorp
First State Bank: Gallatin Branch at 1135 Nashville Pike, branch established on 2005/02/22. Info updated 2006/11/03: Bank assets: $1,646.2 mil, Deposits: $1,393.0 mil, headquarters in Union City, TN, positive income , Commercial Lending Specialization, 32 total offices , Holding Company: Community First Bancshares, Inc.
5 other banks with 5 local branches
For population 15 years and over in Gallatin:
Never married: 29.4%Now married: 51.3%Separated: 0.5%Widowed: 7.3%Divorced: 11.5% For population 25 years and over in Gallatin:
High school or higher: 89.9%Bachelor's degree or higher: 30.9%Graduate or professional degree: 9.7%Unemployed: 5.5%Mean travel time to work (commute): 20.1 minutes
Education Gini index (Inequality in education) Here:
11.3Tennessee average:
11.4
Religion statistics for Gallatin, TN (based on Sumner County data)
Religion Adherents Congregations Evangelical Protestant 54,140 135 Mainline Protestant 10,205 27 Catholic 5,500 2 Black Protestant 1,961 9 Other 1,579 6 None 87,260 -
Source: Clifford Grammich, Kirk Hadaway, Richard Houseal, Dale E.Jones, Alexei Krindatch, Richie Stanley and Richard H.Taylor. 2012. 2010 U.S.Religion Census: Religious Congregations & Membership Study. Association of Statisticians of American Religious Bodies. Jones, Dale E., et al. 2002. Congregations and Membership in the United States 2000. Nashville, TN: Glenmary Research Center. Graphs represent county-level data
Food Environment Statistics: Number of grocery stores : 27Sumner County :
1.77 / 10,000 pop.State :
1.99 / 10,000 pop.
Number of supercenters and club stores : 1Sumner County :
0.07 / 10,000 pop.Tennessee :
0.17 / 10,000 pop.
Number of convenience stores (no gas) : 6Here :
0.39 / 10,000 pop.Tennessee :
0.65 / 10,000 pop.
Number of convenience stores (with gas) : 65Sumner County :
4.26 / 10,000 pop.Tennessee :
5.16 / 10,000 pop.
Number of full-service restaurants : 86Sumner County :
5.64 / 10,000 pop.Tennessee :
6.56 / 10,000 pop.
Adult diabetes rate : Sumner County :
12.1%State :
11.4%
Adult obesity rate : This county :
28.2%Tennessee :
30.2%
Low-income preschool obesity rate : This county :
16.7%Tennessee :
13.5%
Health and Nutrition: Healthy diet rate : This city:
47.5%State:
49.3%
Average overall health of teeth and gums : This city:
43.5%Tennessee:
46.1%
Average BMI : Gallatin:
28.9Tennessee:
28.8
People feeling badly about themselves : Gallatin:
22.0%State:
21.0%
People not drinking alcohol at all : This city:
11.0%Tennessee:
10.5%
Average hours sleeping at night : Overweight people : Here:
33.5%Tennessee:
33.9%
General health condition : Gallatin:
54.2%Tennessee:
55.9%
Average condition of hearing : This city:
78.4%Tennessee:
79.1%
More about Health and Nutrition of Gallatin, TN Residents
Local government employment and payroll (March 2022)
Function
Full-time employees
Monthly full-time payroll
Average yearly full-time wage
Part-time employees
Monthly part-time payroll
Firefighters
93 $409,756 $52,872 0 $0 Police Protection - Officers
78 $422,298 $64,969 0 $0 Electric Power
47 $310,541 $79,287 0 $0 Water Supply
40 $184,359 $55,308 1 $1,217 Other and Unallocable
30 $144,230 $57,692 1 $2,759 Parks and Recreation
30 $135,286 $54,114 68 $41,075 Streets and Highways
29 $115,305 $47,712 0 $0 Sewerage
24 $108,810 $54,405 0 $0 Solid Waste Management
22 $79,132 $43,163 0 $0 Financial Administration
21 $94,411 $53,949 0 $0 Gas Supply
20 $86,404 $51,842 0 $0 Other Government Administration
18 $108,848 $72,565 17 $24,959 Police - Other
15 $72,133 $57,706 4 $3,366 Fire - Other
7 $44,735 $76,689 0 $0 Judicial and Legal
4 $28,974 $86,922 0 $0
Totals for Government
478 $2,345,220 $58,876 91 $73,376
Gallatin government finances - Expenditure in 2021 (per resident):
Construction - Sewerage: $9,059,000 ($187.97)
Water Utilities: $3,077,000 ($63.85)Electric Utilities: $2,672,000 ($55.44)Regular Highways: $1,893,000 ($39.28)Housing and Community Development: $1,886,000 ($39.13)Parks and Recreation: $1,464,000 ($30.38)Central Staff Services: $309,000 ($6.41)Local Fire Protection: $126,000 ($2.61)Gas Utilities: $50,000 ($1.04)Natural Resources - Other: $46,000 ($0.95)General Public Buildings: $45,000 ($0.93)Current Operations - Electric Utilities: $61,467,000 ($1275.41)
Gas Utilities: $12,549,000 ($260.39)Police Protection: $8,881,000 ($184.28)Local Fire Protection: $7,135,000 ($148.05)Water Utilities: $5,585,000 ($115.89)Central Staff Services: $4,572,000 ($94.87)Parks and Recreation: $4,238,000 ($87.94)Sewerage: $3,795,000 ($78.74)Regular Highways: $2,090,000 ($43.37)Solid Waste Management: $1,931,000 ($40.07)Protective Inspection and Regulation - Other: $1,487,000 ($30.85)Financial Administration: $1,019,000 ($21.14)Natural Resources - Other: $978,000 ($20.29)General - Other: $592,000 ($12.28)Housing and Community Development: $529,000 ($10.98)Judicial and Legal Services: $477,000 ($9.90)General Public Buildings: $421,000 ($8.74)Public Welfare - Other: $299,000 ($6.20)Gas Utilities - Interest on Debt: $274,000 ($5.69)
General - Interest on Debt: $684,000 ($14.19)
Other Capital Outlay - Police Protection: $918,000 ($19.05)
Local Fire Protection: $595,000 ($12.35)Solid Waste Management: $371,000 ($7.70)Gas Utilities: $215,000 ($4.46)Water Utilities: $146,000 ($3.03)Sewerage: $120,000 ($2.49)Regular Highways: $110,000 ($2.28)Natural Resources - Other: $33,000 ($0.68)General - Other: $33,000 ($0.68)Housing and Community Development: $9,000 ($0.19)Protective Inspection and Regulation - Other: $5,000 ($0.10)Central Staff Services: $3,000 ($0.06)Parks and Recreation: $1,000 ($0.02)Total Salaries and Wages: $23,205,000 ($481.49)
Water Utilities - Interest on Debt: $1,792,000 ($37.18)
Gallatin government finances - Revenue in 2021 (per resident):
Charges - Sewerage: $7,868,000 ($163.26)
Solid Waste Management: $2,349,000 ($48.74)Natural Resources - Other: $1,957,000 ($40.61)Parks and Recreation: $1,370,000 ($28.43)Miscellaneous Commercial Activities: $855,000 ($17.74)Other: $690,000 ($14.32)Federal Intergovernmental - General Local Government Support: $639,000 ($13.26)
Public Welfare: $432,000 ($8.96)Highways: $216,000 ($4.48)Local Intergovernmental - General Local Government Support: $1,809,000 ($37.54)
Revenue - Electric Utilities: $63,856,000 ($1324.98)
Gas Utilities: $15,308,000 ($317.63)Water Utilities: $11,163,000 ($231.63)State Intergovernmental - Highways: $7,248,000 ($150.39)
General Local Government Support: $6,236,000 ($129.39)Housing and Community Development: $326,000 ($6.76)Public Welfare: $17,000 ($0.35)Tax - Property: $13,039,000 ($270.55)
General Sales and Gross Receipts: $12,776,000 ($265.10)Other License: $3,243,000 ($67.29)Alcoholic Beverage Sales: $1,750,000 ($36.31)Public Utilities Sales: $508,000 ($10.54)Other Selective Sales: $241,000 ($5.00)Alcoholic Beverage License: $5,000 ($0.10)
Gallatin government finances - Debt in 2021 (per resident):
Long Term Debt - Outstanding Unspecified Public Purpose: $61,645,000 ($1279.10)
Beginning Outstanding - Unspecified Public Purpose: $55,330,000 ($1148.07)Issue, Unspecified Public Purpose: $9,725,000 ($201.79)Retired Unspecified Public Purpose: $3,410,000 ($70.76)
Gallatin government finances - Cash and Securities in 2021 (per resident):
Other Funds - Cash and Securities: $83,343,000 ($1729.32)
Businesses in Gallatin, TN
Name Count Name Count
ALDI 1 Hardee's 1 AT&T 1 Hilton 1 Ace Hardware 1 Jones New York 1 Advance Auto Parts 1 KFC 1 Arby's 2 Kroger 3 AutoZone 1 Little Caesars Pizza 1 Baskin-Robbins 1 Lowe's 1 Blockbuster 1 MasterBrand Cabinets 1 Buffalo Wild Wings 1 McDonald's 2 Burger King 1 Nissan 1 CVS 1 Pizza Hut 1 Chick-Fil-A 1 Publix Super Markets 1 Church's Chicken 1 Quiznos 1 ColorTyme 1 Rite Aid 1 Comfort Inn 1 SONIC Drive-In 2 Cracker Barrel 1 Sprint Nextel 1 Cricket Wireless 3 Starbucks 2 Curves 1 T-Mobile 1 Dairy Queen 1 Taco Bell 1 Discount Tire 1 Toyota 1 Domino's Pizza 1 U-Haul 3 Dunkin Donuts 1 UPS 3 FedEx 6 Vans 1 Firestone Complete Auto Care 1 Verizon Wireless 1 Ford 1 Waffle House 1 GNC 1 Walgreens 2 GameStop 1 Walmart 1 Goodwill 2 Wendy's 2 H&R Block 2
Strongest AM radio stations in Gallatin:
WMRO (1560 AM; 2 kW; GALLATIN, TN; Owner: CLASSIC BROADCASTING, INC.)
WYXE (1130 AM; daytime; 2 kW; GALLATIN, TN; Owner: JON GARY ENTERPRISES, INC.)
WHIN (1010 AM; 5 kW; GALLATIN, TN; Owner: WHIN, INC.)
WAMB (1160 AM; 50 kW; DONELSON, TN; Owner: GREAT SOUTHERN BROADCASTING COMPANY, INC.)
WLAC (1510 AM; 50 kW; NASHVILLE, TN; Owner: CAPSTAR TX LIMITED PARTNERSHIP)
WSM (650 AM; 50 kW; NASHVILLE, TN; Owner: GAYLORD ENTERTAINMENT COMPANY)
WKDA (1200 AM; 50 kW; NASHVILLE, TN; Owner: RADIO NASHVILLE, INC.)
WNQM (1300 AM; 50 kW; NASHVILLE, TN; Owner: WNQM. INC.)
WPLN (1430 AM; 15 kW; MADISON, TN)
WYFN (980 AM; 5 kW; NASHVILLE, TN; Owner: BIBLE BRADCASTING NETWORK, INC.)
WCOR (900 AM; 5 kW; LEBANON, TN)
WVOL (1470 AM; 5 kW; BERRY HILL, TN)
WWAM (820 AM; daytime; 50 kW; JASPER, TN; Owner: SHELTON BROADCASTING SYSTEM)
Strongest FM radio stations in Gallatin:
WVCP (88.5 FM; GALLATIN, TN; Owner: VOLUNTEER STATE COMMUNITY COLLEGE)
W230AD (93.9 FM; GALLATIN, TN; Owner: TREVECCA NAZARENE UNIVERSITY, INC.)
WGFX (104.5 FM; GALLATIN, TN; Owner: CITADEL BROADCASTING COMPANY)
WMAK (96.3 FM; MURFREESBORO, TN; Owner: SOUTH CENTRAL COMMUNICATIONS CORP.)
WRVW (107.5 FM; LEBANON, TN; Owner: CAPSTAR TX LIMITED PARTNERSHIP)
WMOT (89.5 FM; MURFREESBORO, TN; Owner: MIDDLE TENNESSEE STATE UNIVERSITY)
WSM-FM (95.5 FM; NASHVILLE, TN; Owner: CUMULUS LICENSING CORP.)
WNPL (106.7 FM; BELLE MEADE, TN; Owner: CUMULUS LICENSING CORP.)
WKDF (103.3 FM; NASHVILLE, TN; Owner: CITADEL BROADCASTING COMPANY)
WNRQ (105.9 FM; NASHVILLE, TN; Owner: CAPSTAR TX LIMITED PARTNERSHIP)
WSIX-FM (97.9 FM; NASHVILLE, TN; Owner: CAPSTAR TX LIMITED PARTNERSHIP)
WRQQ (97.1 FM; GOODLETTSVILLE, TN; Owner: CUMULUS LICENSING CORP.)
WPLN-FM (90.3 FM; NASHVILLE, TN; Owner: NASHVILLE PUBLIC RADIO)
WRLT (100.1 FM; FRANKLIN, TN; Owner: TUNED-IN BROADCASTING, INC)
WAYM (88.7 FM; COLUMBIA, TN; Owner: WAY-FM MEDIA GROUP, INC.)
WQQK (92.1 FM; HENDERSONVILLE, TN; Owner: PHOENIX OF HENDERSONVILLE, INC.)
WJXA (92.9 FM; NASHVILLE, TN; Owner: SOUTH CENTRAL COMMUNICATIONS CORP.)
WUBT (101.1 FM; RUSSELLVILLE, KY; Owner: CAPSTAR TX LIMITED PARTNERSHIP)
WANT (98.9 FM; LEBANON, TN; Owner: BAY-POINTE BROADCASTING, INC.)
WRVU (91.1 FM; NASHVILLE, TN; Owner: VANDERBILT STUDENT COMMUNICATIONS, INC.)
TV broadcast stations around Gallatin:
WPGD (Channel 50; HENDERSONVILLE, TN; Owner: TRINITY BROADCASTING NETWORK)
WTVF (Channel 5; NASHVILLE, TN; Owner: NEWSCHANNEL 5 NETWORK, LP)
WNPX (Channel 28; COOKEVILLE, TN; Owner: PAXSON COMMUNICATIONS LICENSE COMPANY, LLC)
WUXP-TV (Channel 30; NASHVILLE, TN; Owner: WUXP LICENSEE, LLC)
WSMV-TV (Channel 4; NASHVILLE, TN; Owner: MEREDITH CORPORATION)
WHTN (Channel 39; MURFREESBORO, TN; Owner: CHRISTIAN TELEVISION NETWORK, INC.)
WZTV (Channel 17; NASHVILLE, TN; Owner: WZTV LICENSEE, LLC)
WIIW-LP (Channel 14; NASHVILLE, TN; Owner: EQUITY BROADCASTING CORPORATION)
WNPX-LP (Channel 20; NASHVILLE, TN; Owner: PAXSON COMMUNICATIONS LPTV, INC.)
WKRN-TV (Channel 2; NASHVILLE, TN; Owner: WKRN, G.P.)
WNAB (Channel 58; NASHVILLE, TN; Owner: NASHVILLE LICENSE HOLDINGS, L.L.C.)
WNPT (Channel 8; NASHVILLE, TN; Owner: NASHVILLE PUBLIC TELEVISION, INC.)
W36AK (Channel 36; NASHVILLE, TN; Owner: TRINITY BROADCASTING NETWORK)
WGAP-LP (Channel 26; NASHVILLE, TN; Owner: SOUTH CENTRAL COMMUNICATIONS CORP.)
WJDE-LP (Channel 24; NASHVILLE, TN; Owner: SOUTH CENTRAL COMMUNICATIONS CORP.)
WRMX-LP (Channel 12; NASHVILLE, TN; Owner: SOUTH CENTRAL COMMUNICATIONS CORP.)
WJFB (Channel 66; LEBANON, TN; Owner: BRYANT BROADCASTING, INC.)
WJNK-LP (Channel 61; NASHVILLE, TN; Owner: THREE ANGELS BROADCASTING NETWORK, INC.)
W52CT (Channel 52; NASHVILLE, TN; Owner: JKB ASSOCIATES, INC.)
National Bridge Inventory (NBI) Statistics 73 Number of bridges794ft / 242m Total length $20,044,000 Total costs600,632 Total average daily traffic47,761 Total average daily truck traffic
New bridges - historical statistics
5 1930-1939 2 1940-1949 6 1950-1959 8 1960-1969 7 1970-1979 11 1980-1989 20 1990-1999 10 2000-2009 4 2010-2019
See full National Bridge Inventory statistics for Gallatin, TN
Home Mortgage Disclosure Act Aggregated Statistics For Year 2009(Based on 1 full and 4 partial tracts) A) FHA, FSA/RHS & VA B) Conventional C) Refinancings D) Home Improvement Loans E) Loans on Dwellings For 5+ Families F) Non-occupant Loans on G) Loans On Manufactured Number Average Value Number Average Value Number Average Value Number Average Value Number Average Value Number Average Value Number Average Value
LOANS ORIGINATED 94 $139,702 65 $134,931 263 $142,646 28 $41,590 0 $0 39 $116,126 3 $31,290 APPLICATIONS APPROVED, NOT ACCEPTED 4 $158,895 5 $136,534 28 $129,031 4 $31,700 0 $0 2 $144,375 0 $0 APPLICATIONS DENIED 4 $114,018 11 $83,056 102 $129,054 23 $35,252 1 $418,010 5 $108,076 2 $9,940 APPLICATIONS WITHDRAWN 13 $130,397 10 $229,574 86 $143,858 5 $44,968 1 $3,317,860 6 $149,910 1 $189,550 FILES CLOSED FOR INCOMPLETENESS 2 $153,145 1 $167,570 12 $126,644 0 $0 0 $0 2 $115,005 0 $0
Aggregated Statistics For Year 2008(Based on 1 full and 4 partial tracts) A) FHA, FSA/RHS & VA B) Conventional C) Refinancings D) Home Improvement Loans E) Loans on Dwellings For 5+ Families F) Non-occupant Loans on G) Loans On Manufactured Number Average Value Number Average Value Number Average Value Number Average Value Number Average Value Number Average Value Number Average Value
LOANS ORIGINATED 82 $143,112 126 $154,452 232 $121,576 24 $28,585 3 $312,733 73 $103,923 10 $66,140 APPLICATIONS APPROVED, NOT ACCEPTED 2 $158,375 8 $184,225 35 $147,897 3 $89,103 0 $0 2 $91,170 2 $47,820 APPLICATIONS DENIED 15 $118,666 19 $111,867 150 $132,013 35 $28,420 0 $0 18 $133,377 16 $49,556 APPLICATIONS WITHDRAWN 15 $155,282 16 $201,247 50 $137,748 5 $72,400 0 $0 9 $172,330 2 $132,165 FILES CLOSED FOR INCOMPLETENESS 2 $269,290 7 $151,210 13 $153,759 4 $98,982 0 $0 3 $53,910 0 $0
Aggregated Statistics For Year 2007(Based on 1 full and 4 partial tracts) A) FHA, FSA/RHS & VA B) Conventional C) Refinancings D) Home Improvement Loans E) Loans on Dwellings For 5+ Families F) Non-occupant Loans on G) Loans On Manufactured Number Average Value Number Average Value Number Average Value Number Average Value Number Average Value Number Average Value Number Average Value
LOANS ORIGINATED 51 $142,126 268 $120,979 206 $126,561 32 $44,278 3 $715,450 102 $104,222 10 $83,962 APPLICATIONS APPROVED, NOT ACCEPTED 1 $100,650 20 $162,430 39 $107,439 8 $56,769 0 $0 6 $103,283 1 $8,080 APPLICATIONS DENIED 8 $114,090 51 $116,495 169 $117,426 32 $39,000 1 $528,980 22 $70,776 15 $64,150 APPLICATIONS WITHDRAWN 5 $108,506 34 $121,956 80 $117,196 7 $85,949 1 $612,410 14 $108,169 1 $62,450 FILES CLOSED FOR INCOMPLETENESS 3 $144,777 13 $116,305 22 $117,359 1 $161,630 0 $0 2 $99,655 0 $0
Aggregated Statistics For Year 2006(Based on 1 full and 4 partial tracts) A) FHA, FSA/RHS & VA B) Conventional C) Refinancings D) Home Improvement Loans E) Loans on Dwellings For 5+ Families F) Non-occupant Loans on G) Loans On Manufactured Number Average Value Number Average Value Number Average Value Number Average Value Number Average Value Number Average Value Number Average Value
LOANS ORIGINATED 37 $116,214 341 $99,864 249 $98,596 49 $34,954 1 $667,500 114 $85,263 11 $56,040 APPLICATIONS APPROVED, NOT ACCEPTED 1 $121,230 50 $104,915 55 $125,359 6 $51,988 0 $0 12 $82,425 4 $53,895 APPLICATIONS DENIED 6 $92,137 93 $92,973 211 $101,310 50 $34,606 0 $0 39 $74,144 26 $70,654 APPLICATIONS WITHDRAWN 6 $111,918 43 $103,958 139 $125,899 9 $62,276 0 $0 17 $102,842 2 $107,510 FILES CLOSED FOR INCOMPLETENESS 2 $212,055 13 $122,840 28 $121,390 0 $0 0 $0 3 $105,863 1 $76,410
Aggregated Statistics For Year 2005(Based on 1 full and 4 partial tracts) A) FHA, FSA/RHS & VA B) Conventional C) Refinancings D) Home Improvement Loans E) Loans on Dwellings For 5+ Families F) Non-occupant Loans on G) Loans On Manufactured Number Average Value Number Average Value Number Average Value Number Average Value Number Average Value Number Average Value Number Average Value
LOANS ORIGINATED 51 $110,941 321 $101,628 261 $101,749 44 $33,261 3 $343,053 82 $82,881 12 $63,071 APPLICATIONS APPROVED, NOT ACCEPTED 2 $112,775 45 $129,862 63 $83,558 11 $65,105 0 $0 12 $64,826 6 $53,492 APPLICATIONS DENIED 7 $101,600 81 $86,980 254 $103,714 41 $24,812 1 $208,420 16 $67,642 20 $43,148 APPLICATIONS WITHDRAWN 9 $107,828 62 $114,268 198 $111,870 16 $150,011 0 $0 21 $99,428 2 $61,400 FILES CLOSED FOR INCOMPLETENESS 0 $0 12 $97,136 24 $121,760 2 $123,045 0 $0 1 $59,980 1 $77,140
Aggregated Statistics For Year 2004(Based on 1 full and 4 partial tracts) A) FHA, FSA/RHS & VA B) Conventional C) Refinancings D) Home Improvement Loans E) Loans on Dwellings For 5+ Families F) Non-occupant Loans on G) Loans On Manufactured Number Average Value Number Average Value Number Average Value Number Average Value Number Average Value Number Average Value Number Average Value
LOANS ORIGINATED 67 $110,164 265 $101,969 297 $95,765 60 $26,894 2 $173,215 74 $87,331 15 $55,185 APPLICATIONS APPROVED, NOT ACCEPTED 5 $101,252 33 $96,537 79 $88,624 8 $41,499 1 $106,920 10 $68,329 9 $56,089 APPLICATIONS DENIED 16 $106,524 75 $96,050 272 $91,935 40 $29,298 1 $148,870 31 $77,638 32 $55,813 APPLICATIONS WITHDRAWN 9 $107,556 37 $121,051 172 $99,479 5 $28,652 0 $0 5 $89,072 8 $75,894 FILES CLOSED FOR INCOMPLETENESS 0 $0 10 $90,932 17 $93,978 2 $48,020 0 $0 1 $93,380 0 $0
Aggregated Statistics For Year 2003(Based on 1 full and 4 partial tracts) A) FHA, FSA/RHS & VA B) Conventional C) Refinancings D) Home Improvement Loans E) Loans on Dwellings For 5+ Families F) Non-occupant Loans on Number Average Value Number Average Value Number Average Value Number Average Value Number Average Value Number Average Value
LOANS ORIGINATED 67 $105,617 170 $102,891 542 $100,074 24 $16,628 2 $320,225 83 $76,286 APPLICATIONS APPROVED, NOT ACCEPTED 1 $132,980 24 $98,186 107 $90,293 2 $48,860 0 $0 10 $62,883 APPLICATIONS DENIED 10 $101,197 70 $87,057 241 $89,270 27 $21,187 0 $0 33 $71,189 APPLICATIONS WITHDRAWN 9 $108,314 25 $118,164 143 $98,600 5 $13,906 0 $0 10 $82,094 FILES CLOSED FOR INCOMPLETENESS 1 $93,310 10 $98,857 32 $85,827 0 $0 0 $0 2 $56,180
Aggregated Statistics For Year 2002(Based on 1 full and 4 partial tracts) A) FHA, FSA/RHS & VA B) Conventional C) Refinancings D) Home Improvement Loans E) Loans on Dwellings For 5+ Families F) Non-occupant Loans on Number Average Value Number Average Value Number Average Value Number Average Value Number Average Value Number Average Value
LOANS ORIGINATED 83 $104,467 153 $93,241 371 $94,758 22 $24,147 4 $256,017 74 $70,023 APPLICATIONS APPROVED, NOT ACCEPTED 1 $86,690 26 $96,413 69 $94,713 6 $31,782 0 $0 5 $53,774 APPLICATIONS DENIED 10 $100,703 64 $68,220 180 $80,508 23 $13,524 0 $0 14 $64,020 APPLICATIONS WITHDRAWN 7 $115,546 20 $93,706 99 $93,541 4 $11,252 0 $0 4 $52,048 FILES CLOSED FOR INCOMPLETENESS 1 $75,460 10 $98,532 18 $87,113 0 $0 0 $0 2 $81,500
Aggregated Statistics For Year 2001(Based on 1 full and 4 partial tracts) A) FHA, FSA/RHS & VA B) Conventional C) Refinancings D) Home Improvement Loans E) Loans on Dwellings For 5+ Families F) Non-occupant Loans on Number Average Value Number Average Value Number Average Value Number Average Value Number Average Value Number Average Value
LOANS ORIGINATED 96 $105,526 145 $80,674 348 $95,545 23 $20,115 3 $178,617 63 $64,553 APPLICATIONS APPROVED, NOT ACCEPTED 2 $115,580 26 $73,451 49 $78,806 5 $17,836 0 $0 4 $54,642 APPLICATIONS DENIED 10 $83,323 83 $52,758 182 $78,029 30 $18,039 0 $0 16 $52,198 APPLICATIONS WITHDRAWN 8 $124,406 29 $89,229 96 $87,317 4 $25,325 0 $0 2 $77,565 FILES CLOSED FOR INCOMPLETENESS 4 $75,385 6 $57,387 20 $82,386 0 $0 0 $0 2 $85,960
Aggregated Statistics For Year 2000(Based on 1 full and 4 partial tracts) A) FHA, FSA/RHS & VA B) Conventional C) Refinancings D) Home Improvement Loans E) Loans on Dwellings For 5+ Families F) Non-occupant Loans on Number Average Value Number Average Value Number Average Value Number Average Value Number Average Value Number Average Value
LOANS ORIGINATED 69 $95,636 174 $87,011 145 $68,608 34 $16,864 1 $194,890 41 $55,882 APPLICATIONS APPROVED, NOT ACCEPTED 8 $48,905 43 $61,694 52 $74,057 20 $14,578 0 $0 4 $70,815 APPLICATIONS DENIED 13 $78,996 133 $49,220 169 $71,905 36 $16,296 0 $0 7 $53,900 APPLICATIONS WITHDRAWN 8 $89,660 25 $73,666 96 $74,342 3 $45,010 0 $0 4 $78,005 FILES CLOSED FOR INCOMPLETENESS 2 $76,450 9 $105,206 40 $71,391 0 $0 0 $0 3 $56,450
Aggregated Statistics For Year 1999(Based on 1 full and 4 partial tracts) A) FHA, FSA/RHS & VA B) Conventional C) Refinancings D) Home Improvement Loans E) Loans on Dwellings For 5+ Families F) Non-occupant Loans on Number Average Value Number Average Value Number Average Value Number Average Value Number Average Value Number Average Value
LOANS ORIGINATED 90 $96,506 199 $77,541 246 $78,565 48 $15,795 3 $278,337 44 $56,165 APPLICATIONS APPROVED, NOT ACCEPTED 1 $78,440 38 $73,979 81 $67,468 10 $14,143 1 $5,860 7 $53,389 APPLICATIONS DENIED 9 $104,843 163 $56,310 177 $67,144 27 $9,807 0 $0 16 $46,897 APPLICATIONS WITHDRAWN 8 $102,484 21 $79,104 120 $71,600 2 $63,310 0 $0 3 $46,130 FILES CLOSED FOR INCOMPLETENESS 2 $121,505 8 $72,716 22 $71,382 1 $60,790 0 $0 0 $0
Detailed HMDA statistics for the following Tracts:
0207.00
, 0208.00 , 0209.01 , 0209.02 , 0212.03
Private Mortgage Insurance Companies Aggregated Statistics For Year 2009(Based on 1 full and 4 partial tracts) A) Conventional B) Refinancings Number Average Value Number Average Value
LOANS ORIGINATED 5 $172,340 9 $165,963 APPLICATIONS APPROVED, NOT ACCEPTED 1 $208,940 4 $169,068 APPLICATIONS DENIED 1 $84,760 1 $96,250 APPLICATIONS WITHDRAWN 1 $149,590 1 $157,150 FILES CLOSED FOR INCOMPLETENESS 0 $0 1 $385,720
Aggregated Statistics For Year 2008(Based on 1 full and 4 partial tracts) A) Conventional B) Refinancings C) Non-occupant Loans on Number Average Value Number Average Value Number Average Value
LOANS ORIGINATED 41 $148,230 20 $137,456 5 $93,976 APPLICATIONS APPROVED, NOT ACCEPTED 15 $135,772 10 $161,636 1 $67,670 APPLICATIONS DENIED 2 $130,410 0 $0 1 $65,640 APPLICATIONS WITHDRAWN 4 $172,532 0 $0 0 $0 FILES CLOSED FOR INCOMPLETENESS 1 $132,790 0 $0 1 $70,530
Aggregated Statistics For Year 2007(Based on 1 full and 4 partial tracts) A) Conventional B) Refinancings C) Non-occupant Loans on Number Average Value Number Average Value Number Average Value
LOANS ORIGINATED 85 $124,915 16 $138,054 9 $103,706 APPLICATIONS APPROVED, NOT ACCEPTED 9 $148,022 8 $122,592 1 $94,780 APPLICATIONS DENIED 0 $0 1 $96,980 0 $0 APPLICATIONS WITHDRAWN 2 $167,295 0 $0 0 $0 FILES CLOSED FOR INCOMPLETENESS 0 $0 1 $93,430 0 $0
Aggregated Statistics For Year 2006(Based on 1 full and 4 partial tracts) A) Conventional B) Refinancings C) Non-occupant Loans on Number Average Value Number Average Value Number Average Value
LOANS ORIGINATED 50 $124,333 15 $115,775 4 $69,285 APPLICATIONS APPROVED, NOT ACCEPTED 8 $123,698 3 $125,757 2 $141,225 APPLICATIONS DENIED 1 $357,740 1 $55,840 0 $0 APPLICATIONS WITHDRAWN 1 $170,250 0 $0 0 $0 FILES CLOSED FOR INCOMPLETENESS 0 $0 0 $0 0 $0
Aggregated Statistics For Year 2005(Based on 1 full and 4 partial tracts) A) Conventional B) Refinancings C) Non-occupant Loans on Number Average Value Number Average Value Number Average Value
LOANS ORIGINATED 43 $120,366 17 $111,179 9 $103,814 APPLICATIONS APPROVED, NOT ACCEPTED 7 $107,664 1 $99,370 0 $0 APPLICATIONS DENIED 0 $0 0 $0 0 $0 APPLICATIONS WITHDRAWN 1 $114,620 1 $71,280 0 $0 FILES CLOSED FOR INCOMPLETENESS 1 $100,650 0 $0 0 $0
Aggregated Statistics For Year 2004(Based on 1 full and 4 partial tracts) A) Conventional B) Refinancings C) Non-occupant Loans on D) Loans On Manufactured Number Average Value Number Average Value Number Average Value Number Average Value
LOANS ORIGINATED 38 $115,791 28 $112,205 8 $93,550 1 $119,760 APPLICATIONS APPROVED, NOT ACCEPTED 5 $91,442 8 $109,641 1 $28,420 0 $0 APPLICATIONS DENIED 1 $98,800 1 $55,490 0 $0 1 $55,490 APPLICATIONS WITHDRAWN 2 $146,210 1 $114,400 1 $50,080 0 $0 FILES CLOSED FOR INCOMPLETENESS 1 $96,320 1 $105,950 0 $0 0 $0
Aggregated Statistics For Year 2003(Based on 1 full and 4 partial tracts) A) Conventional B) Refinancings C) Non-occupant Loans on Number Average Value Number Average Value Number Average Value
LOANS ORIGINATED 41 $110,451 64 $121,350 6 $65,725 APPLICATIONS APPROVED, NOT ACCEPTED 1 $126,610 10 $97,500 1 $29,100 APPLICATIONS DENIED 1 $33,840 1 $95,360 1 $33,840 APPLICATIONS WITHDRAWN 1 $77,890 5 $96,848 1 $27,740 FILES CLOSED FOR INCOMPLETENESS 0 $0 0 $0 0 $0
Aggregated Statistics For Year 2002(Based on 1 full and 4 partial tracts) A) Conventional B) Refinancings C) Non-occupant Loans on Number Average Value Number Average Value Number Average Value
LOANS ORIGINATED 34 $105,760 37 $112,576 4 $64,615 APPLICATIONS APPROVED, NOT ACCEPTED 2 $125,595 6 $108,062 0 $0 APPLICATIONS DENIED 2 $113,860 1 $169,720 0 $0 APPLICATIONS WITHDRAWN 3 $135,217 2 $70,535 1 $92,710 FILES CLOSED FOR INCOMPLETENESS 0 $0 0 $0 0 $0
Aggregated Statistics For Year 2001(Based on 1 full and 4 partial tracts) A) Conventional B) Refinancings C) Non-occupant Loans on Number Average Value Number Average Value Number Average Value
LOANS ORIGINATED 27 $120,372 42 $102,228 2 $90,135 APPLICATIONS APPROVED, NOT ACCEPTED 2 $67,480 5 $109,604 0 $0 APPLICATIONS DENIED 0 $0 1 $123,410 0 $0 APPLICATIONS WITHDRAWN 0 $0 1 $51,430 0 $0 FILES CLOSED FOR INCOMPLETENESS 1 $110,300 0 $0 0 $0
Aggregated Statistics For Year 2000(Based on 1 full and 4 partial tracts) A) Conventional B) Refinancings C) Non-occupant Loans on Number Average Value Number Average Value Number Average Value
LOANS ORIGINATED 31 $107,127 10 $95,829 2 $69,245 APPLICATIONS APPROVED, NOT ACCEPTED 1 $261,570 2 $105,490 0 $0 APPLICATIONS DENIED 1 $102,260 1 $66,120 0 $0 APPLICATIONS WITHDRAWN 1 $105,280 0 $0 0 $0 FILES CLOSED FOR INCOMPLETENESS 0 $0 0 $0 0 $0
Aggregated Statistics For Year 1999(Based on 1 full and 4 partial tracts) A) Conventional B) Refinancings C) Non-occupant Loans on Number Average Value Number Average Value Number Average Value
LOANS ORIGINATED 37 $117,029 28 $90,351 3 $88,803 APPLICATIONS APPROVED, NOT ACCEPTED 2 $56,870 2 $103,865 0 $0 APPLICATIONS DENIED 2 $101,990 2 $95,625 0 $0 APPLICATIONS WITHDRAWN 0 $0 1 $101,170 0 $0 FILES CLOSED FOR INCOMPLETENESS 0 $0 0 $0 0 $0
Detailed PMIC statistics for the following Tracts:
0207.00
, 0208.00 , 0209.01 , 0209.02 , 0212.03 Fire-safe hotels and motels in Gallatin, Tennessee:
America's Best Value Inn, 101 W Broadway, Gallatin, Tennessee 37066 Phone: (615) 452-4521, Fax: (615) 451-1770
Baymont Inn & Suites, 354 Sumner Hall Dr, Gallatin, Tennessee 37066 Phone: (615) 230-8300, Fax: (615) 230-8338
Hampton Inn Gallatin, 980 Vlg Green Xing, Gallatin, Tennessee 37066 Phone: (615) 206-9595, Fax: (615) 206-9599
Guesthouse International Inn, 221 W Main St, Gallatin, Tennessee 37066 Phone: (615) 452-5434, Fax: (615) 452-1665
Hilton Garden Inn, 1460 Tulip Poplar Dr, Gallatin, Tennessee 37066 Phone: (615) 265-0342, Fax: (615) 265-0343
Quality Inn, 1001 Vlg Grn Xing, Gallatin, Tennessee 37066 Phone: (615) 451-4494, Fax: (615) 451-4482
All 6 fire-safe hotels and motels in Gallatin, Tennessee
Most common first names in Gallatin, TN among deceased individuals Name Count Lived (average)
James 302 71.4 years Mary 262 79.4 years William 246 73.6 years John 214 73.6 years Robert 149 70.4 years Charles 113 69.1 years Willie 107 75.6 years George 83 76.7 years Thomas 82 72.4 years Ruth 74 81.0 years
Most common last names in Gallatin, TN among deceased individuals Last name Count Lived (average)
Brown 132 77.5 years Smith 95 69.7 years Jones 93 76.9 years Williams 83 68.6 years Carter 74 72.1 years Gregory 74 71.3 years Johnson 73 75.4 years Wright 52 76.1 years Hall 49 74.2 years Durham 48 79.2 years
Gallatin compared to Tennessee state average:
Unemployed percentage below state average. Black race population percentage above state average. Hispanic race population percentage significantly above state average. Foreign-born population percentage significantly above state average. House age below state average. Institutionalized population percentage above state average. Number of college students above state average.
#101 on the list of "Top 101 cities with the largest city-data.com crime index decrease from 2002 to 2012 (population 5,000+)"
#77 on the list of "Top 101 counties with the largest number of people moving in compared to moving out (pop. 50,000+)"
#83 on the list of "Top 101 counties with the lowest percentage of residents relocating from foreign countries between 2010 and 2011 (pop. 50,000+)"
#91 on the list of "Top 101 counties with highest percentage of residents voting for Romney (Republican) in the 2012 Presidential Election (pop. 50,000+)"
Top Patent Applicants
Dean Solon (14)
Joseph W. Cole (5)
James R. Baechle (4)
L. Jackson Roberts (4)
Joe Bebee (3)
Sinu Bessy Abraham (3)
R. Kevin Ray (3)
Jeffrey D. Hollis (3)
Jonathan E. Jaffe (3)
Uwe R. Muller (3)
Total of 106 patent applications in 2008-2024.

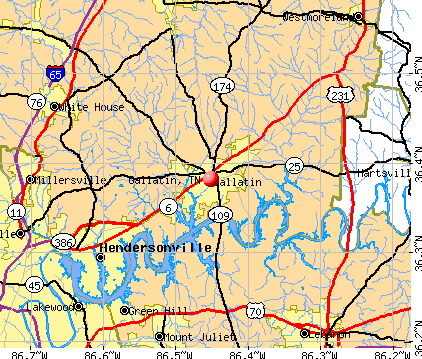


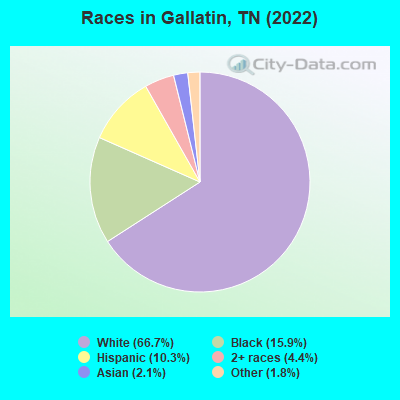
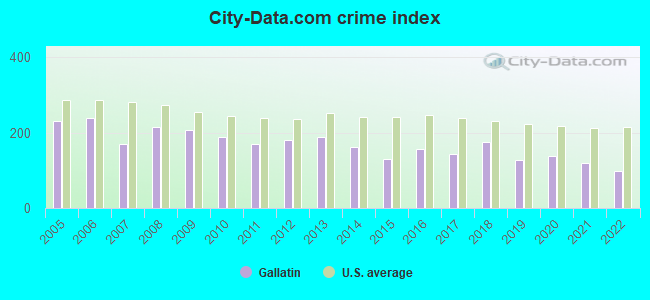
 Recent articles from our blog. Our writers, many of them Ph.D. graduates or candidates, create easy-to-read articles on a wide variety of topics.

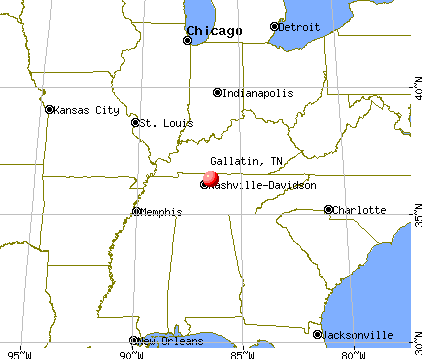
 (23.4 miles
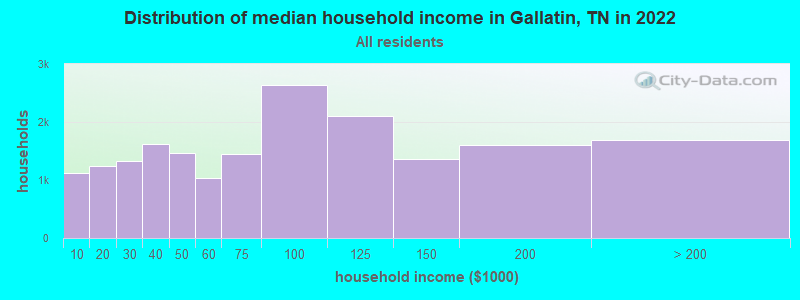
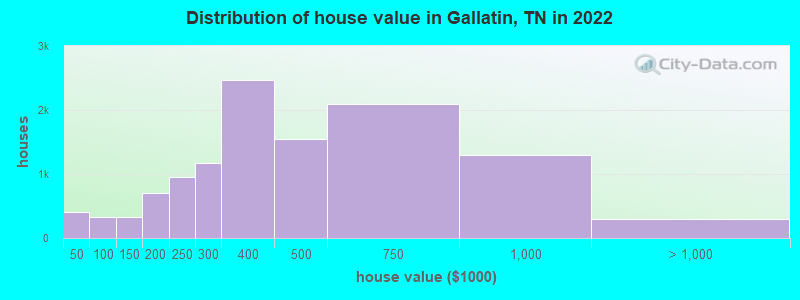
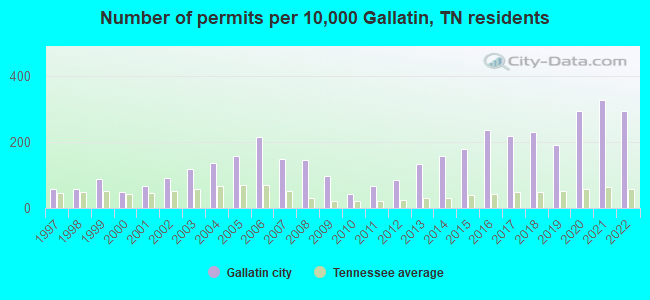
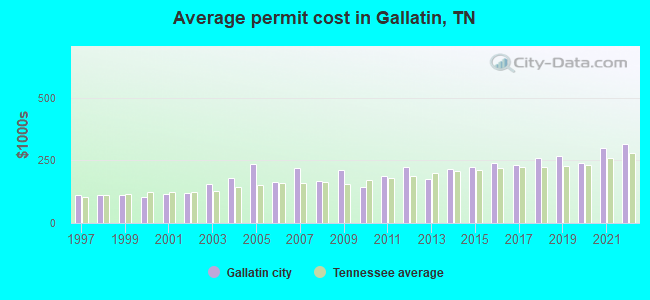
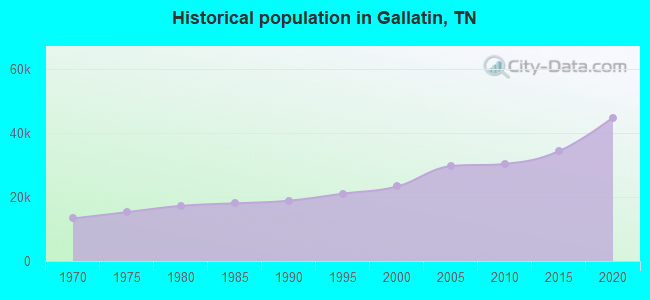
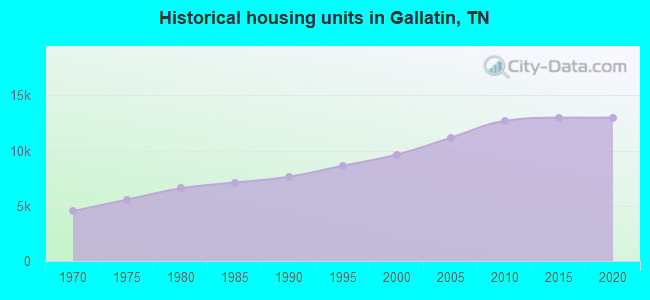
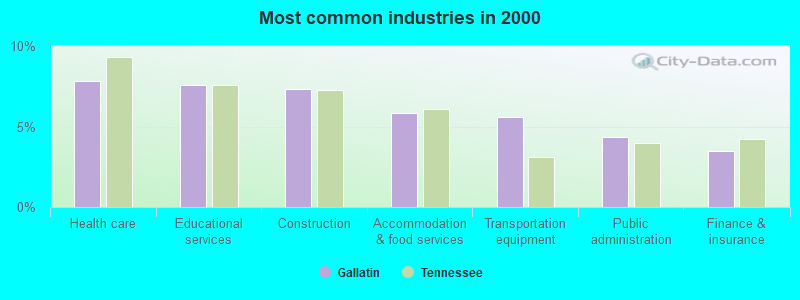
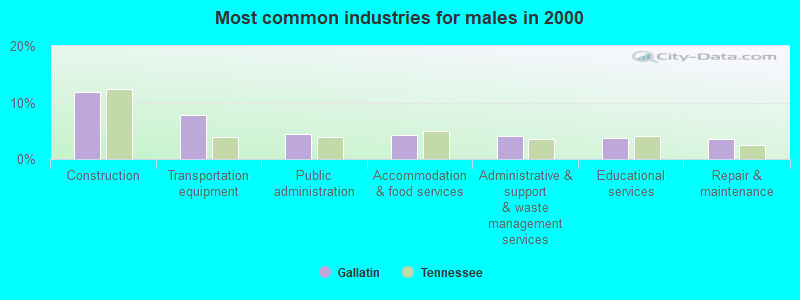
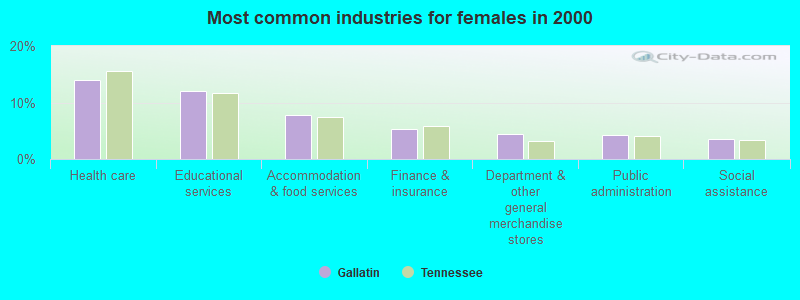
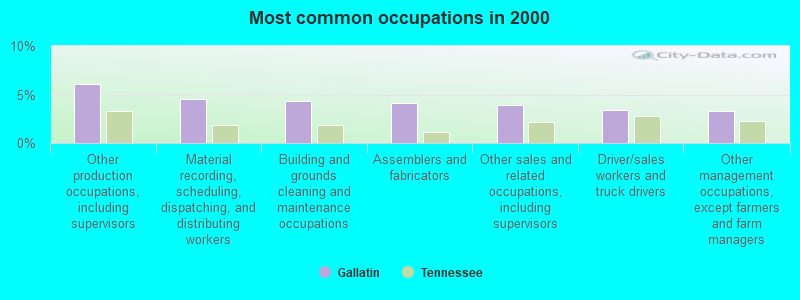

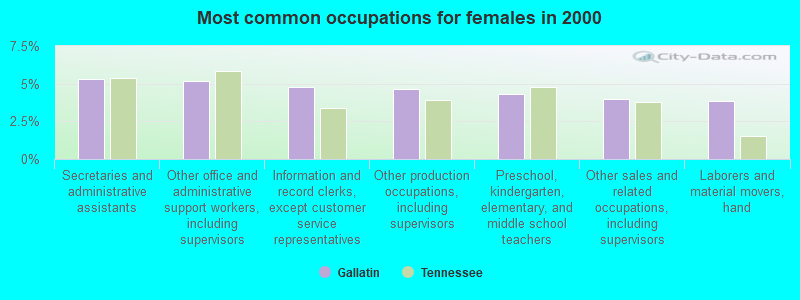
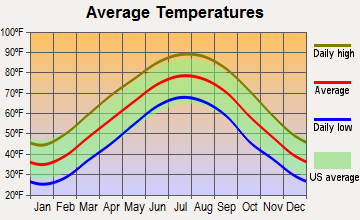
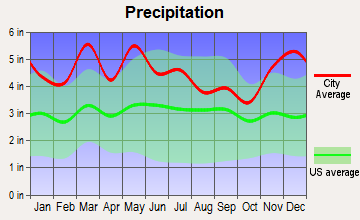
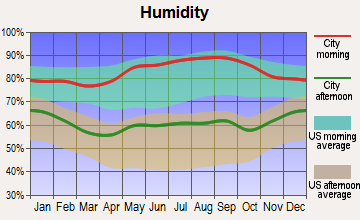
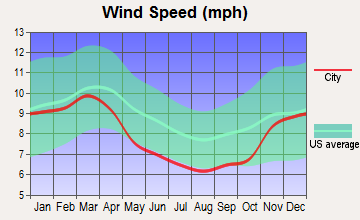
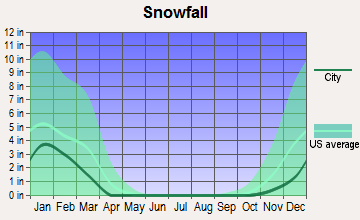
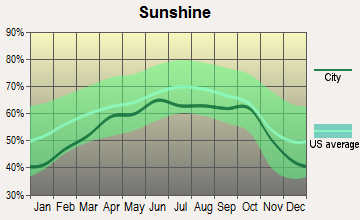
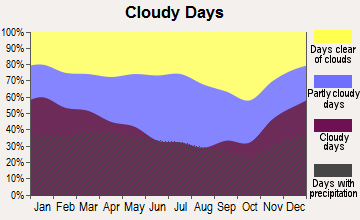
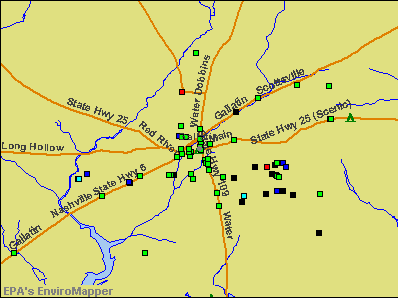

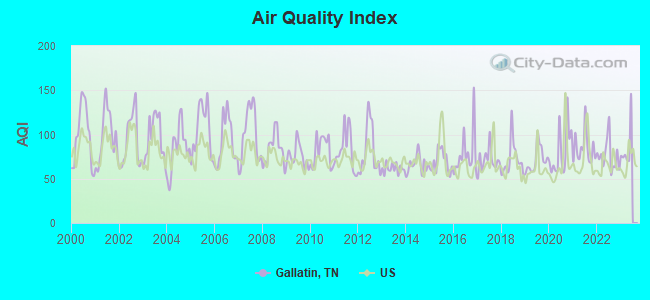
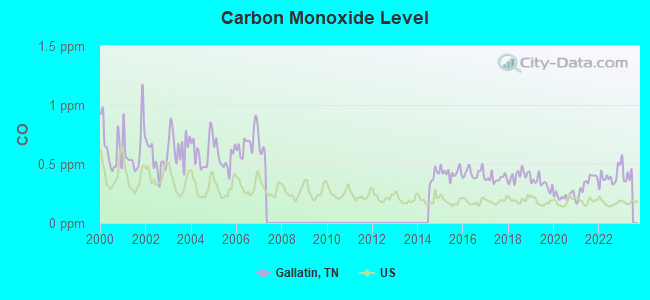
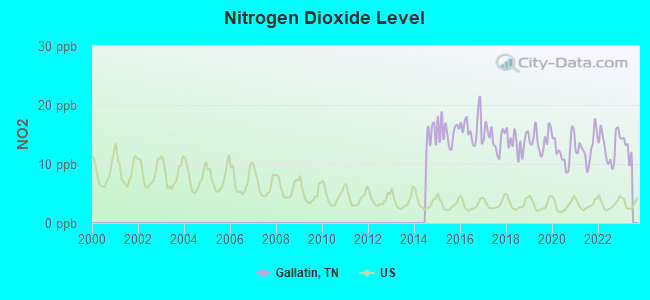
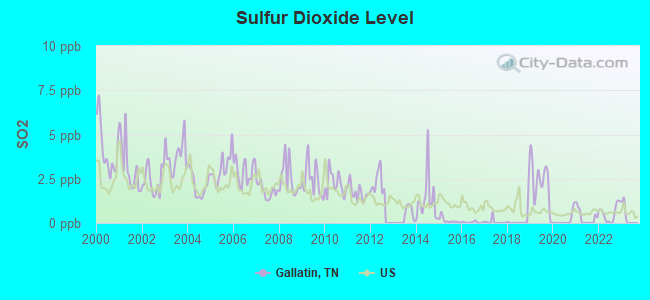
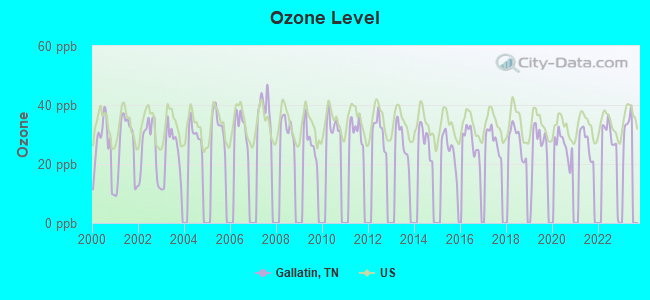
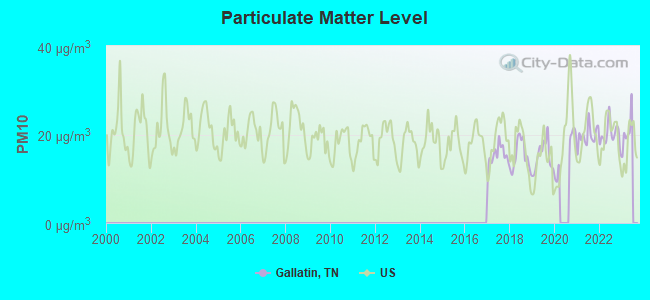
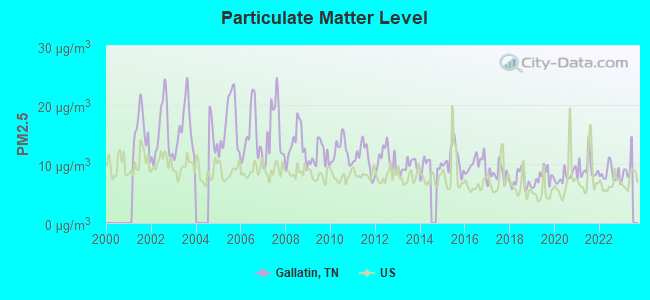
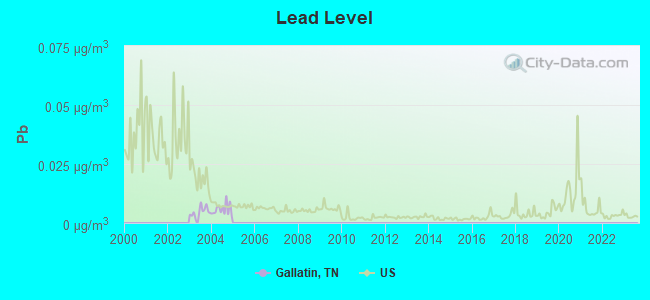
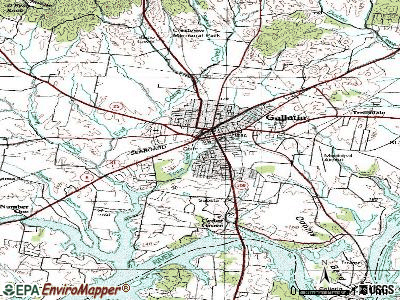
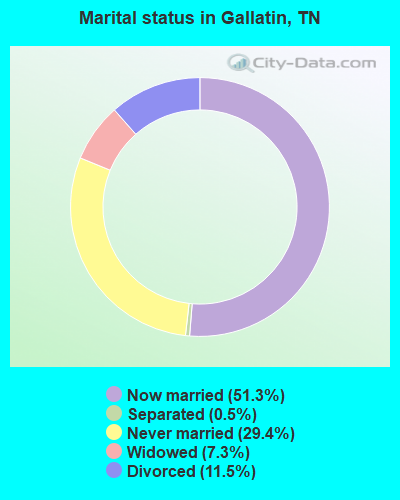
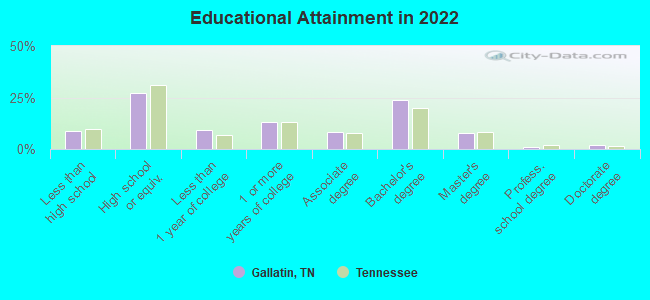
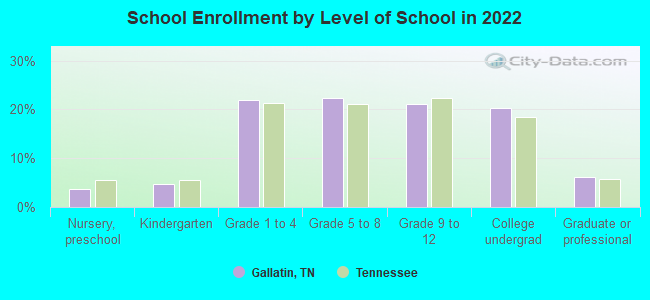
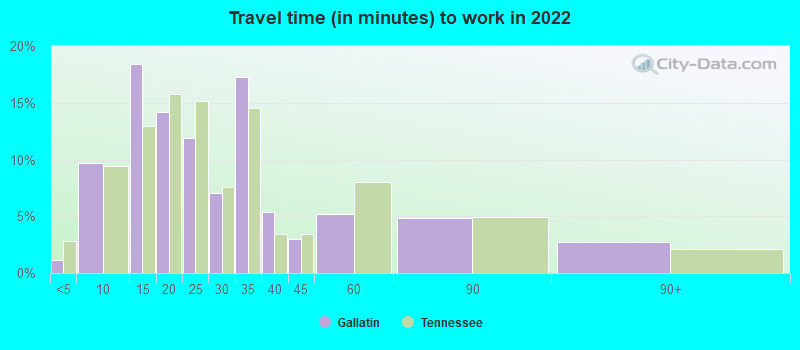
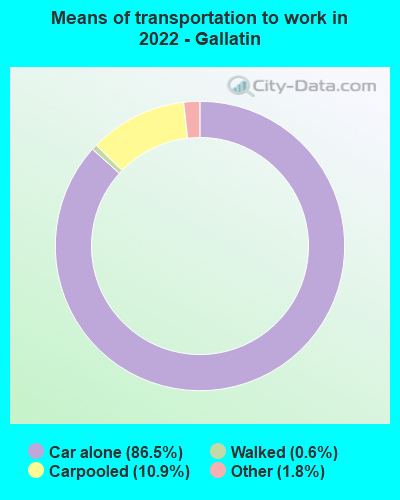
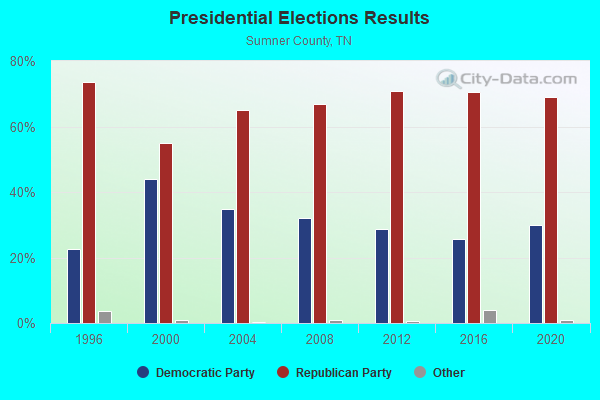
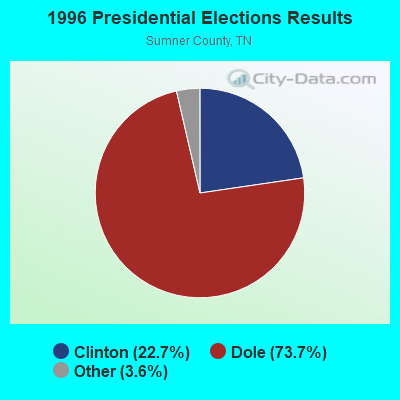
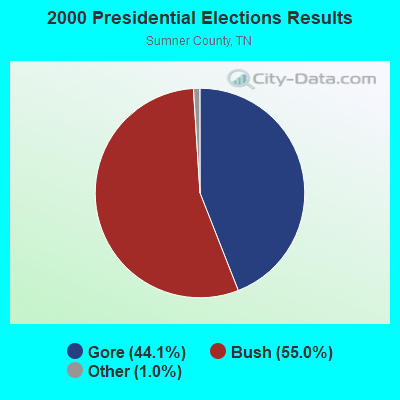
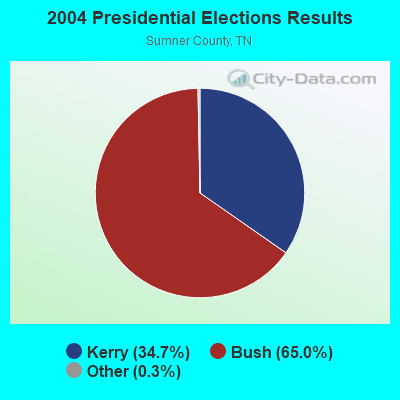
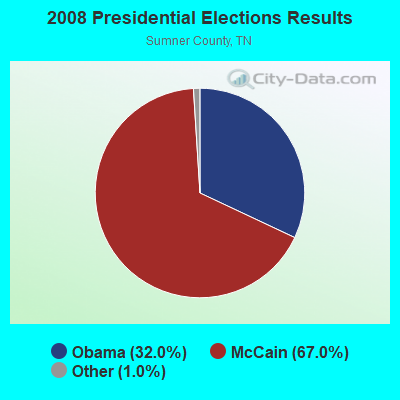

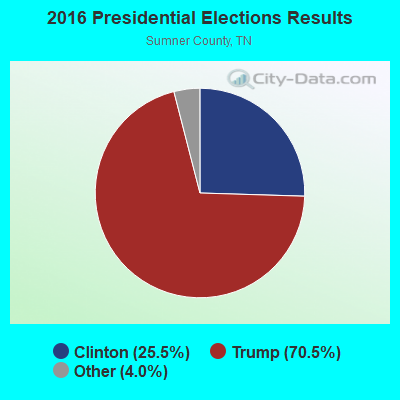
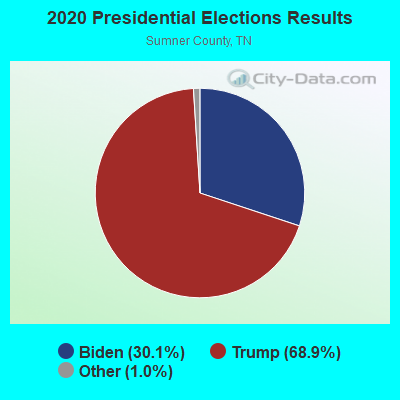
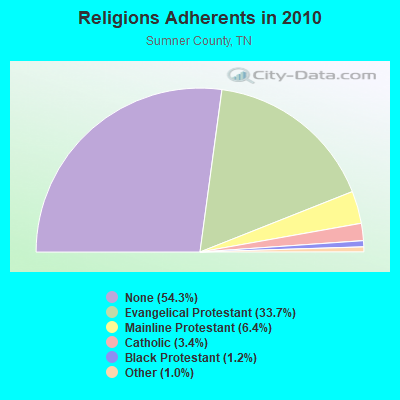
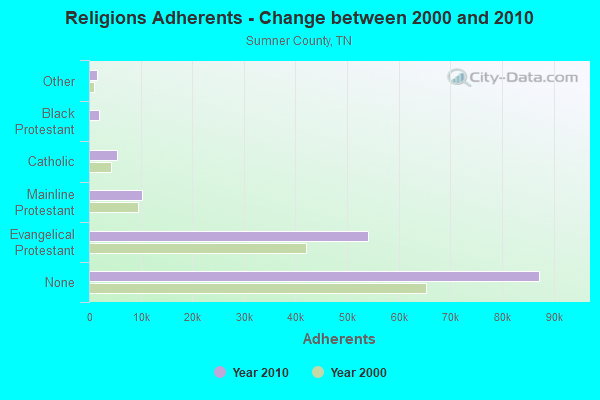
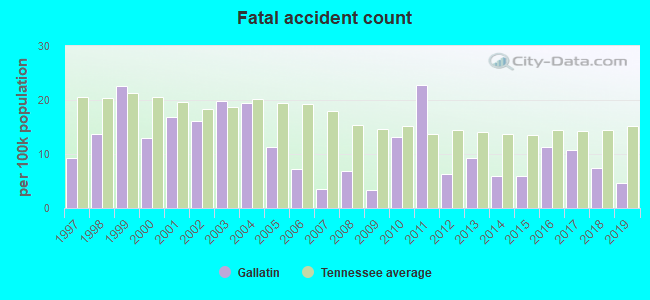
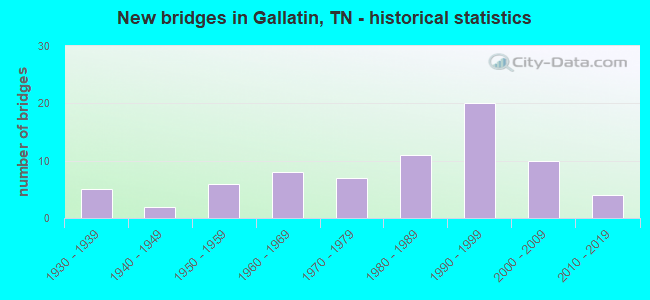
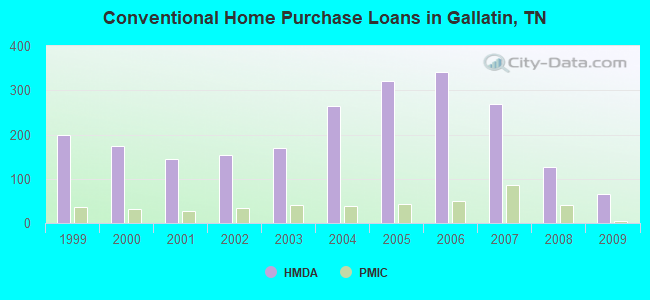
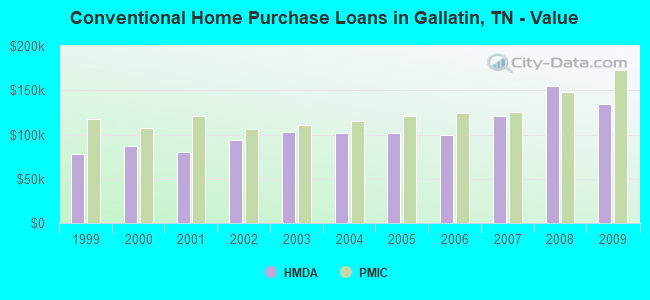
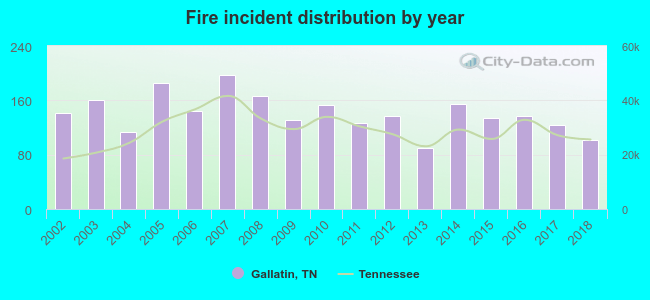 According to the data from the years 2002 - 2018 the average number of fire incidents per year is 141. The highest number of fire incidents - 197 took place in 2007, and the least - 90 in 2013. The data has a declining trend.
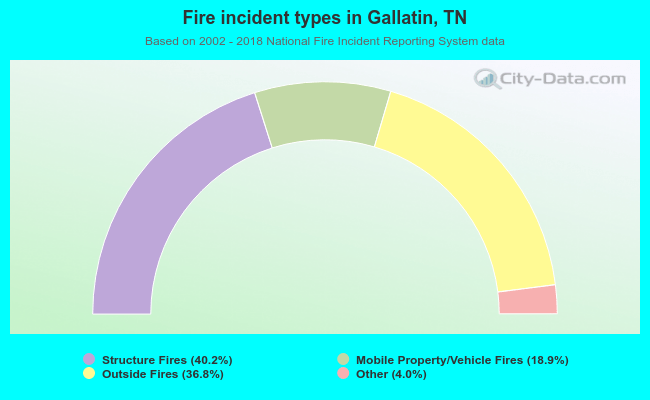 When looking into fire subcategories, the most incidents belonged to: Structure Fires (40.2%), and Outside Fires (36.8%).