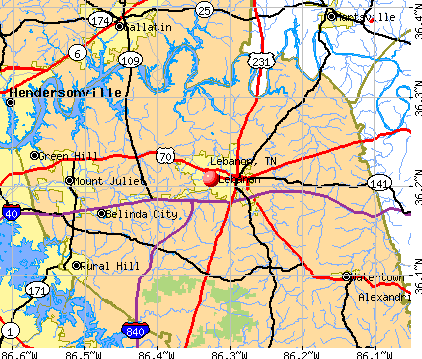
Lebanon, Tennessee
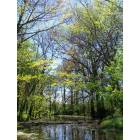
Lebanon: Trudging through the creek at Don Foxx Park
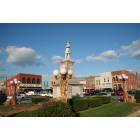
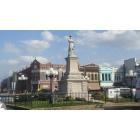
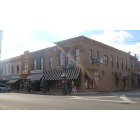
Lebanon: City Square
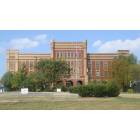
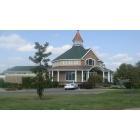
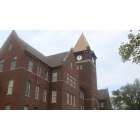
Lebanon: City hall on the Castle hgts campus
Lebanon: Lebanon Tn
Lebanon: Lebanon Tn
Lebanon: Lebanon Tn
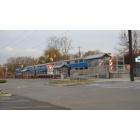
Lebanon: Lebanon Tn
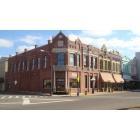
Lebanon: Lebanon Tn
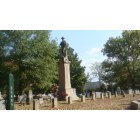
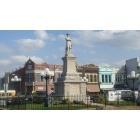
Lebanon: Confederate Cenetery
Lebanon: Lebanon Tennessee
Lebanon: Cumberland University
- see
17
more - add
your
Submit your own pictures of this city and show them to the world
- OSM Map
- General Map
- Google Map
- MSN Map
Population change since 2000: +118.3%
| Males: 20,909 | |
| Females: 23,257 |
| Median resident age: | 35.5 years |
| Tennessee median age: | 39.2 years |
Zip codes: 37090.
| Lebanon: | $61,947 |
| TN: | $65,254 |
Estimated per capita income in 2022: $32,883 (it was $20,366 in 2000)
Lebanon city income, earnings, and wages data
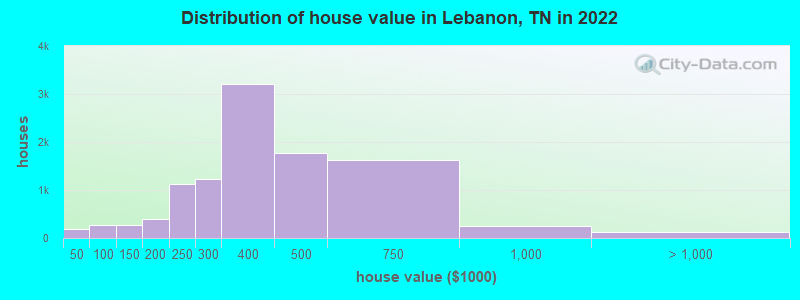
Estimated median house or condo value in 2022: $396,516 (it was $113,700 in 2000)
| Lebanon: | $396,516 |
| TN: | $284,800 |
Mean prices in 2022: all housing units: $407,188; detached houses: $422,191; townhouses or other attached units: $373,317; in 2-unit structures: $473,922; in 3-to-4-unit structures: $306,966; in 5-or-more-unit structures: $213,157; mobile homes: $135,534
Median gross rent in 2022: $1,229.
(10.9% for White Non-Hispanic residents, 21.6% for Black residents, 30.4% for Hispanic or Latino residents, 41.0% for other race residents, 32.0% for two or more races residents)
Detailed information about poverty and poor residents in Lebanon, TN


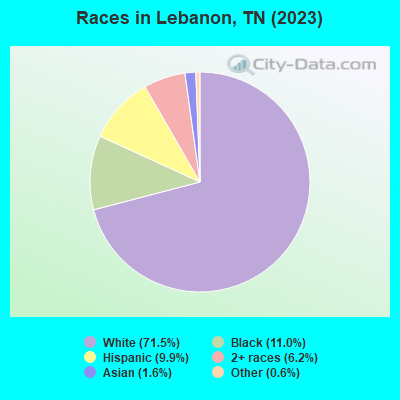
- 31,10973.9%White alone
- 5,31612.6%Black alone
- 3,3387.9%Hispanic
- 1,9064.5%Two or more races
- 8201.9%Asian alone
- 2370.6%Other race alone
- 360.09%American Indian alone
Races in Lebanon detailed stats: ancestries, foreign born residents, place of birth
According to our research of Tennessee and other state lists, there were 110 registered sex offenders living in Lebanon, Tennessee as of April 27, 2024.
The ratio of all residents to sex offenders in Lebanon is 272 to 1.
Type |
2009 |
2010 |
2011 |
2012 |
2013 |
2014 |
2015 |
2016 |
2017 |
2018 |
2019 |
2020 |
2021 |
2022 |
|---|---|---|---|---|---|---|---|---|---|---|---|---|---|---|
| Murders (per 100,000) | 0 (0.0) | 0 (0.0) | 0 (0.0) | 2 (7.4) | 2 (7.1) | 1 (3.5) | 5 (16.5) | 0 (0.0) | 1 (3.1) | 3 (9.0) | 2 (5.5) | 0 (0.0) | 4 (10.1) | 1 (2.3) |
| Rapes (per 100,000) | 11 (43.7) | 5 (19.1) | 8 (30.3) | 10 (37.0) | 7 (24.8) | 18 (62.1) | 22 (72.7) | 19 (61.0) | 27 (83.7) | 28 (84.4) | 25 (68.8) | 20 (52.9) | 27 (68.3) | 23 (53.1) |
| Robberies (per 100,000) | 35 (139.1) | 37 (141.3) | 34 (128.7) | 24 (88.9) | 19 (67.4) | 30 (103.6) | 38 (125.6) | 36 (115.7) | 16 (49.6) | 21 (63.3) | 8 (22.0) | 26 (68.7) | 16 (40.5) | 14 (32.3) |
| Assaults (per 100,000) | 125 (496.8) | 173 (660.6) | 138 (522.2) | 161 (596.5) | 157 (556.6) | 172 (593.9) | 188 (621.2) | 147 (472.3) | 185 (573.7) | 136 (409.9) | 114 (313.7) | 172 (454.6) | 137 (346.6) | 158 (364.7) |
| Burglaries (per 100,000) | 188 (747.2) | 232 (885.8) | 226 (855.2) | 188 (696.5) | 149 (528.2) | 130 (448.8) | 154 (508.8) | 150 (481.9) | 126 (390.7) | 142 (428.0) | 107 (294.5) | 149 (393.8) | 113 (285.9) | 105 (242.4) |
| Thefts (per 100,000) | 859 (3,414) | 948 (3,620) | 805 (3,046) | 896 (3,320) | 815 (2,889) | 776 (2,679) | 826 (2,729) | 733 (2,355) | 727 (2,254) | 719 (2,167) | 764 (2,103) | 837 (2,212) | 543 (1,374) | 536 (1,237) |
| Auto thefts (per 100,000) | 56 (222.6) | 61 (232.9) | 59 (223.3) | 53 (196.4) | 41 (145.3) | 48 (165.7) | 50 (165.2) | 65 (208.8) | 85 (263.6) | 78 (235.1) | 60 (165.1) | 81 (214.1) | 70 (177.1) | 71 (163.9) |
| Arson (per 100,000) | 1 (4.0) | 4 (15.3) | 0 (0.0) | 1 (3.7) | 4 (14.2) | 1 (3.5) | 3 (9.9) | 12 (38.6) | 3 (9.3) | 0 (0.0) | 1 (2.8) | 2 (5.3) | 4 (10.1) | 2 (4.6) |
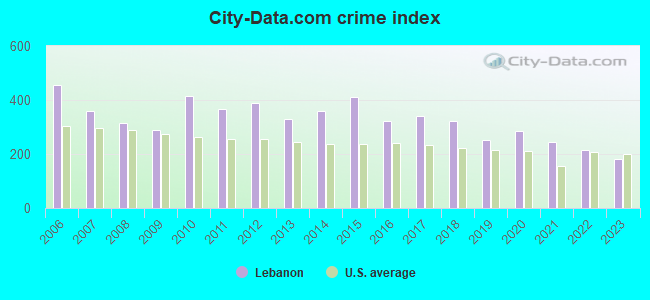
| City-Data.com crime index | 382.7 | 415.2 | 366.8 | 387.7 | 329.7 | 358.3 | 411.1 | 322.6 | 341.4 | 322.0 | 253.3 | 287.0 | 245.5 | 209.3 |
The City-Data.com crime index weighs serious crimes and violent crimes more heavily. Higher means more crime, U.S. average is 246.1. It adjusts for the number of visitors and daily workers commuting into cities.
Crime rate in Lebanon detailed stats: murders, rapes, robberies, assaults, burglaries, thefts, arson
Full-time law enforcement employees in 2021, including police officers: 135 (103 officers - 99 male; 4 female).
| Officers per 1,000 residents here: | 2.61 |
| Tennessee average: | 2.57 |
 Recent articles from our blog. Our writers, many of them Ph.D. graduates or candidates, create easy-to-read articles on a wide variety of topics.

 | Moving to Lebanon Tennessee (2 replies) |
| Ranking of Nashville's nicest suburbs (at least a try) (75 replies) |
| Considering cross-country move from Seattle (12 replies) |
| Mt. Juliet/Lebanon/Hendersonville/Gallatin? (9 replies) |
| Rental homes/townhouses in Lebanon area under 1K? (0 replies) |
| Lebanon Pike into Vandy? (4 replies) |
Latest news from Lebanon, TN collected exclusively by city-data.com from local newspapers, TV, and radio stations
Lebanon, TN City Guides:
Ancestries: American (25.5%), Irish (9.6%), English (9.4%), German (4.2%), European (3.4%), Bulgarian (1.3%).
Current Local Time: CST time zone
Incorporated in 1801
Elevation: 531 feet
Land area: 29.2 square miles.
Population density: 1,510 people per square mile (low).
2,498 residents are foreign born (3.4% Latin America, 1.2% Asia, 1.0% Europe).
| This city: | 5.9% |
| Tennessee: | 5.4% |
Median real estate property taxes paid for housing units with mortgages in 2022: $2,066 (0.5%)
Median real estate property taxes paid for housing units with no mortgage in 2022: $1,690 (0.5%)
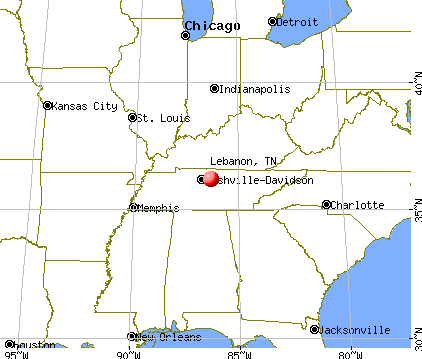
Nearest city with pop. 50,000+: Murfreesboro, TN  (24.5 miles , pop. 68,816).
Nearest city with pop. 200,000+: Nashville-Davidson, TN (24.6 miles , pop. 545,524).
Nearest city with pop. 1,000,000+: Chicago, IL (396.3 miles , pop. 2,896,016).
Nearest cities:
), ), ), ), ), Latitude: 36.21 N, Longitude: 86.33 W
Daytime population change due to commuting: +11,635 (+27.7%)
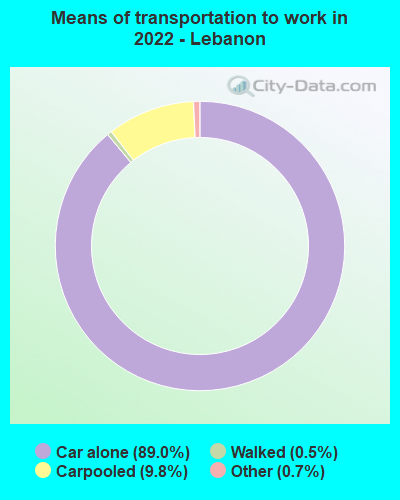
Workers who live and work in this city: 13,339 (64.4%)
Area code: 615
Lebanon, Tennessee accommodation & food services, waste management - Economy and Business Data
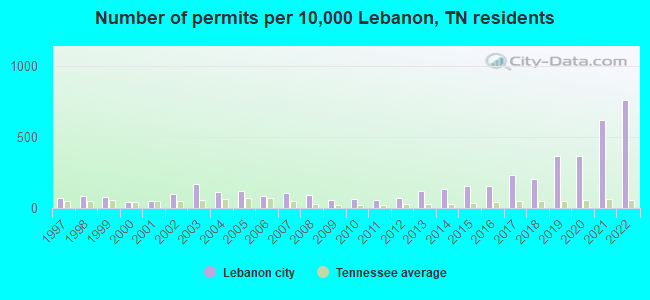
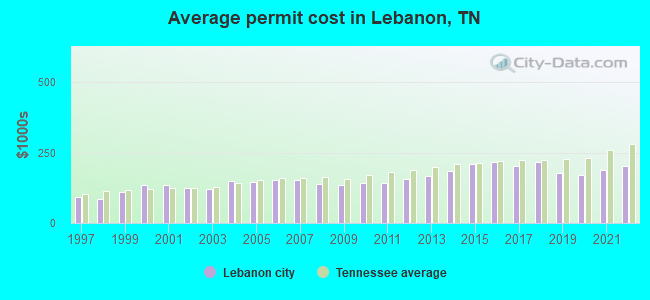
Single-family new house construction building permits:
- 2022: 1545 buildings, average cost: $201,200
- 2021: 1258 buildings, average cost: $187,500
- 2020: 738 buildings, average cost: $170,000
- 2019: 746 buildings, average cost: $175,600
- 2018: 418 buildings, average cost: $216,300
- 2017: 474 buildings, average cost: $201,700
- 2016: 318 buildings, average cost: $217,700
- 2015: 314 buildings, average cost: $209,400
- 2014: 272 buildings, average cost: $185,900
- 2013: 237 buildings, average cost: $167,300
- 2012: 147 buildings, average cost: $156,400
- 2011: 121 buildings, average cost: $140,700
- 2010: 132 buildings, average cost: $143,000
- 2009: 121 buildings, average cost: $134,200
- 2008: 185 buildings, average cost: $138,800
- 2007: 215 buildings, average cost: $152,800
- 2006: 167 buildings, average cost: $153,400
- 2005: 249 buildings, average cost: $144,600
- 2004: 226 buildings, average cost: $150,400
- 2003: 337 buildings, average cost: $121,900
- 2002: 202 buildings, average cost: $122,700
- 2001: 99 buildings, average cost: $133,800
- 2000: 88 buildings, average cost: $134,900
- 1999: 151 buildings, average cost: $110,400
- 1998: 168 buildings, average cost: $83,500
- 1997: 144 buildings, average cost: $91,900
| Here: | 2.8% |
| Tennessee: | 3.0% |
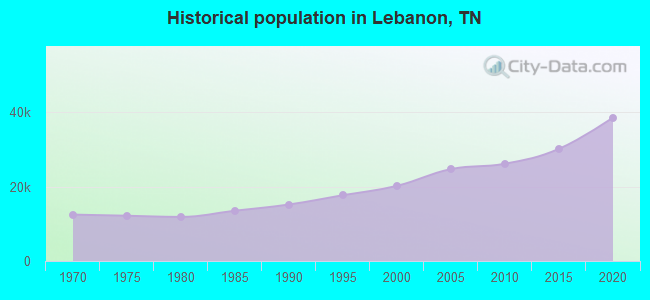
Population change in the 1990s: +2,913 (+16.8%).
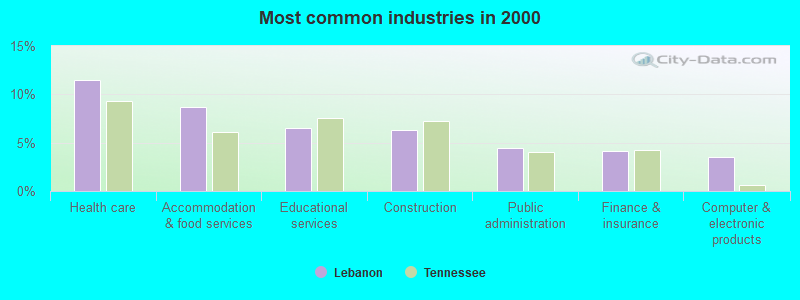
- Health care (11.5%)
- Accommodation & food services (8.7%)
- Educational services (6.5%)
- Construction (6.3%)
- Public administration (4.4%)
- Finance & insurance (4.1%)
- Computer & electronic products (3.5%)
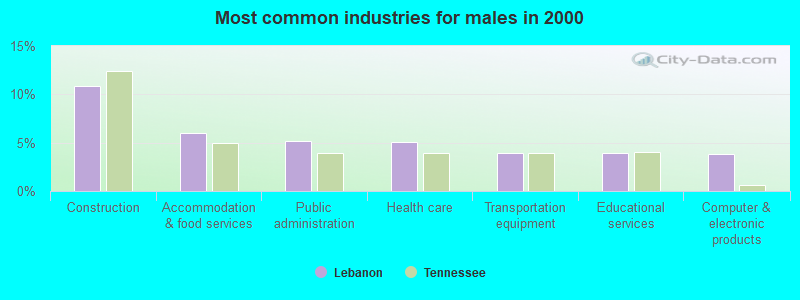
- Construction (10.9%)
- Accommodation & food services (6.0%)
- Public administration (5.1%)
- Health care (5.1%)
- Transportation equipment (3.9%)
- Educational services (3.9%)
- Computer & electronic products (3.8%)
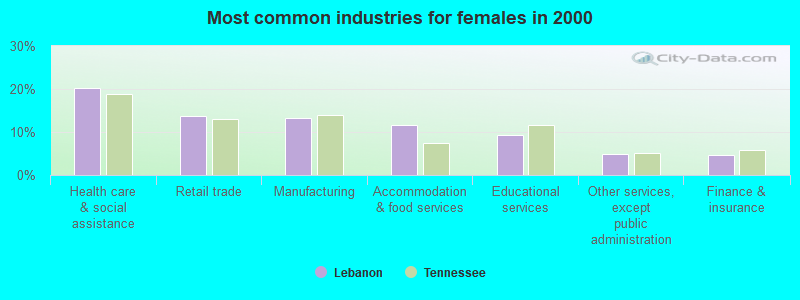
- Health care (18.3%)
- Accommodation & food services (11.6%)
- Educational services (9.3%)
- Finance & insurance (4.7%)
- Professional, scientific, technical services (4.6%)
- Department & other general merchandise stores (4.2%)
- Public administration (3.7%)

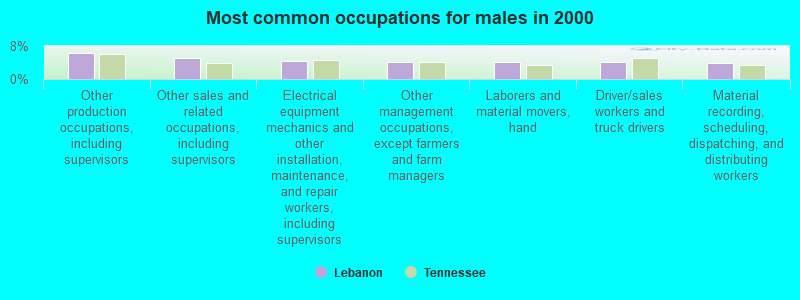
- Other production occupations, including supervisors (5.6%)
- Other sales and related occupations, including supervisors (4.8%)
- Other office and administrative support workers, including supervisors (4.0%)
- Other management occupations, except farmers and farm managers (3.7%)
- Retail sales workers, except cashiers (3.3%)
- Material recording, scheduling, dispatching, and distributing workers (3.2%)
- Laborers and material movers, hand (3.1%)
- Other production occupations, including supervisors (6.3%)
- Other sales and related occupations, including supervisors (5.2%)
- Electrical equipment mechanics and other installation, maintenance, and repair workers, including supervisors (4.3%)
- Other management occupations, except farmers and farm managers (4.2%)
- Laborers and material movers, hand (4.1%)
- Driver/sales workers and truck drivers (4.0%)
- Material recording, scheduling, dispatching, and distributing workers (3.9%)
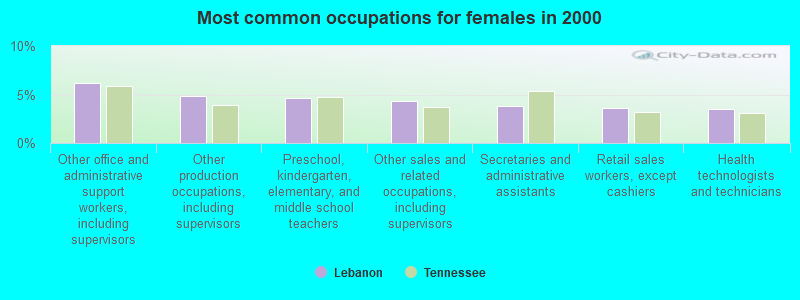
- Other office and administrative support workers, including supervisors (6.2%)
- Other production occupations, including supervisors (4.8%)
- Preschool, kindergarten, elementary, and middle school teachers (4.6%)
- Other sales and related occupations, including supervisors (4.3%)
- Secretaries and administrative assistants (3.9%)
- Retail sales workers, except cashiers (3.6%)
- Health technologists and technicians (3.5%)
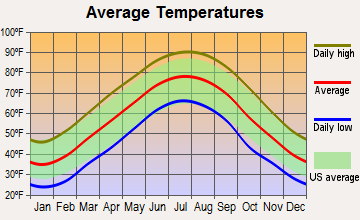
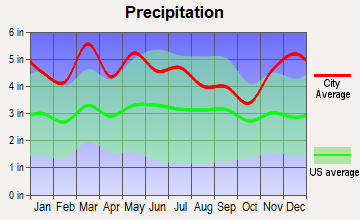
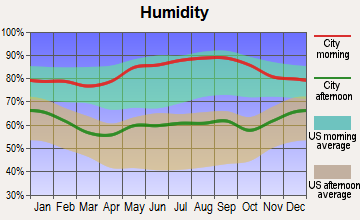
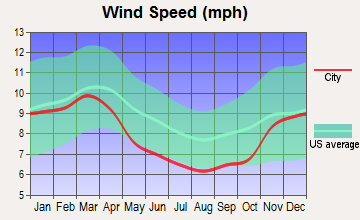
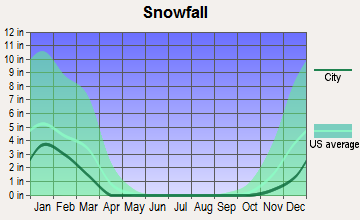
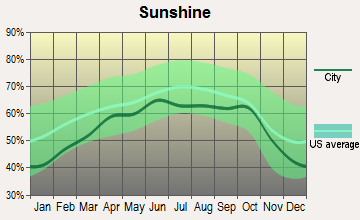
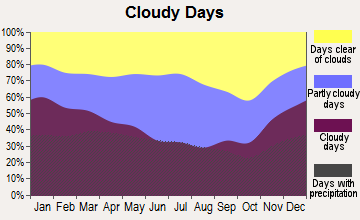
Average climate in Lebanon, Tennessee
Based on data reported by over 4,000 weather stations
|
|

(lower is better)
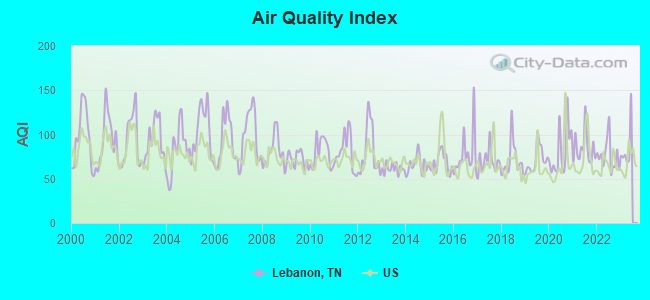
Air Quality Index (AQI) level in 2022 was 76.0. This is about average.
| City: | 76.0 |
| U.S.: | 72.6 |
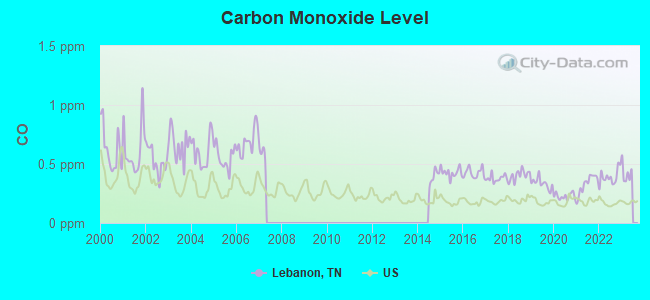
Carbon Monoxide (CO) [ppm] level in 2022 was 0.390. This is significantly worse than average. Closest monitor was 20.1 miles away from the city center.
| City: | 0.390 |
| U.S.: | 0.251 |
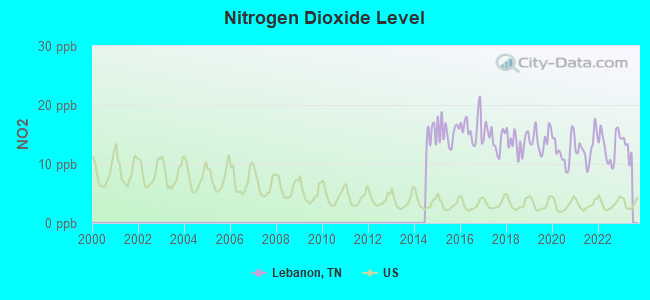
Nitrogen Dioxide (NO2) [ppb] level in 2022 was 13.0. This is significantly worse than average. Closest monitor was 17.5 miles away from the city center.
| City: | 13.0 |
| U.S.: | 5.1 |
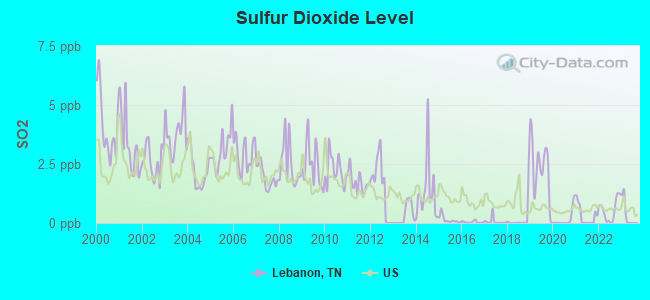
Sulfur Dioxide (SO2) [ppb] level in 2022 was 0.553. This is significantly better than average. Closest monitor was 6.5 miles away from the city center.
| City: | 0.553 |
| U.S.: | 1.515 |
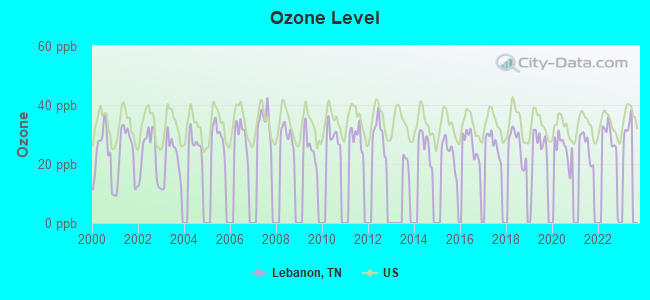
Ozone [ppb] level in 2022 was 26.8. This is better than average. Closest monitor was 21.6 miles away from the city center.
| City: | 26.8 |
| U.S.: | 33.3 |
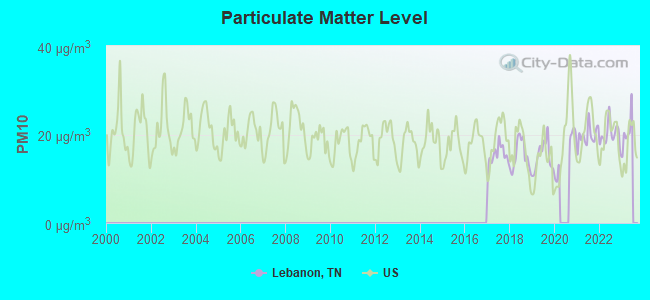
Particulate Matter (PM10) [µg/m3] level in 2022 was 20.0. This is about average. Closest monitor was 23.1 miles away from the city center.
| City: | 20.0 |
| U.S.: | 19.2 |
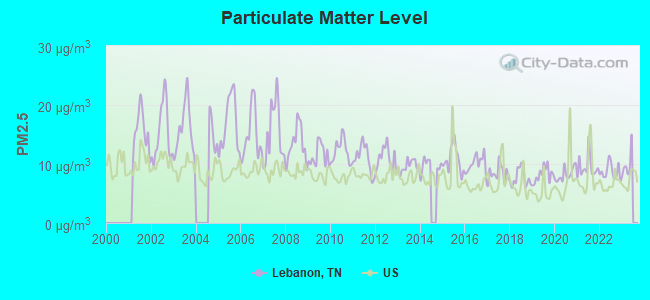
Particulate Matter (PM2.5) [µg/m3] level in 2022 was 8.73. This is about average. Closest monitor was 19.3 miles away from the city center.
| City: | 8.73 |
| U.S.: | 8.11 |
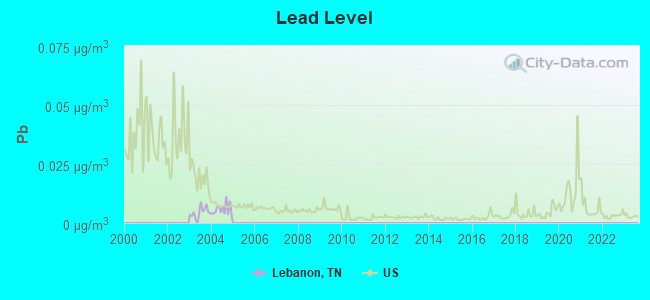
Lead (Pb) [µg/m3] level in 2004 was 0.00575. This is significantly better than average. Closest monitor was 2.4 miles away from the city center.
| City: | 0.00575 |
| U.S.: | 0.00931 |
Tornado activity:
Lebanon-area historical tornado activity is slightly above Tennessee state average. It is 67% greater than the overall U.S. average.
On 4/27/1970, a category F4 (max. wind speeds 207-260 mph) tornado 23.8 miles away from the Lebanon city center killed 3 people and injured 85 people and caused between $500,000 and $5,000,000 in damages.
On 1/24/1997, a category F4 tornado 26.3 miles away from the city center injured 18 people and caused $5 million in damages.
Earthquake activity:
Lebanon-area historical earthquake activity is significantly above Tennessee state average. It is 173% greater than the overall U.S. average.On 4/18/2008 at 09:36:59, a magnitude 5.4 (5.1 MB, 4.8 MS, 5.4 MW, 5.2 MW, Class: Moderate, Intensity: VI - VII) earthquake occurred 177.3 miles away from the city center
On 4/18/2008 at 09:36:59, a magnitude 5.2 (5.2 MW, Depth: 8.9 mi) earthquake occurred 177.3 miles away from Lebanon center
On 4/29/2003 at 08:59:39, a magnitude 4.9 (4.4 MB, 4.6 MW, 4.9 LG, Class: Light, Intensity: IV - V) earthquake occurred 124.9 miles away from Lebanon center
On 6/18/2002 at 17:37:15, a magnitude 5.0 (4.3 MB, 4.6 MW, 5.0 LG) earthquake occurred 146.9 miles away from Lebanon center
On 7/27/1980 at 18:52:21, a magnitude 5.2 (5.1 MB, 4.7 MS, 5.0 UK, 5.2 UK) earthquake occurred 190.6 miles away from Lebanon center
On 6/10/1987 at 23:48:54, a magnitude 5.1 (4.9 MB, 4.4 MS, 4.6 MS, 5.1 LG) earthquake occurred 199.9 miles away from the city center
Magnitude types: regional Lg-wave magnitude (LG), body-wave magnitude (MB), surface-wave magnitude (MS), moment magnitude (MW)
Natural disasters:
The number of natural disasters in Wilson County (10) is smaller than the US average (15).Major Disasters (Presidential) Declared: 6
Emergencies Declared: 2
Causes of natural disasters: Tornadoes: 6, Floods: 5, Storms: 5, Winds: 2, Winter Storms: 2, Flash Flood: 1, Hurricane: 1, Ice Storm: 1, Snowfall: 1, Other: 1 (Note: some incidents may be assigned to more than one category).

Main business address for: CBRL GROUP INC (RETAIL-EATING PLACES), WILSON BANK HOLDING CO (NATIONAL COMMERCIAL BANKS).
Hospitals and medical centers in Lebanon:
- MCFARLAND HOSPITAL (provides emergency services, 500 PARK AVE)
- UNIVERSITY MEDICAL CENTER (Voluntary non-profit - Private, 1411 BADDOUR PARKWAY)
- LEBANON HEALTH AND REHABILITATION CENTER (731 CASTLE HEIGHTS COURT)
- PAVILION, THE CPC (1406 MEDICAL CENTER DRIVE)
- QUALITY CARE HEALTH CENTER (932 BADDOUR PARKWAY)
- DCI LEBANON (212 BABB DR.)
- RAI LEBANON (1701 W. MAIN STREET)
- CAREALL HOMECARE SERVICES (501 PARK AVE SUITE B)
- DONELSON HOME HEALTH (115 WINWOOD DR, STE 101)
- QUALITY CARE HOME HEALTH AGENCY (95 SIGNATURE PLACE)
Airports located in Lebanon:
- Lebanon Municipal Airport (M54) (Runways: 2, Air Taxi Ops: 1,622, Itinerant Ops: 4,224, Local Ops: 9,654, Military Ops: 420)
- Cedar Crest Field Airport (1TN0) (Runways: 1)
- Fall Creek Field Airport (TN96) (Runways: 1)
- Flatwood Field Airport (10TN) (Runways: 1)
- Toy Box Airport (9TN9) (Runways: 1)
Colleges/Universities in Lebanon:
Colleges/universities with over 2000 students nearest to Lebanon:
- Volunteer State Community College (about 15 miles; Gallatin, TN; Full-time enrollment: 5,311)
- Trevecca Nazarene University (about 25 miles; Nashville, TN; FT enrollment: 2,223)
- Middle Tennessee State University (about 25 miles; Murfreesboro, TN; FT enrollment: 21,628)
- Belmont University (about 27 miles; Nashville, TN; FT enrollment: 5,795)
- Vanderbilt University (about 28 miles; Nashville, TN; FT enrollment: 10,518)
- Lipscomb University (about 28 miles; Nashville, TN; FT enrollment: 3,827)
- Tennessee State University (about 29 miles; Nashville, TN; FT enrollment: 7,341)
Public high schools in Lebanon:
- LEBANON HIGH SCHOOL (Students: 1,753, Location: 500 BLUE DEVIL BL, Grades: 9-12)
- WILSON CENTRAL HIGH SCHOOL (Students: 1,644, Location: 419 WILDCAT WAY, Grades: 9-12)
- WILSON CO ADULT HIGH SCHOOL (Location: 207 JOE BRANHAM DR, Grades: 9-12)
- TENNESSEE VIRTUAL ON-LINE SCHOOL (Location: 351 STUMPY LA, Grades: KG-12)
Private high school in Lebanon:
Public elementary/middle schools in Lebanon:
- COLES FERRY ELEMENTARY (Students: 720, Location: 511 COLES FERRY PK, Grades: PK-5)
- WALTER J. BAIRD MIDDLE SCHOOL (Students: 632, Location: 131 W J B PRIDE LA, Grades: 6-8)
- BYARS DOWDY ELEMENTARY (Students: 613, Location: 904 HICKORY RIDGE RD, Grades: PK-5)
- CASTLE HEIGHTS ELEMENTARY (Students: 596, Location: 1007 CASTLE HEIGHTS AVENUE NO, Grades: PK-5)
- CARROLL OAKLAND ELEMENTARY (Students: 594, Location: 4664 HUNTERS POINT PK, Grades: PK-8)
- TUCKERS CROSSROADS ELEMENTARY (Students: 499, Location: 5905 TROUSDALE FERRY PK, Grades: KG-8)
- SAM HOUSTON ELEMENTARY (Location: 207 OAKDALE DR, Grades: PK-5)
- WINFREE BRYANT MIDDLE SCHOOL (Location: 1213 LEEVILLE PK, Grades: 6-8)
- SOUTHSIDE ELEMENTARY (Location: 1224 MURFREESBORO RD, Grades: PK-8)
Private elementary/middle schools in Lebanon:
Library in Lebanon:
User-submitted facts and corrections:
- Pixie School has added McClain Christian Academy as an elementary Kindergarten - 8th grade. We are accreditated with the Dept. of Education. Pixie School is still our pre -school ages 3 and 4.
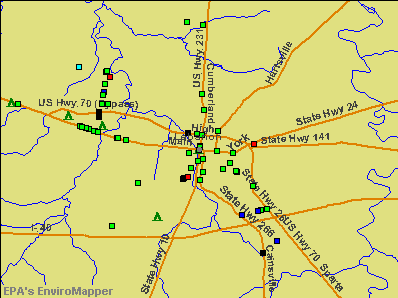
Points of interest:
Notable locations in Lebanon: Hunters Point Golf Course (A), Lebanon Country Club (B), Lebanon Fire Department Station 3 (C), Wilson Emergency Management Agency Station 1 Lebanon (D), Wilson County Courthouse (E), James E Ward Agricultural and Community Center (F), Lebanon Fire Department Station 2 (G), Lebanon Fire Department Station 1 (H), Professional Medical Transportation Wilson County (I). Display/hide their locations on the map
Main business address in Lebanon include: CBRL GROUP INC (A), WILSON BANK HOLDING CO (B). Display/hide their locations on the map
Churches in Lebanon include: Bethlehem Church (A), Life Church (B), Hebron Church (C), College Street Church of Christ (D), Fairview Baptist Church (E), First Baptist Church (F), Hickory Ridge Church of Christ (G), Market Street Church of Christ (H), Mount Zion Baptist Church (I). Display/hide their locations on the map
Cemeteries: Hudson Cemetery (1), Johnson Cemetery (2), Laine Cemetery (3), Ligon Cemetery (4), Greenwood Cemetery (5), Memorial Park Cemetery (6), Camper Cemetery (7). Display/hide their locations on the map
Reservoirs: Prowell Lake (A), Putnam Lake (B). Display/hide their locations on the map
Streams, rivers, and creeks: McCarmel Branch (A), Sinking Creek (B), North Fork Cedar Creek (C), Tarver Branch (D), Middle Fork Cedar Creek (E), South Fork Cedar Creek (F), Martha Branch (G). Display/hide their locations on the map
Park in Lebanon: Baird Municipal Park (1). Display/hide its location on the map
Tourist attractions: Checkerboard Sales (Amusement & Theme Parks; 310 South College Street) (1), Classic Travel Service Inc (Tours & Charters; 130 Public Square) (2). Display/hide their approximate locations on the map
Hotels: Dix's Plaza Motor Lodge (319 West Main Street) (1), Country Inn and Suites Lebanon (140 Dixie Avenue) (2), Four Seasons Coach Leasing (211 Babb Drive) (3), Days Inn Lebanon (914 Highway 231 South) (4), Hampton Inn Lebanon (704 South Cumberland Street) (5), Comfort Inn Lebanon (829 South Cumberland Street) (6), Comfort Inn (829 South Cumberland Street) (7), Baker's Plaza 231 Inn (815 N Cumberland St) (8), Budget Inn (412 North Cumberland Street) (9). Display/hide their approximate locations on the map
Courts: Wilson County - Lebanon- Drug Court Program (137 South College Street) (1), Wilson County - Lebanon- Misdemeanor Probation Criminal Court Division (137 South College Street) (2), License Plates (tags) - Wilson County (Courthouse) (3), Bond James O Criminal Court Judge (108 South Cumberland) (4). Display/hide their approximate locations on the map
Birthplace of: Eddie Adcock - Musician, Jesse J. Finley - Confederate Army general, Jimmy Duncan (U.S. politician) - Tennessee politician, George Huddleston - Politician, Jacob Golladay - Politician, John Selden Roane - Confederate Army general, Bonnie Sloan - Football player, Chase Montgomery - Craftsman Truck series NASCAR driver (born: Sep 28, 1983), Ed Foster (baseball) - Baseball player, Joe Jones (baseball) - Baseball player and coach.
Drinking water stations with addresses in Lebanon and their reported violations in the past:
LEBANON WATER SYSTEM (Population served: 33,784, Surface water):Past monitoring violations:WILSON CO WATER & WASTEWATER (Population served: 19,376, Purch surface water):
- Monitoring, Turbidity (Enhanced SWTR) - In NOV-2005, Contaminant: IESWTR. Follow-up actions: St Public Notif requested (JAN-03-2006), St Violation/Reminder Notice (JAN-03-2006), St AO (w/penalty) issued (JAN-12-2009)
- One minor monitoring violation
Past health violations:GLADEVILLE UTILITY DISTRICT (Population served: 15,720, Groundwater under infl of surface water):Past monitoring violations:
- MCL, Average - Between JAN-2008 and MAR-2008, Contaminant: Total Haloacetic Acids (HAA5). Follow-up actions: St Compliance achieved (APR-04-2008), St Public Notif requested (APR-21-2008), St Violation/Reminder Notice (APR-21-2008), St Public Notif received (APR-28-2008), St Civil Case under development (JUL-18-2008), St AO (w/penalty) issued (SEP-15-2008)
- MCL, Average - Between OCT-2007 and DEC-2007, Contaminant: Total Haloacetic Acids (HAA5). Follow-up actions: St Public Notif requested (JAN-22-2008), St Violation/Reminder Notice (JAN-22-2008), St Public Notif received (JAN-28-2008), St Compliance achieved (APR-04-2008), St Civil Case under development (JUL-18-2008), St AO (w/penalty) issued (SEP-15-2008)
- MCL, Average - Between JUL-2007 and SEP-2007, Contaminant: Total Haloacetic Acids (HAA5). Follow-up actions: St Public Notif requested (OCT-24-2007), St Violation/Reminder Notice (OCT-24-2007), St Public Notif received (OCT-29-2007), St Compliance achieved (APR-04-2008), St Civil Case under development (JUL-18-2008), St AO (w/penalty) issued (SEP-15-2008)
- Monitoring, Repeat Major (TCR) - In MAR-2014, Contaminant: Coliform (TCR). Follow-up actions: St Violation/Reminder Notice (MAY-01-2014), St Public Notif requested (MAY-01-2014), St Compliance achieved (MAY-30-2014), St Public Notif received (2 times from MAY-30-2014 to MAY-30-2014)
- Monitoring and Reporting (DBP) - Between JAN-2014 and MAR-2014, Contaminant: Chlorine. Follow-up actions: St Violation/Reminder Notice (MAY-01-2014), St Public Notif requested (MAY-01-2014), St Compliance achieved (MAY-30-2014), St Public Notif received (2 times from MAY-30-2014 to MAY-30-2014)
Past monitoring violations:LAGUARDO UTILITY DISTRICT (Population served: 8,777, Purch surface water):
- Single Turbidity Exceed (Enhanced SWTR) - In JUN-2011, Contaminant: IESWTR. Follow-up actions: St Public Notif requested (JUL-01-2011), St Violation/Reminder Notice (JUL-01-2011), St Public Notif received (JUL-11-2011), St Compliance achieved (SEP-30-2011)
- Monitoring, Turbidity (Enhanced SWTR) - In AUG-2005, Contaminant: IESWTR. Follow-up actions: St Compliance achieved (SEP-01-2005), St Violation/Reminder Notice (SEP-26-2005), St Public Notif requested (2 times from SEP-26-2005 to SEP-30-2005), St Violation/Reminder Notice (SEP-30-2005)
- One minor monitoring violation
Past health violations:SHANGRI LA RESORT (Serves MO, Population served: 65, Groundwater):Past monitoring violations:
- MCL, Average - Between JUL-2005 and SEP-2005, Contaminant: Total Haloacetic Acids (HAA5). Follow-up actions: St Public Notif requested (OCT-25-2005), St Violation/Reminder Notice (OCT-25-2005), St Public Notif received (NOV-23-2005), St Compliance achieved (NOV-30-2005)
- Monitoring, Routine (IDSE) - Between JAN-2009 and MAR-2009, Contaminant: Total Haloacetic Acids (HAA5). Follow-up actions: St Compliance achieved (MAR-18-2009), St Public Notif requested (APR-28-2009), St Violation/Reminder Notice (APR-28-2009)
- Monitoring, Routine (IDSE) - Between JAN-2009 and MAR-2009, Contaminant: TTHM. Follow-up actions: St Compliance achieved (MAR-18-2009), St Public Notif requested (APR-28-2009), St Violation/Reminder Notice (APR-28-2009)
Past health violations:Past monitoring violations:
- MCL, Monthly (TCR) - In SEP-2012, Contaminant: Coliform. Follow-up actions: St Public Notif requested (OCT-03-2012), St Formal NOV issued (OCT-03-2012), St Public Notif received (NOV-05-2012), St Compliance achieved (JAN-22-2014)
- MCL, Monthly (TCR) - In OCT-2009, Contaminant: Coliform. Follow-up actions: St Violation/Reminder Notice (NOV-09-2009), St Public Notif requested (NOV-09-2009), St Public Notif received (DEC-18-2009), St Compliance achieved (SEP-30-2010)
- MCL, Monthly (TCR) - In AUG-2009, Contaminant: Coliform. Follow-up actions: St Public Notif requested (AUG-28-2009), St Violation/Reminder Notice (2 times from AUG-28-2009 to AUG-28-2009), St Public Notif requested (AUG-28-2009), St Public Notif received (OCT-05-2009), St Compliance achieved (SEP-30-2010)
- MCL, Monthly (TCR) - In MAY-2009, Contaminant: Coliform. Follow-up actions: St Violation/Reminder Notice (JUN-01-2009), St Public Notif requested (JUN-01-2009), St Public Notif received (JUL-06-2009), St Compliance achieved (SEP-30-2010)
- Monitoring, Source Water (GWR) - In OCT-01-2012, Contaminant: E. COLI. Follow-up actions: St Violation/Reminder Notice (OCT-19-2012), St Public Notif requested (OCT-19-2012), St Public Notif received (APR-11-2014)
| This city: | 2.5 people |
| Tennessee: | 2.5 people |
| This city: | 65.9% |
| Whole state: | 67.3% |
| This city: | 7.6% |
| Whole state: | 5.8% |
Likely homosexual households (counted as self-reported same-sex unmarried-partner households)
- Lesbian couples: 0.5% of all households
- Gay men: 0.2% of all households
People in group quarters in Lebanon in 2010:
- 375 people in nursing facilities/skilled-nursing facilities
- 336 people in college/university student housing
- 234 people in local jails and other municipal confinement facilities
- 136 people in group homes intended for adults
- 20 people in workers' group living quarters and job corps centers
People in group quarters in Lebanon in 2000:
- 378 people in college dormitories (includes college quarters off campus)
- 286 people in other group homes
- 111 people in other noninstitutional group quarters
- 103 people in local jails and other confinement facilities (including police lockups)
- 93 people in nursing homes
- 13 people in unknown juvenile institutions
- 8 people in homes for the mentally retarded
- 7 people in homes for the physically handicapped
Banks with most branches in Lebanon (2011 data):
- Wilson Bank and Trust: Lebanon Branch, Tennessee Boulevard Branch, Wilson Bank And Trust, Leeville 109 Branch, Wal-Mart Supercenter Branch, Castle Heights Ave North Branch. Info updated 2006/11/03: Bank assets: $1,567.4 mil, Deposits: $1,398.3 mil, local headquarters, positive income, Commercial Lending Specialization, 25 total offices, Holding Company: Wilson Bank Holding Company
- Bank of America, National Association: Lebanon Public Square at 120 West Main Street, branch established on 1923/05/29; Lebanon-West Main Branch at 1416-A West Main Street, branch established on 1991/01/02. Info updated 2009/11/18: Bank assets: $1,451,969.3 mil, Deposits: $1,077,176.8 mil, headquarters in Charlotte, NC, positive income, 5782 total offices, Holding Company: Bank Of America Corporation
- SunTrust Bank: Lebanon Main Office Branch at 240 West Main Street, branch established on 1915/09/17; Lebanon Square Branch 848 at 1213 West Main Street, branch established on 1994/10/24. Info updated 2010/05/27: Bank assets: $171,291.7 mil, Deposits: $129,833.2 mil, headquarters in Atlanta, GA, positive income, Commercial Lending Specialization, 1716 total offices, Holding Company: Suntrust Banks, Inc.
- Pinnacle National Bank: Lebanon Branch at 1412 West Baddour Parkway, branch established on 2001/04/30; South Cumberland Street Branch at 411 South Cumberland Street, branch established on 2006/03/13. Info updated 2010/01/06: Bank assets: $4,846.7 mil, Deposits: $3,690.4 mil, headquarters in Nashville, TN, positive income, Commercial Lending Specialization, 33 total offices, Holding Company: Pinnacle Financial Partners, Inc.
- Liberty State Bank: Downtown Branch at 214 North Cumberland, branch established on 1998/02/12; Lebanon Main Branch at 1035 West Main Street, branch established on 1974/04/22. Info updated 2006/11/03: Bank assets: $137.3 mil, Deposits: $121.2 mil, headquarters in Liberty, TN, positive income, 5 total offices, Holding Company: Citizens Bancorp Investment, Inc.
- First Tennessee Bank, National Association: Western Plaza Branch at 1615 West Main Street, branch established on 1970/02/02; West Main Street Branch at 249 West Main Street, branch established on 1925/03/16. Info updated 2009/09/08: Bank assets: $24,563.4 mil, Deposits: $16,402.1 mil, headquarters in Memphis, TN, positive income, Commercial Lending Specialization, 180 total offices, Holding Company: First Horizon National Corporation
- Citizens Bank of Lafayette: Citizens Bank Of Lafayette Lebanon L at 214 North Cumberland Street, branch established on 2011/08/17. Info updated 2009/11/20: Bank assets: $441.8 mil, Deposits: $369.5 mil, headquarters in Lafayette, TN, positive income, 11 total offices, Holding Company: Citizens Bancorp Investment, Inc.
- Sumner Bank & Trust: Lebanon Road Loan Production Office at 2070 Lebanon Road, branch established on 2012/03/01. Info updated 2010/07/06: Bank assets: $156.2 mil, Deposits: $126.5 mil, headquarters in Gallatin, TN, positive income, Commercial Lending Specialization, 4 total offices
- First Freedom Bank: at 1620 West Main Street, branch established on 2006/04/03. Info updated 2009/03/25: Bank assets: $237.1 mil, Deposits: $197.4 mil, local headquarters, positive income, Commercial Lending Specialization, 3 total offices, Holding Company: First Freedom Bancshares, Inc.
- 5 other banks with 5 local branches
For population 15 years and over in Lebanon:
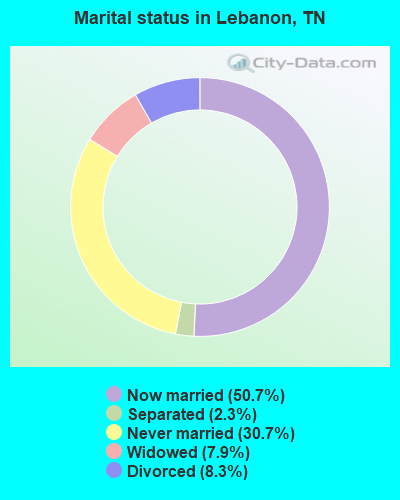
- Never married: 30.7%
- Now married: 50.7%
- Separated: 2.3%
- Widowed: 7.9%
- Divorced: 8.3%
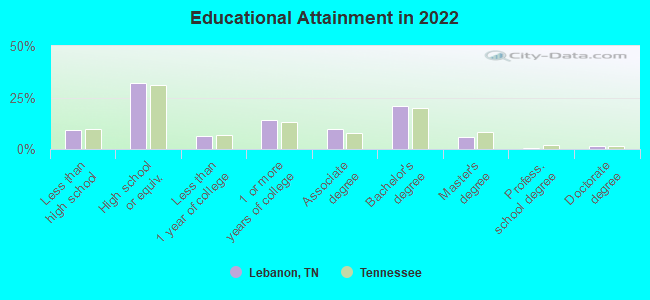
For population 25 years and over in Lebanon:
- High school or higher: 91.1%
- Bachelor's degree or higher: 30.0%
- Graduate or professional degree: 9.3%
- Unemployed: 7.0%
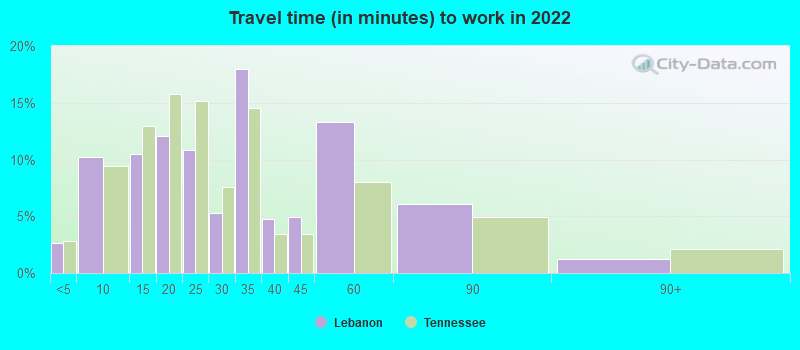
- Mean travel time to work (commute): 20.8 minutes
| Here: | 10.4 |
| Tennessee average: | 11.4 |
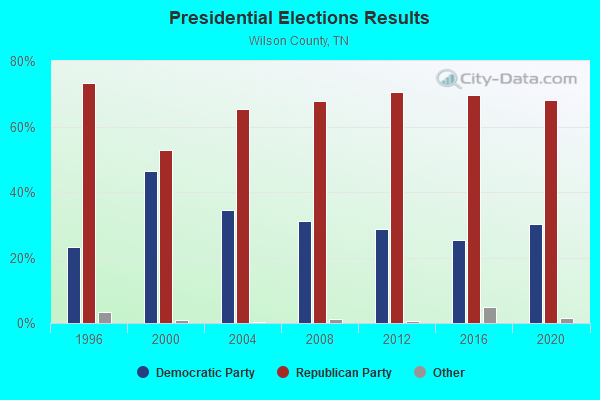
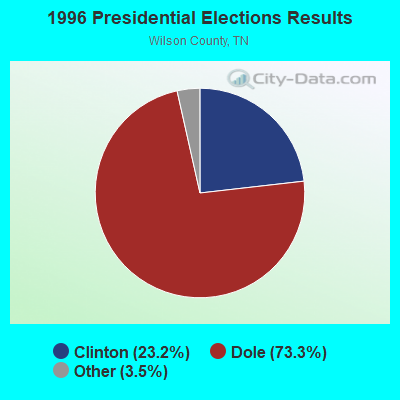
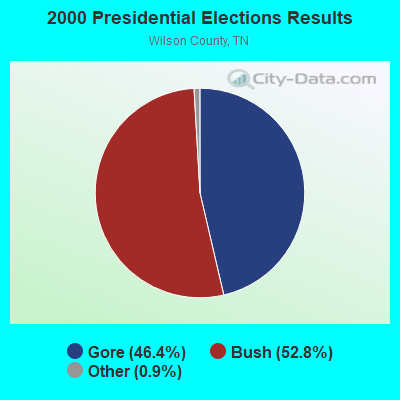
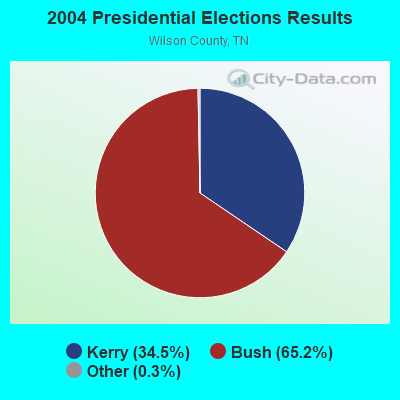
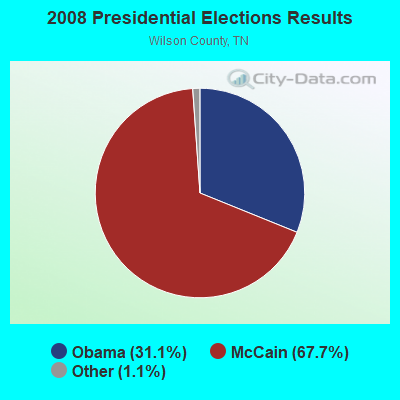


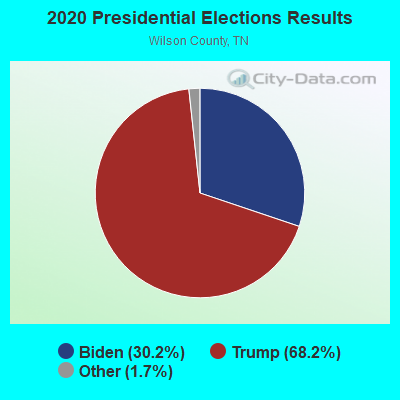
Graphs represent county-level data. Detailed 2008 Election Results
Religion statistics for Lebanon, TN (based on Wilson County data)
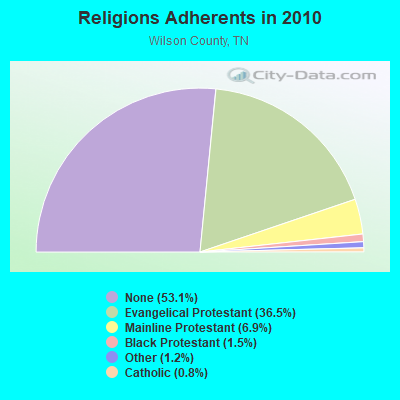
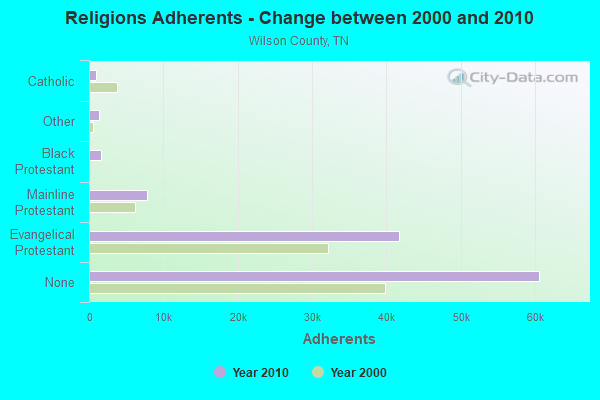
| Religion | Adherents | Congregations |
|---|---|---|
| Evangelical Protestant | 41,655 | 121 |
| Mainline Protestant | 7,843 | 26 |
| Black Protestant | 1,674 | 10 |
| Other | 1,353 | 7 |
| Catholic | 900 | 1 |
| None | 60,568 | - |
Food Environment Statistics:
| Here: | 1.51 / 10,000 pop. |
| Tennessee: | 1.99 / 10,000 pop. |
| Wilson County: | 0.09 / 10,000 pop. |
| Tennessee: | 0.17 / 10,000 pop. |
| Here: | 0.38 / 10,000 pop. |
| Tennessee: | 0.65 / 10,000 pop. |
| Here: | 4.61 / 10,000 pop. |
| Tennessee: | 5.16 / 10,000 pop. |
| Wilson County: | 6.12 / 10,000 pop. |
| Tennessee: | 6.56 / 10,000 pop. |
| Here: | 9.9% |
| Tennessee: | 11.4% |
| Here: | 29.3% |
| Tennessee: | 30.2% |
| This county: | 12.5% |
| Tennessee: | 13.5% |
Health and Nutrition:
| Lebanon: | 49.0% |
| Tennessee: | 49.3% |
| Here: | 45.6% |
| Tennessee: | 46.1% |
| Here: | 28.6 |
| Tennessee: | 28.8 |
| This city: | 21.2% |
| State: | 21.0% |
| Lebanon: | 10.8% |
| Tennessee: | 10.5% |
| This city: | 6.8 |
| Tennessee: | 6.8 |
| Here: | 33.0% |
| State: | 33.9% |
| This city: | 55.5% |
| Tennessee: | 55.9% |
| Lebanon: | 78.7% |
| Tennessee: | 79.1% |
More about Health and Nutrition of Lebanon, TN Residents
| Local government employment and payroll (March 2022) | |||||
| Function | Full-time employees | Monthly full-time payroll | Average yearly full-time wage | Part-time employees | Monthly part-time payroll |
|---|---|---|---|---|---|
| Parks and Recreation | 98 | $353,292 | $43,260 | 87 | $69,759 |
| Police Protection - Officers | 95 | $338,957 | $42,816 | 17 | $13,483 |
| Firefighters | 60 | $228,922 | $45,784 | 8 | $1,806 |
| Other Government Administration | 44 | $140,876 | $38,421 | 0 | $0 |
| Solid Waste Management | 30 | $48,550 | $19,420 | 0 | $0 |
| Streets and Highways | 28 | $114,361 | $49,012 | 1 | $3,696 |
| Gas Supply | 25 | $69,381 | $33,303 | 1 | $608 |
| Financial Administration | 23 | $92,065 | $48,034 | 1 | $2,081 |
| Police - Other | 23 | $46,863 | $24,450 | 5 | $5,548 |
| Water Supply | 20 | $62,291 | $37,375 | 1 | $1,232 |
| Natural Resources | 12 | $37,109 | $37,109 | 4 | $3,269 |
| Health | 12 | $37,664 | $37,664 | 1 | $1,760 |
| Sewerage | 12 | $51,411 | $51,411 | 1 | $1,920 |
| Fire - Other | 11 | $32,856 | $35,843 | 1 | $931 |
| Housing and Community Development (Local) | 6 | $20,861 | $41,722 | 0 | $0 |
| Judicial and Legal | 4 | $20,289 | $60,867 | 0 | $0 |
| Welfare | 3 | $9,620 | $38,480 | 0 | $0 |
| Other and Unallocable | 1 | $3,135 | $37,620 | 0 | $0 |
| Totals for Government | 507 | $1,708,501 | $40,438 | 128 | $106,093 |
Lebanon government finances - Expenditure in 2021 (per resident):
- Construction - Regular Highways: $1,822,000 ($41.25)
Air Transportation: $395,000 ($8.94)
Local Fire Protection: $106,000 ($2.40)
General - Other: $29,000 ($0.66)
- Current Operations - Police Protection: $12,966,000 ($293.57)
Gas Utilities: $7,668,000 ($173.62)
Local Fire Protection: $7,647,000 ($173.14)
General - Other: $6,105,000 ($138.23)
Sewerage: $5,071,000 ($114.82)
Water Utilities: $3,878,000 ($87.81)
Parks and Recreation: $2,576,000 ($58.33)
Regular Highways: $2,401,000 ($54.36)
Central Staff Services: $1,908,000 ($43.20)
Solid Waste Management: $1,733,000 ($39.24)
Financial Administration: $1,414,000 ($32.02)
Natural Resources - Other: $846,000 ($19.16)
Judicial and Legal Services: $354,000 ($8.02)
Air Transportation: $351,000 ($7.95)
Health - Other: $187,000 ($4.23)
Miscellaneous Commercial Activities - Other: $142,000 ($3.22)
- Gas Utilities - Interest on Debt: $30,000 ($0.68)
- General - Interest on Debt: $1,416,000 ($32.06)
- Other Capital Outlay - Police Protection: $1,438,000 ($32.56)
General - Other: $685,000 ($15.51)
Local Fire Protection: $407,000 ($9.22)
Solid Waste Management: $263,000 ($5.95)
Regular Highways: $56,000 ($1.27)
Parks and Recreation: $44,000 ($1.00)
- Total Salaries and Wages: $24,004,000 ($543.49)
- Water Utilities - Interest on Debt: $107,000 ($2.42)
Lebanon government finances - Revenue in 2021 (per resident):
- Charges - Parks and Recreation: $988,000 ($22.37)
Solid Waste Management: $225,000 ($5.09)
Miscellaneous Commercial Activities: $81,000 ($1.83)
Regular Highways: $38,000 ($0.86)
Air Transportation: $17,000 ($0.38)
Other: $1,000 ($0.02)
- Federal Intergovernmental - Other: $79,000 ($1.79)
- Miscellaneous - General Revenue - Other: $2,387,000 ($54.05)
Fines and Forfeits: $1,023,000 ($23.16)
Interest Earnings: $495,000 ($11.21)
Rents: $282,000 ($6.39)
Sale of Property: $92,000 ($2.08)
Special Assessments: $82,000 ($1.86)
Donations From Private Sources: $41,000 ($0.93)
- Revenue - Water Utilities: $28,656,000 ($648.82)
Gas Utilities: $10,276,000 ($232.67)
- State Intergovernmental - General Local Government Support: $3,882,000 ($87.90)
Highways: $1,950,000 ($44.15)
Other: $335,000 ($7.59)
Sewerage: $22,000 ($0.50)
- Tax - General Sales and Gross Receipts: $19,393,000 ($439.09)
Property: $13,126,000 ($297.20)
Occupation and Business License - Other: $5,647,000 ($127.86)
Alcoholic Beverage Sales: $1,849,000 ($41.86)
Other License: $384,000 ($8.69)
Other Selective Sales: $367,000 ($8.31)
Alcoholic Beverage License: $14,000 ($0.32)
Lebanon government finances - Debt in 2021 (per resident):
- Long Term Debt - Beginning Outstanding - Unspecified Public Purpose: $71,403,000 ($1616.70)
Outstanding Unspecified Public Purpose: $54,791,000 ($1240.57)
Retired Unspecified Public Purpose: $21,155,000 ($478.99)
Issue, Unspecified Public Purpose: $4,543,000 ($102.86)
Lebanon government finances - Cash and Securities in 2021 (per resident):
- Other Funds - Cash and Securities: $83,867,000 ($1898.90)
- Sinking Funds - Cash and Securities: $3,190,000 ($72.23)
| Businesses in Lebanon, TN | ||||
| Name | Count | Name | Count | |
|---|---|---|---|---|
| ALDI | 1 | Kmart | 1 | |
| AT&T | 1 | Knights Inn | 1 | |
| Advance Auto Parts | 1 | Kroger | 1 | |
| Aeropostale | 1 | La-Z-Boy | 1 | |
| Ann Taylor | 1 | Lane Bryant | 1 | |
| Applebee's | 1 | Lane Furniture | 1 | |
| Arby's | 2 | Little Caesars Pizza | 1 | |
| AutoZone | 1 | Lowe's | 1 | |
| Banana Republic | 1 | Maurices | 1 | |
| Baskin-Robbins | 1 | McDonald's | 3 | |
| Bath & Body Works | 1 | Nike | 2 | |
| Brooks Brothers | 1 | OfficeMax | 1 | |
| Burger King | 2 | Outback | 1 | |
| CVS | 1 | Outback Steakhouse | 1 | |
| Chevrolet | 1 | Pac Sun | 1 | |
| Comfort Suites | 1 | Papa John's Pizza | 1 | |
| Cracker Barrel | 1 | Pizza Hut | 2 | |
| Cricket Wireless | 2 | Publix Super Markets | 1 | |
| Curves | 1 | Quality | 1 | |
| Dairy Queen | 1 | Quiznos | 2 | |
| Days Inn | 1 | RadioShack | 1 | |
| Discount Tire | 1 | Ramada | 1 | |
| Domino's Pizza | 1 | Rite Aid | 1 | |
| DressBarn | 1 | Ruby Tuesday | 1 | |
| Dressbarn | 1 | Rue21 | 1 | |
| Dunkin Donuts | 1 | Ryan's Grill | 1 | |
| Econo Lodge | 1 | SAS Shoes | 1 | |
| Eddie Bauer | 1 | SONIC Drive-In | 3 | |
| FedEx | 8 | Sleep Inn | 1 | |
| Ford | 1 | Sprint Nextel | 1 | |
| GNC | 1 | Subway | 1 | |
| GameStop | 1 | Super 8 | 1 | |
| Gap | 1 | T-Mobile | 1 | |
| Gymboree | 1 | Taco Bell | 2 | |
| H&R Block | 2 | Toys"R"Us | 1 | |
| Hardee's | 1 | U-Haul | 6 | |
| Hilton | 1 | UPS | 8 | |
| Holiday Inn | 1 | Verizon Wireless | 1 | |
| Home Depot | 1 | Waffle House | 2 | |
| Hyundai | 1 | Walgreens | 2 | |
| Jack In The Box | 1 | Walmart | 1 | |
| Jones New York | 1 | Wendy's | 3 | |
| KFC | 1 | White Castle | 1 | |
| Kincaid | 1 | |||
Strongest AM radio stations in Lebanon:
- WAMB (1160 AM; 50 kW; DONELSON, TN; Owner: GREAT SOUTHERN BROADCASTING COMPANY, INC.)
- WSM (650 AM; 50 kW; NASHVILLE, TN; Owner: GAYLORD ENTERTAINMENT COMPANY)
- WLAC (1510 AM; 50 kW; NASHVILLE, TN; Owner: CAPSTAR TX LIMITED PARTNERSHIP)
- WKDA (1200 AM; 50 kW; NASHVILLE, TN; Owner: RADIO NASHVILLE, INC.)
- WNQM (1300 AM; 50 kW; NASHVILLE, TN; Owner: WNQM. INC.)
- WPLN (1430 AM; 15 kW; MADISON, TN)
- WHIN (1010 AM; 5 kW; GALLATIN, TN; Owner: WHIN, INC.)
- WYFN (980 AM; 5 kW; NASHVILLE, TN; Owner: BIBLE BRADCASTING NETWORK, INC.)
- WCOR (900 AM; 5 kW; LEBANON, TN)
- WMGC (810 AM; 5 kW; MURFREESBORO, TN; Owner: RADIO 810 NASHVILLE, LIMITED)
- WYXE (1130 AM; daytime; 2 kW; GALLATIN, TN; Owner: JON GARY ENTERPRISES, INC.)
- WWAM (820 AM; daytime; 50 kW; JASPER, TN; Owner: SHELTON BROADCASTING SYSTEM)
- WVOL (1470 AM; 5 kW; BERRY HILL, TN)
Strongest FM radio stations in Lebanon:
- WANT (98.9 FM; LEBANON, TN; Owner: BAY-POINTE BROADCASTING, INC.)
- WFMQ (91.5 FM; LEBANON, TN; Owner: CUMBERLAND UNIVERSITY)
- WMOT (89.5 FM; MURFREESBORO, TN; Owner: MIDDLE TENNESSEE STATE UNIVERSITY)
- WGFX (104.5 FM; GALLATIN, TN; Owner: CITADEL BROADCASTING COMPANY)
- WMAK (96.3 FM; MURFREESBORO, TN; Owner: SOUTH CENTRAL COMMUNICATIONS CORP.)
- WRVW (107.5 FM; LEBANON, TN; Owner: CAPSTAR TX LIMITED PARTNERSHIP)
- WSM-FM (95.5 FM; NASHVILLE, TN; Owner: CUMULUS LICENSING CORP.)
- WRLT (100.1 FM; FRANKLIN, TN; Owner: TUNED-IN BROADCASTING, INC)
- WKDF (103.3 FM; NASHVILLE, TN; Owner: CITADEL BROADCASTING COMPANY)
- WNRQ (105.9 FM; NASHVILLE, TN; Owner: CAPSTAR TX LIMITED PARTNERSHIP)
- WSIX-FM (97.9 FM; NASHVILLE, TN; Owner: CAPSTAR TX LIMITED PARTNERSHIP)
- WPLN-FM (90.3 FM; NASHVILLE, TN; Owner: NASHVILLE PUBLIC RADIO)
- WNPL (106.7 FM; BELLE MEADE, TN; Owner: CUMULUS LICENSING CORP.)
- WAYM (88.7 FM; COLUMBIA, TN; Owner: WAY-FM MEDIA GROUP, INC.)
- WVCP (88.5 FM; GALLATIN, TN; Owner: VOLUNTEER STATE COMMUNITY COLLEGE)
- W270AB (101.9 FM; LEBANON, TN; Owner: TREVECCA NAZARENE UNIVERSITY, INC.)
- WBUZ (102.9 FM; LA VERGNE, TN; Owner: WYCQ, INC)
- WWTN (99.7 FM; MANCHESTER, TN; Owner: CUMULUS LICENSING CORP.)
- WJXA (92.9 FM; NASHVILLE, TN; Owner: SOUTH CENTRAL COMMUNICATIONS CORP.)
- WRVU (91.1 FM; NASHVILLE, TN; Owner: VANDERBILT STUDENT COMMUNICATIONS, INC.)
TV broadcast stations around Lebanon:
- WHTN (Channel 39; MURFREESBORO, TN; Owner: CHRISTIAN TELEVISION NETWORK, INC.)
- WJFB (Channel 66; LEBANON, TN; Owner: BRYANT BROADCASTING, INC.)
- W11BD (Channel 11; LEBANON, TN; Owner: JOE F. BRYANT, MD)
- WPGD (Channel 50; HENDERSONVILLE, TN; Owner: TRINITY BROADCASTING NETWORK)
- WTVF (Channel 5; NASHVILLE, TN; Owner: NEWSCHANNEL 5 NETWORK, LP)
- WNPX (Channel 28; COOKEVILLE, TN; Owner: PAXSON COMMUNICATIONS LICENSE COMPANY, LLC)
- WUXP-TV (Channel 30; NASHVILLE, TN; Owner: WUXP LICENSEE, LLC)
- WNAB (Channel 58; NASHVILLE, TN; Owner: NASHVILLE LICENSE HOLDINGS, L.L.C.)
- WSMV-TV (Channel 4; NASHVILLE, TN; Owner: MEREDITH CORPORATION)
- WZTV (Channel 17; NASHVILLE, TN; Owner: WZTV LICENSEE, LLC)
- WKRN-TV (Channel 2; NASHVILLE, TN; Owner: WKRN, G.P.)
- WNPT (Channel 8; NASHVILLE, TN; Owner: NASHVILLE PUBLIC TELEVISION, INC.)
- WNPX-LP (Channel 20; NASHVILLE, TN; Owner: PAXSON COMMUNICATIONS LPTV, INC.)
- W36AK (Channel 36; NASHVILLE, TN; Owner: TRINITY BROADCASTING NETWORK)
- WIIW-LP (Channel 14; NASHVILLE, TN; Owner: EQUITY BROADCASTING CORPORATION)
- WGAP-LP (Channel 26; NASHVILLE, TN; Owner: SOUTH CENTRAL COMMUNICATIONS CORP.)
- WJDE-LP (Channel 24; NASHVILLE, TN; Owner: SOUTH CENTRAL COMMUNICATIONS CORP.)
- WRMX-LP (Channel 12; NASHVILLE, TN; Owner: SOUTH CENTRAL COMMUNICATIONS CORP.)
- WJNK-LP (Channel 61; NASHVILLE, TN; Owner: THREE ANGELS BROADCASTING NETWORK, INC.)
- W52CT (Channel 52; NASHVILLE, TN; Owner: JKB ASSOCIATES, INC.)
- National Bridge Inventory (NBI) Statistics
- 199Number of bridges
- 1,726ft / 526mTotal length
- $48,726,000Total costs
- 2,715,871Total average daily traffic
- 436,828Total average daily truck traffic
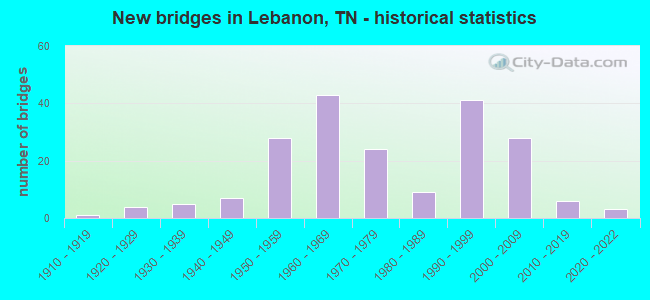
- New bridges - historical statistics
- 11910-1919
- 41920-1929
- 51930-1939
- 71940-1949
- 281950-1959
- 431960-1969
- 241970-1979
- 91980-1989
- 411990-1999
- 282000-2009
- 62010-2019
- 32020-2022
FCC Registered Antenna Towers: 333 (See the full list of FCC Registered Antenna Towers)
FCC Registered Commercial Land Mobile Towers: 2 (See the full list of FCC Registered Commercial Land Mobile Towers in Lebanon, TN)
FCC Registered Private Land Mobile Towers: 8 (See the full list of FCC Registered Private Land Mobile Towers)
FCC Registered Broadcast Land Mobile Towers: 59 (See the full list of FCC Registered Broadcast Land Mobile Towers)
FCC Registered Microwave Towers: 43 (See the full list of FCC Registered Microwave Towers in this town)
FCC Registered Paging Towers: 3 (See the full list of FCC Registered Paging Towers)
FCC Registered Maritime Coast & Aviation Ground Towers: 5 (See the full list of FCC Registered Maritime Coast & Aviation Ground Towers)
FCC Registered Amateur Radio Licenses: 392 (See the full list of FCC Registered Amateur Radio Licenses in Lebanon)
FAA Registered Aircraft Manufacturers and Dealers: 7 (See the full list of FAA Registered Manufacturers and Dealers in Lebanon)
FAA Registered Aircraft: 116 (See the full list of FAA Registered Aircraft)
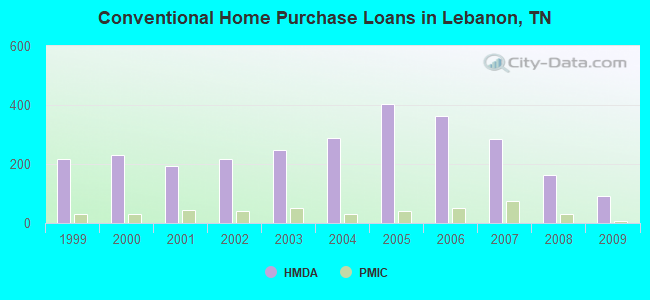
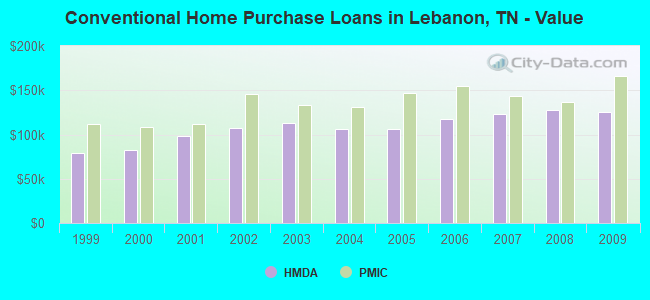
| Home Mortgage Disclosure Act Aggregated Statistics For Year 2009 (Based on 2 full and 3 partial tracts) | ||||||||||||||
| A) FHA, FSA/RHS & VA Home Purchase Loans | B) Conventional Home Purchase Loans | C) Refinancings | D) Home Improvement Loans | E) Loans on Dwellings For 5+ Families | F) Non-occupant Loans on < 5 Family Dwellings (A B C & D) | G) Loans On Manufactured Home Dwelling (A B C & D) | ||||||||
|---|---|---|---|---|---|---|---|---|---|---|---|---|---|---|
| Number | Average Value | Number | Average Value | Number | Average Value | Number | Average Value | Number | Average Value | Number | Average Value | Number | Average Value | |
| LOANS ORIGINATED | 120 | $143,987 | 90 | $125,521 | 352 | $147,696 | 23 | $45,227 | 2 | $167,780 | 82 | $109,833 | 4 | $52,650 |
| APPLICATIONS APPROVED, NOT ACCEPTED | 2 | $231,715 | 5 | $129,748 | 37 | $148,273 | 4 | $43,732 | 0 | $0 | 3 | $260,647 | 0 | $0 |
| APPLICATIONS DENIED | 16 | $118,132 | 21 | $96,366 | 123 | $147,334 | 13 | $27,896 | 0 | $0 | 8 | $62,582 | 15 | $38,548 |
| APPLICATIONS WITHDRAWN | 18 | $138,086 | 11 | $126,112 | 85 | $152,208 | 1 | $79,000 | 0 | $0 | 8 | $79,725 | 0 | $0 |
| FILES CLOSED FOR INCOMPLETENESS | 1 | $80,380 | 0 | $0 | 13 | $165,247 | 3 | $35,797 | 0 | $0 | 1 | $45,600 | 0 | $0 |
Detailed HMDA statistics for the following Tracts: 0302.02 , 0304.00, 0305.00, 0306.00, 0307.00
| Private Mortgage Insurance Companies Aggregated Statistics For Year 2009 (Based on 2 full and 3 partial tracts) | ||||
| A) Conventional Home Purchase Loans | B) Refinancings | |||
|---|---|---|---|---|
| Number | Average Value | Number | Average Value | |
| LOANS ORIGINATED | 6 | $166,598 | 17 | $183,371 |
| APPLICATIONS APPROVED, NOT ACCEPTED | 3 | $165,590 | 4 | $259,182 |
| APPLICATIONS DENIED | 1 | $102,750 | 2 | $217,155 |
| APPLICATIONS WITHDRAWN | 1 | $175,000 | 1 | $126,000 |
| FILES CLOSED FOR INCOMPLETENESS | 0 | $0 | 2 | $196,175 |
Detailed PMIC statistics for the following Tracts: 0302.02 , 0304.00, 0305.00, 0306.00, 0307.00
2002 - 2018 National Fire Incident Reporting System (NFIRS) incidents
- Fire incident types reported to NFIRS in Lebanon, TN
- 2,01649.1%Outside Fires
- 1,06926.0%Structure Fires
- 84320.5%Mobile Property/Vehicle Fires
- 1764.3%Other
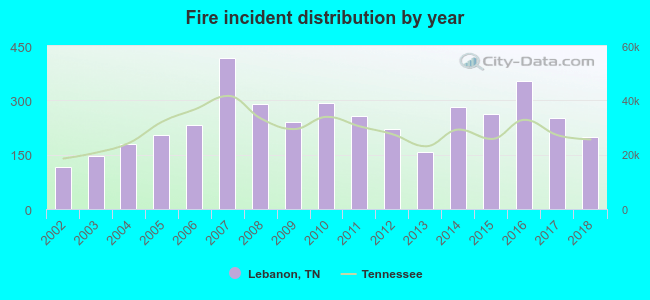 According to the data from the years 2002 - 2018 the average number of fire incidents per year is 241. The highest number of reported fires - 416 took place in 2007, and the least - 117 in 2002. The data has a growing trend.
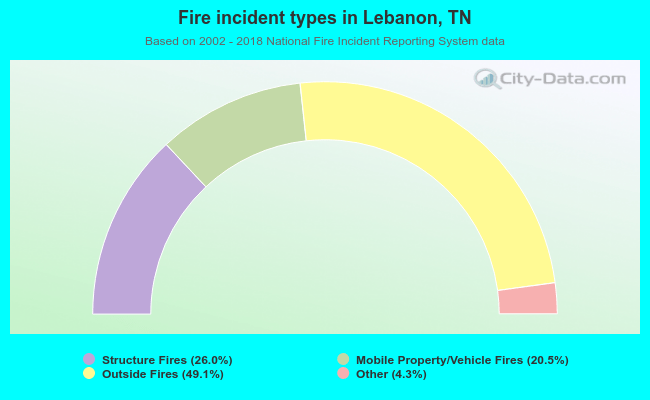 When looking into fire subcategories, the most incidents belonged to: Outside Fires (49.1%), and Structure Fires (26.0%).
Fire-safe hotels and motels in Lebanon, Tennessee:
- Ramada Inn, 704 S Cumberland St, Lebanon, Tennessee 37087 , Phone: (615) 444-7400, Fax: (615) 449-7969
- Comfort Inn, 829 S Cumberland St, Lebanon, Tennessee 37087 , Phone: (615) 444-1001, Fax: (615) 444-1002
- Comfort Suites, 904 Murfreesboro Rd, Lebanon, Tennessee 37090 , Phone: (615) 443-0027, Fax: (615) 470-7027
- Super 8 Lebanon, 914 Murfreesboro Rd, Lebanon, Tennessee 37090 , Phone: (615) 444-5637, Fax: (615) 444-5637
- La Quinta Inn & Suites, 140 Dixie Ave, Lebanon, Tennessee 37090 , Phone: (615) 470-1001, Fax: (615) 453-9508
- Holiday Inn Express Hotel & Suites, 826 S Cumberland St, Lebanon, Tennessee 37087 , Phone: (615) 994-3225, Fax: (615) 443-4185
- Hampton Inn & Suites Lebanon, 1065 Franklin Rd, Lebanon, Tennessee 37090 , Phone: (615) 444-3445
- Value Place, 205 Eastgate Ct, Lebanon, Tennessee 37090 , Phone: (615) 453-9087, Fax: (615) 443-6411
- 5 other hotels and motels
| Most common first names in Lebanon, TN among deceased individuals | ||
| Name | Count | Lived (average) |
|---|---|---|
| James | 406 | 71.5 years |
| William | 323 | 74.4 years |
| Mary | 309 | 78.3 years |
| John | 262 | 74.6 years |
| Robert | 256 | 70.9 years |
| Charles | 146 | 70.6 years |
| Willie | 129 | 78.9 years |
| George | 107 | 75.0 years |
| Thomas | 105 | 72.3 years |
| Walter | 92 | 75.0 years |
| Most common last names in Lebanon, TN among deceased individuals | ||
| Last name | Count | Lived (average) |
|---|---|---|
| Smith | 175 | 73.6 years |
| Johnson | 147 | 73.3 years |
| Williams | 124 | 78.1 years |
| Jones | 113 | 76.7 years |
| Thompson | 91 | 73.2 years |
| Davis | 78 | 74.2 years |
| Harris | 76 | 74.8 years |
| Brown | 71 | 76.9 years |
| Taylor | 68 | 75.0 years |
| White | 67 | 77.7 years |
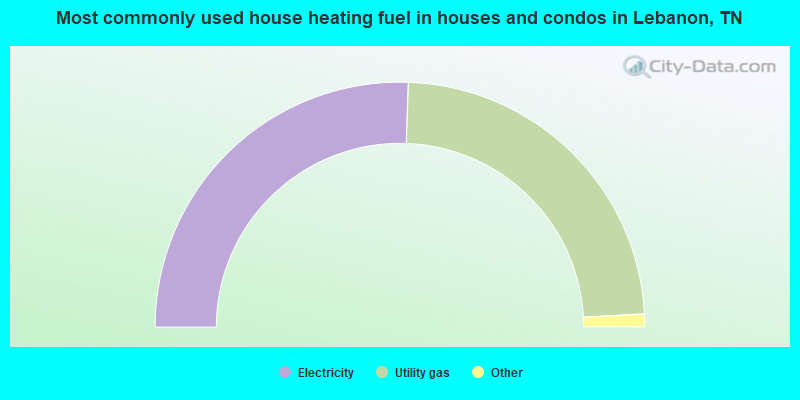
- 51.1%Electricity
- 47.2%Utility gas
- 1.3%Bottled, tank, or LP gas
- 0.4%No fuel used
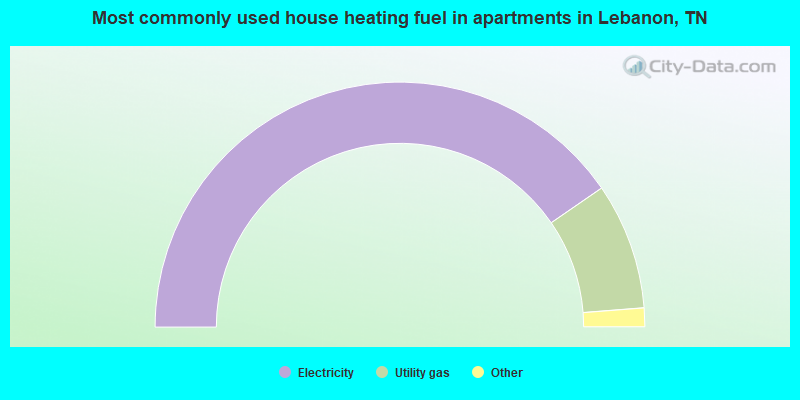
- 83.0%Electricity
- 15.3%Utility gas
- 0.8%Other fuel
- 0.5%Bottled, tank, or LP gas
- 0.3%No fuel used
Lebanon compared to Tennessee state average:
- Unemployed percentage below state average.
- Hispanic race population percentage above state average.
- Foreign-born population percentage significantly above state average.
- Length of stay since moving in below state average.
- House age below state average.
Lebanon on our top lists:
- #68 on the list of "Top 101 cities with the largest percentage of people in other group homes (population 1,000+)"
- #29 on the list of "Top 101 counties with the largest number of people moving in compared to moving out (pop. 50,000+)"
- #97 on the list of "Top 101 counties with highest percentage of residents voting for Romney (Republican) in the 2012 Presidential Election (pop. 50,000+)"

|
|
Total of 89 patent applications in 2008-2024.