Estimated zip code population in 2022: 4,997 Zip code population in 2010: 5,322 Zip code population in 2000: 4,996
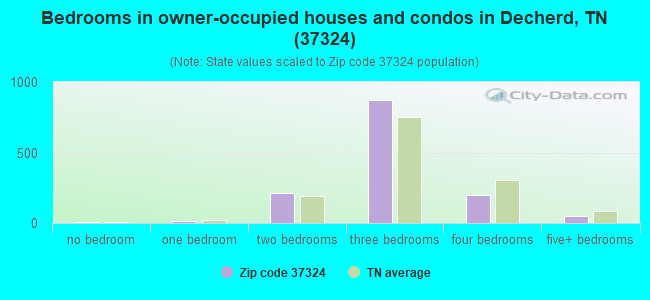
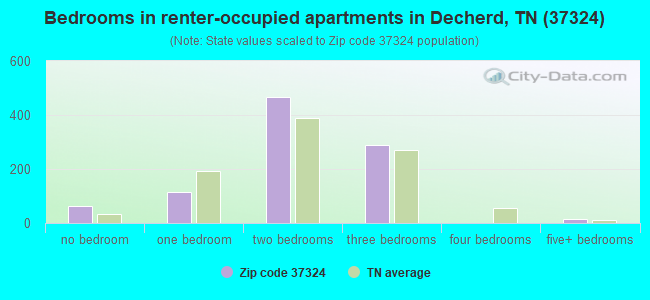
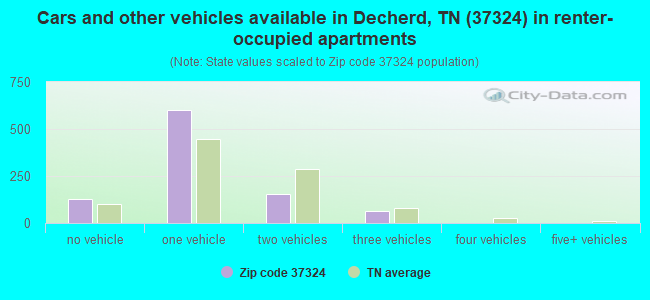
Houses and condos: 2,572 Renter-occupied apartments: 951
% of renters here:
41%
State:
33%
March 2022 cost of living index in zip code 37324: 81.2 (low, U.S. average is 100)
Land area: 72.0 sq. mi. Water area: 0.2 sq. mi.
Population density: 69 people per square mile
(very low).
OSM Map
General Map
Google Map
MSN Map
OSM Map
General Map
Google Map
MSN Map
OSM Map
General Map
Google Map
MSN Map
OSM Map
General Map
Google Map
MSN Map
Please wait while loading the map...
Real estate property taxes paid for housing units in 2022:
This zip code:
0.5% ($1,185)
Tennessee:
0.5% ($1,376)
Median real estate property taxes paid for housing units with mortgages in 2022: $1,194 (0.5%) Median real estate property taxes paid for housing units with no mortgage in 2022: $1,175 (0.6%)
Estimated median house/condo value in 2022: $225,288
37324:
$225,288
Tennessee:
$284,800
According to our research of Tennessee and other state lists, there were 17 registered sex offenders living in 37324 zip code as of April 27, 2024. The ratio of all residents to sex offenders in zip code 37324 is 324 to 1. The ratio of registered sex offenders to all residents in this zip code is near the state average.
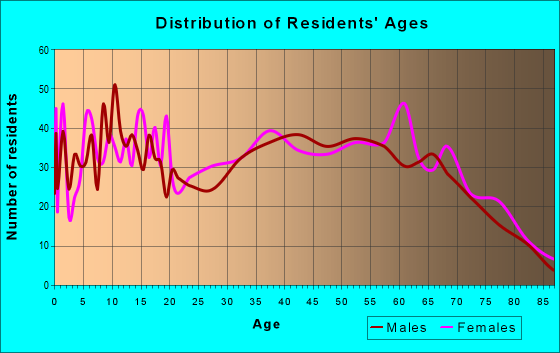
Median resident age:
This zip code:
42.4 years
Tennessee median age:
39.2 years
Average household size:
This zip code:
2.2 people
Tennessee:
2.4 people
Averages for the 2020 tax year for zip code 37324, filed in 2021:
Average Adjusted Gross Income (AGI) in 2020: $44,400 (Individual Income Tax Returns)
Here:
$44,400
State:
$69,014
Salary/wage: $39,403 (reported on 83.2% of returns)
Here:
$39,403
State:
$55,872
(% of AGI for various income ranges: 1123.9% for AGIs below $25k, 3525.9% for AGIs $25k-50k, 6289.2% for AGIs $50k-75k, 9114.2% for AGIs $75k-100k, 13597.1% for AGIs $100k-200k)
Taxable interest for individuals: $974 (reported on 24.4% of returns)
This zip code:
$974
Tennessee:
$1,945
(% of AGI for various income ranges: 18.6% for AGIs below $25k, 12.4% for AGIs $25k-50k, 51.9% for AGIs $50k-75k, 70.8% for AGIs $75k-100k, 99.3% for AGIs $100k-200k)
Ordinary dividends: $3,448 (reported on 8.8% of returns)
Here:
$3,448
State:
$8,105
(% of AGI for various income ranges: 7.9% for AGIs below $25k, 16.0% for AGIs $25k-50k, 30.0% for AGIs $50k-75k, 130.0% for AGIs $75k-100k, 242.9% for AGIs $100k-200k)
Net capital gain/loss in AGI: +$6,372 (reported on 7.6% of returns)
Here:
+$6,372
State:
+$33,664
(% of AGI for various income ranges: 9.7% for AGIs below $25k, 17.8% for AGIs $25k-50k, 43.8% for AGIs $50k-75k, 221.7% for AGIs $75k-100k, 424.3% for AGIs $100k-200k)
Profit/loss from business: +$15,062 (reported on 13.4% of returns)
Here:
+$15,062
State:
+$18,991
(% of AGI for various income ranges: 139.0% for AGIs below $25k, 113.4% for AGIs $25k-50k, 180.0% for AGIs $50k-75k, 231.7% for AGIs $75k-100k, 1725.0% for AGIs $100k-200k)
Taxable individual retirement arrangement distribution: $13,559 (reported on 7.1% of returns)
37324:
$13,559
Tennessee:
$20,036
(% of AGI for various income ranges: 56.7% for AGIs below $25k, 60.2% for AGIs $25k-50k, 290.0% for AGIs $50k-75k, 567.1% for AGIs $100k-200k)
Total itemized deductions: $27,267 (reported on 1.3% of returns)
Here:
$27,267
State:
$40,136
(% of AGI for various income ranges: 314.6% for AGIs $50k-75k)
Taxes paid: $3,433 (reported on 1.3% of returns)
37324:
$3,433
State:
$6,038
(% of AGI for various income ranges: 39.6% for AGIs $50k-75k)
Earned income credit: $2,340 (reported on 23.9% of returns)
Here:
$2,340
State:
$2,391
(% of AGI for various income ranges: 118.5% for AGIs below $25k, 82.9% for AGIs $25k-50k)
Percentage of individuals using paid preparers for their 2020 taxes: 92.4%
Here:
92%
State:
93%
(% for various income ranges: 91.5% for AGIs below $25k, 94.3% for AGIs $25k-50k, 91.4% for AGIs $50k-75k, 94.1% for AGIs $75k-100k, 90.0% for AGIs $100k-200k, 100.0% for AGIs over 200k)
Averages for the 2012 tax year for zip code 37324, filed in 2013:
Average Adjusted Gross Income (AGI) in 2012: $36,731 (Individual Income Tax Returns)
Here:
$36,731
State:
$53,767
Salary/wage: $33,842 (reported on 83.6% of returns)
Here:
$33,842
State:
$45,421
(% of AGI for various income ranges: 75.9% for AGIs below $25k, 82.5% for AGIs $25k-50k, 81.0% for AGIs $50k-75k, 78.4% for AGIs $75k-100k, 66.9% for AGIs $100k-200k)
Taxable interest for individuals: $1,060 (reported on 28.6% of returns)
This zip code:
$1,060
Tennessee:
$1,732
(% of AGI for various income ranges: 1.2% for AGIs below $25k, 0.5% for AGIs $25k-50k, 0.9% for AGIs $50k-75k, 1.6% for AGIs $75k-100k, 0.3% for AGIs $100k-200k)
Ordinary dividends: $1,114 (reported on 10.0% of returns)
Here:
$1,114
State:
$6,739
(% of AGI for various income ranges: 0.3% for AGIs below $25k, 0.2% for AGIs $25k-50k, 0.3% for AGIs $50k-75k, 0.4% for AGIs $75k-100k, 0.3% for AGIs $100k-200k)
Net capital gain/loss in AGI: +$2,135 (reported on 7.7% of returns)
Here:
+$2,135
State:
+$19,082
(% of AGI for various income ranges: 0.4% for AGIs $25k-50k, 0.1% for AGIs $50k-75k, 1.5% for AGIs $75k-100k, 0.4% for AGIs $100k-200k)
Profit/loss from business: +$13,761 (reported on 15.0% of returns)
Here:
+$13,761
State:
+$15,240
(% of AGI for various income ranges: 7.9% for AGIs below $25k, 2.2% for AGIs $25k-50k, 1.5% for AGIs $50k-75k, 15.7% for AGIs $100k-200k)
Taxable individual retirement arrangement distribution: $13,232 (reported on 8.6% of returns)
37324:
$13,232
Tennessee:
$15,505
(% of AGI for various income ranges: 3.8% for AGIs below $25k, 2.5% for AGIs $25k-50k, 2.5% for AGIs $50k-75k, 2.1% for AGIs $75k-100k, 4.5% for AGIs $100k-200k)
Total itemized deductions: $16,032 (20% of AGI, reported on 8.6% of returns)
Here:
$16,032
State:
$21,976
Here:
20.5% of AGI
State:
17.8% of AGI
(% of AGI for various income ranges: 4.5% for AGIs $25k-50k, 4.0% for AGIs $50k-75k, 4.4% for AGIs $75k-100k, 5.2% for AGIs $100k-200k)
Charity contributions: $4,283 (reported on 5.5% of returns)
Here:
$4,283
State:
$6,709
(% of AGI for various income ranges: 0.6% for AGIs $25k-50k, 0.6% for AGIs $50k-75k, 0.8% for AGIs $75k-100k, 1.1% for AGIs $100k-200k)
Taxes paid: $3,211 (reported on 8.2% of returns)
37324:
$3,211
State:
$4,829
(% of AGI for various income ranges: 0.6% for AGIs $25k-50k, 0.7% for AGIs $50k-75k, 0.9% for AGIs $75k-100k, 1.3% for AGIs $100k-200k)
Earned income credit: $2,132 (reported on 28.2% of returns)
Here:
$2,132
State:
$2,404
(% of AGI for various income ranges: 8.1% for AGIs below $25k, 1.1% for AGIs $25k-50k)
Percentage of individuals using paid preparers for their 2012 taxes: 63.2%
Here:
63%
State:
52%
(% for various income ranges: 61.1% for AGIs below $25k, 59.3% for AGIs $25k-50k, 70.4% for AGIs $50k-75k, 71.4% for AGIs $75k-100k, 75.0% for AGIs $100k-200k)
Averages for the 2004 tax year for zip code 37324, filed in 2005:
Average Adjusted Gross Income (AGI) in 2004: $31,886 (Individual Income Tax Returns)
Here:
$31,886
State:
$44,088
Salary/wage: $29,924 (reported on 84.3% of returns)
Here:
$29,924
State:
$38,825
(% of AGI for various income ranges: 103.8% for AGIs below $10k, 77.1% for AGIs $10k-25k, 84.5% for AGIs $25k-50k, 86.0% for AGIs $50k-75k, 79.2% for AGIs $75k-100k, 49.0% for AGIs over 100k)
Taxable interest for individuals: $1,308 (reported on 39.0% of returns)
This zip code:
$1,308
Tennessee:
$1,802
(% of AGI for various income ranges: 5.1% for AGIs below $10k, 2.5% for AGIs $10k-25k, 1.3% for AGIs $25k-50k, 0.9% for AGIs $50k-75k, 1.6% for AGIs $75k-100k, 1.6% for AGIs over 100k)
Taxable dividends: $1,629 (reported on 12.6% of returns)
Here:
$1,629
State:
$3,727
(% of AGI for various income ranges: 1.3% for AGIs below $10k, 0.6% for AGIs $10k-25k, 0.5% for AGIs $25k-50k, 0.8% for AGIs $50k-75k, 0.6% for AGIs $75k-100k, 0.6% for AGIs over 100k)
Net capital gain/loss: +$5,382 (reported on 11.0% of returns)
Here:
+$5,382
State:
+$15,776
(% of AGI for various income ranges: -0.7% for AGIs below $10k, 0.5% for AGIs $10k-25k, 0.9% for AGIs $25k-50k, 0.6% for AGIs $50k-75k, 4.6% for AGIs $75k-100k, 5.8% for AGIs over 100k)
Profit/loss from business: +$14,031 (reported on 15.0% of returns)
Here:
+$14,031
State:
+$12,882
(% of AGI for various income ranges: 15.5% for AGIs below $10k, 4.1% for AGIs $10k-25k, 3.4% for AGIs $25k-50k, 1.9% for AGIs $50k-75k, 6.0% for AGIs $75k-100k, 26.1% for AGIs over 100k)
IRA payment deduction: $2,750 (reported on 1.5% of returns)
37324:
$2,750
Tennessee:
$2,934
Total itemized deductions: $13,932 (23% of AGI, reported on 10.2% of returns)
Here:
$13,932
State:
$18,035
Here:
22.8% of AGI
State:
19.9% of AGI
(% of AGI for various income ranges: 3.4% for AGIs $10k-25k, 4.0% for AGIs $25k-50k, 5.1% for AGIs $50k-75k, 5.5% for AGIs $75k-100k, 5.5% for AGIs over 100k)
Charity contributions deductions: $2,957 (5% of AGI, reported on 7.6% of returns)
Here:
$2,957
State:
$5,167
Here:
4.8% of AGI
State:
5.3% of AGI
(% of AGI for various income ranges: 0.4% for AGIs $10k-25k, 0.4% for AGIs $25k-50k, 0.9% for AGIs $50k-75k, 0.9% for AGIs $75k-100k, 1.4% for AGIs over 100k)
Total tax: $4,006 (reported on 71.3% of returns)
37324:
$4,006
State:
$7,482
(% of AGI for various income ranges: 4.2% for AGIs below $10k, 3.8% for AGIs $10k-25k, 6.4% for AGIs $25k-50k, 9.0% for AGIs $50k-75k, 11.5% for AGIs $75k-100k, 19.7% for AGIs over 100k)
Earned income credit: $1,742 (reported on 22.4% of returns)
Here:
$1,742
State:
$1,826
Percentage of individuals using paid preparers for their 2004 taxes: 70.6%
Here:
71%
State:
60%
(% for various income ranges: 66.5% for AGIs below $10k, 73.2% for AGIs $10k-25k, 72.7% for AGIs $25k-50k, 66.8% for AGIs $50k-75k, 67.5% for AGIs $75k-100k, 79.7% for AGIs over 100k)
Likely homosexual households (counted as self-reported same-sex unmarried-partner households)
Lesbian couples: 0.5% of all households
Gay men: 0.0% of all households
Household received Food Stamps/SNAP in the past 12 months: 304 Household did not receive Food Stamps/SNAP in the past 12 months: 2,011
Women who had a birth in the past 12 months: 29 (19 now married, 10 unmarried) Women who did not have a birth in the past 12 months: 1,263 (450 now married, 812 unmarried)
Housing units in zip code 37324 with a mortgage: 576 (28 second mortgage, 19 both second mortgage and home equity loan) Median monthly owner costs for units with a mortgage: $1,455 Median monthly owner costs for units without a mortgage: $468
Residents with income below the poverty level in 2022:
This zip code:
16.6%
Whole state:
13.3%
Residents with income below 50% of the poverty level in 2022:
This zip code:
8.1%
Whole state:
7.1%
Median number of rooms in houses and condos:
Here:
6.0
State:
6.5
Median number of rooms in apartments:
Here:
4.6
State:
4.4
Notable locations in this zip code not listed on our city pages
Notable locations in zip code 37324: Decherd Fire Department Station 2 (A), Decherd City Hall (B), Capitol Hill Volunteer Fire Department (C), Alto - Oak Grove Volunteer Fire Department (D), Decherd Fire Department Station 1 (E). Display/hide their locations on the map
Churches in zip code 37324 include: Providence United Methodist Church (A), Pelham Church of Christ (B), Warren Chapel (C), Wilder Chapel (D), Shady Grove Church (E), Decherd Presbyterian Church (F), First Baptist Church of Decherd (G), Decherd Nazarene Church (H), Good Shepherd Catholic Church (I). Display/hide their locations on the map
Cemeteries: Swann Cemetery (1), Ikard Cemetery (2), Jackson Cemetery (3), Watson Cemetery (4), Alto Cemetery (5), West Cemetery (6), Lewis Cemetery (7). Display/hide their locations on the map
Streams, rivers, and creeks: Gipson Branch (A), Mud Creek (B), Dick Creek (C), Greenhaw Creek (D), Gum Creek (E), Bluespring Branch (F), Petty Branch (G), Yellow Branch (H), Rose Creek (I). Display/hide their locations on the map
Size of family households: 504 2-persons, 452 3-persons, 211 4-persons, 53 5-persons, 59 6-persons
Size of nonfamily households: 881 1-person, 152 2-persons
388 married couples with children.
248 single-parent households (30 men, 218 women).
97.3% of residents of 37324 zip code speak English at home.
0.8% of residents speak Spanish at home (54% very well, 28% well, 18% not well).
0.2% of residents speak other Indo-European language at home (100% very well).
1.1% of residents speak Asian or Pacific Island language at home (45% very well, 33% not well, 22% not at all).
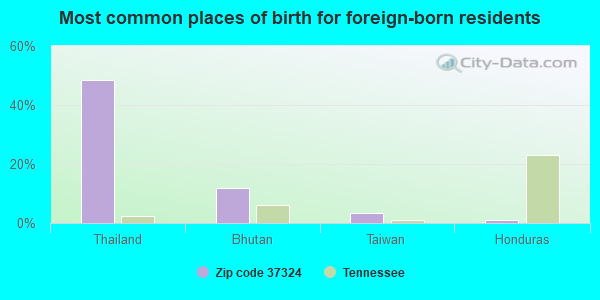
Foreign born population: 117 (2.4%) (50.9% of them are naturalized citizens)
This zip code:
2.4%
Whole state:
5.6%
48%Thailand
12%Bhutan
3%Taiwan
1%Honduras
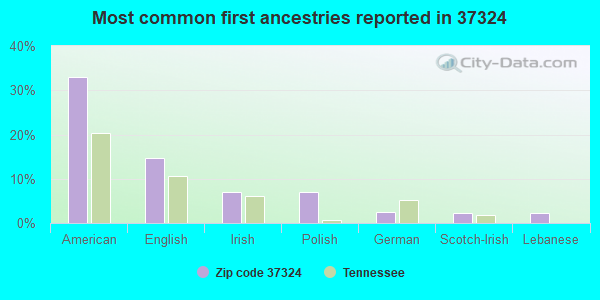
33%American
15%English
7%Irish
7%Polish
2%German
2%Scotch-Irish
2%Lebanese
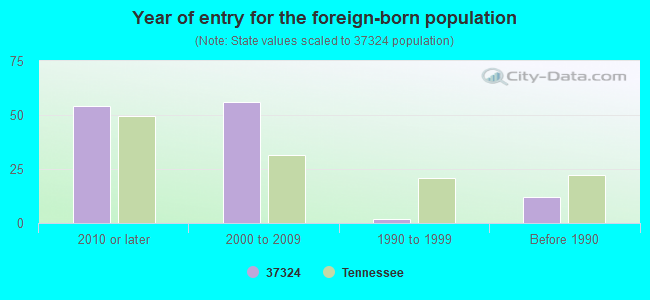
Year of entry for the foreign-born population
542010 or later
562000 to 2009
21990 to 1999
12Before 1990
Facilities with environmental interests located in this zip code:
DECHERD ELEMENTARY SCHOOL (401 BRATTON ST in DECHERD, TN)
(Geographic Names Information System) (National Center for Education Statistics) - STATE ID-0040 Organizations: FRANKLIN COUNTY SCHOOL DISTRCT (SCHOOL DISTRICT)
CAROUSEL SCREEN PRINTING (HIGHWAY 50 in DECHERD, TN)
Conditionally Exempt Small Quantity Generators, less than 100 kg/month of hazardous waste (Resource Conservation and Recovery Act (tracking hazardous waste)) - notification Organizations: IRIS R RUDDER (CONTACT/OWNER)
DECHERD CITY STP (311 4TH AVE. S. in DECHERD, TN)
National Pollutant Discharge Elimination System MAJOR (Tracking pollutant discharge elimination systems) - permit Business SIC classification: SEWERAGE SYSTEMS Organizations: BETTY DON HENSHAW (CONTACT/OWNER)
Alternative names: DECHERD WWTP
Housing units lacking complete plumbing facilities: 4.7% Housing units lacking complete kitchen facilities: 4.7%
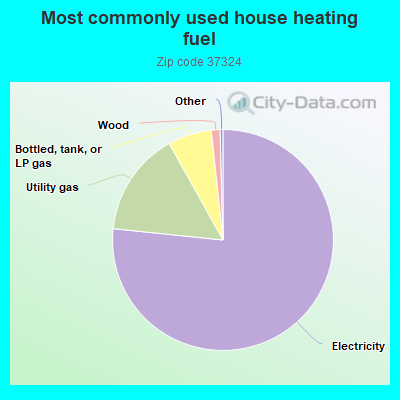
76.8%Electricity
15.3%Utility gas
6.4%Bottled, tank, or LP gas
1.3%Wood
Population in 1990: 6,576.
Place of birth for U.S.-born residents:
This state: 3,260
Northeast: 313
Midwest: 375
South: 773
West: 133
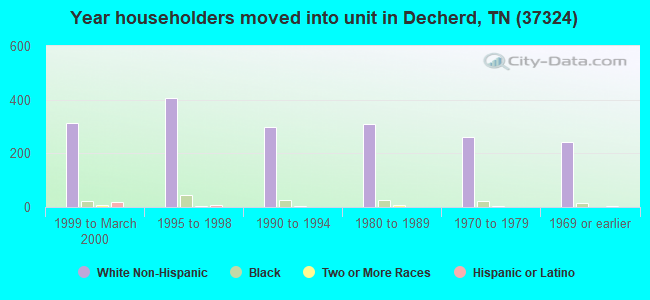
62% of the 37324 zip code residents lived in the same house 5 years ago. Out of people who lived in different houses, 64% lived in this county. Out of people who lived in different counties, 50% lived in Tennessee.
86% of the 37324 zip code residents lived in the same house 1 year ago. Out of people who lived in different houses, 66% moved from this county. Out of people who lived in different houses, 8% moved from different county within same state. Out of people who lived in different houses, 20% moved from different state.
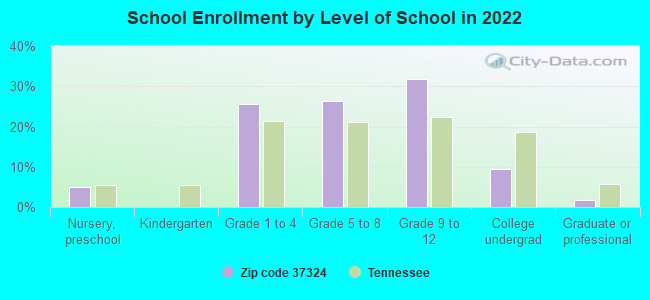
Private vs. public school enrollment:
Students in private schools in grades 1 to 8 (elementary and middle school): 72
Here:
16.3%
Tennessee:
15.0%
Students in private schools in grades 9 to 12 (high school): 47
Here:
17.9%
Tennessee:
16.2%
Students in private undergraduate colleges: 5
Here:
6.3%
Tennessee:
23.5%
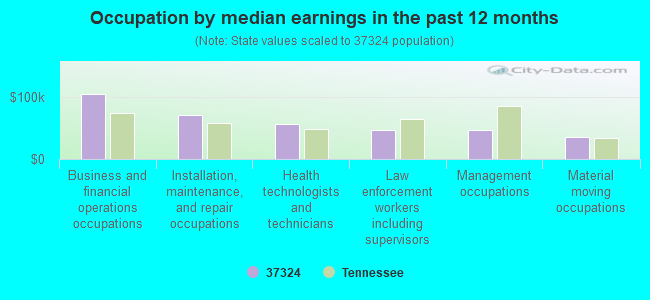
Occupation by median earnings in the past 12 months ($)
105,635Business and financial operations occupations
71,587Installation, maintenance, and repair occupations
56,716Health technologists and technicians
47,399Law enforcement workers including supervisors
46,109Management occupations
35,976Material moving occupations
Companies with federal contracts located in this zip code:
STARNES FARM DRAINING (316 WOODLAND DR in DECHERD, TN; small business)
$79,000 with Air Force for Conservation and Development. Signed on 2002-07-22. Completion date: 2002-12-31.
Top industries in this zip code by the number of employees in 2005:
Construction: Industrial Building Construction (250-499 employees: 1 establishment)
Accommodation and Food Services: Limited-Service Restaurants (20-49: 2, 5-9: 2)
Finance and Insurance: Commercial Banking (10-19: 2, 1-4: 1)
Professional, Scientific, and Technical Services: Tax Preparation Services (10-19: 2)
Fatal accident statistics in 2013:
Fatal accident count: 1
Vehicles involved in fatal accidents: 1
Fatal accidents caused by drunken drivers: 0
Fatalities: 1
Persons involved in fatal accidents: 1
Pedestrians involved in fatal accidents: 0
Fatal accident statistics in 2012:
Fatal accident count: 3
Vehicles involved in fatal accidents: 3
Fatal accidents caused by drunken drivers: 1
Fatalities: 3
Persons involved in fatal accidents: 3
Pedestrians involved in fatal accidents: 0
2003 - 2018 National Fire Incident Reporting System (NFIRS) incidents
According to the data from the years 2003 - 2018 the average number of fire incidents per year is 61. The highest number of fire incidents - 106 took place in 2011, and the least - 29 in 2003. The data has an increasing trend.
When looking into fire subcategories, the most incidents belonged to: Structure Fires (44.7%), and Outside Fires (36.4%).
Fire incident types reported to NFIRS in Zip Code 37324
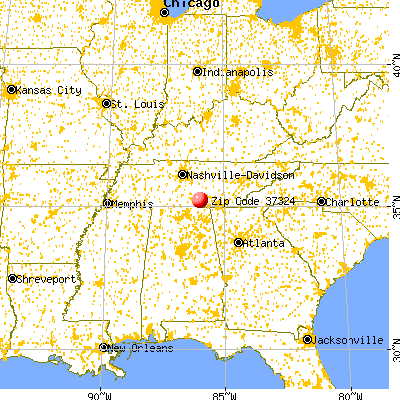


 Nearest zip codes: 37318, 37375, 37330, 37398, 37342, 37356.


 According to the data from the years 2003 - 2018 the average number of fire incidents per year is 61. The highest number of fire incidents - 106 took place in 2011, and the least - 29 in 2003. The data has an increasing trend.
 When looking into fire subcategories, the most incidents belonged to: Structure Fires (44.7%), and Outside Fires (36.4%).