Cities: Brighton, TN (4.73%) ,
Atoka, TN (0.34%) ,
Gilt Edge, TN (0.33%) ,
Covington, TN (0.31%) Counties: Tipton County, TN (95.03%) ,
Shelby County, TN (4.97%) Estimated zip code population in 2022: 10,527
Zip code population in 2010: 9,908
Zip code population in 2000: 8,278
Houses and condos: 3,944
Renter-occupied apartments: 923
% of renters here:
24%State:
33%
March 2022 cost of living index in zip code 38011: 80.2
(low, U.S. average is 100)
Land area: 58.9
sq. mi.
Water area: 0.1
sq. mi.
Population density: 179 people per square mile (very low).
OSM Map
General Map
Google Map
MSN Map
OSM Map
General Map
Google Map
MSN Map
OSM Map
General Map
Google Map
MSN Map
OSM Map
General Map
Google Map
MSN Map
Please wait while loading the map...
Real estate property taxes paid for housing units in 2022:
This zip code:
0.5% ($1,080)Tennessee:
0.5% ($1,376)
Median real estate property taxes paid for housing units with mortgages in 2022: $1,110 (0.4%)
Median real estate property taxes paid for housing units with no mortgage in 2022: $1,030 (0.5%)
Profiles of local businesses
Business Search - 14 Million verified businesses
Males: 5,479 Females: 5,047
For population 25 years and over in 38011:
High school or higher: 89.3%Bachelor's degree or higher: 18.2%Graduate or professional degree: 5.7%Unemployed: 2.1%Mean travel time to work (commute): 31.4 minutes
For population 15 years and over in 38011:
Never married: 26.9%Now married: 54.9%Separated: 1.0%Widowed: 5.9%Divorced: 11.2%
Zip code 38011 compared to state average:
Foreign-born population percentage below state average. Length of stay since moving in significantly above state average. Percentage of population with a bachelor's degree or higher below state average. 8,423 80.0% White 1,169 11.1% Black 527 5.0% Hispanic or Latino 259 2.5% Two or more races 132 1.3% Some other race 13 0.1% Asian 2 0.02% American Indian
Data:
Median household income ($)
Median household income (% change since 2000)
Household income diversity
Ratio of average income to average house value (%)
Ratio of average income to average rent
Median household income ($) - White
Median household income ($) - Black or African American
Median household income ($) - Asian
Median household income ($) - Hispanic or Latino
Median household income ($) - American Indian and Alaska Native
Median household income ($) - Multirace
Median household income ($) - Other Race
Median household income for houses/condos with a mortgage ($)
Median household income for apartments without a mortgage ($)
Races - White alone (%)
Races - White alone (% change since 2000)
Races - Black alone (%)
Races - Black alone (% change since 2000)
Races - American Indian alone (%)
Races - American Indian alone (% change since 2000)
Races - Asian alone (%)
Races - Asian alone (% change since 2000)
Races - Hispanic (%)
Races - Hispanic (% change since 2000)
Races - Native Hawaiian and Other Pacific Islander alone (%)
Races - Native Hawaiian and Other Pacific Islander alone (% change since 2000)
Races - Two or more races (%)
Races - Two or more races (% change since 2000)
Races - Other race alone (%)
Races - Other race alone (% change since 2000)
Racial diversity
Unemployment (%)
Unemployment (% change since 2000)
Unemployment (%) - White
Unemployment (%) - Black or African American
Unemployment (%) - Asian
Unemployment (%) - Hispanic or Latino
Unemployment (%) - American Indian and Alaska Native
Unemployment (%) - Multirace
Unemployment (%) - Other Race
Population density (people per square mile)
Population - Males (%)
Population - Females (%)
Population - Males (%) - White
Population - Males (%) - Black or African American
Population - Males (%) - Asian
Population - Males (%) - Hispanic or Latino
Population - Males (%) - American Indian and Alaska Native
Population - Males (%) - Multirace
Population - Males (%) - Other Race
Population - Females (%) - White
Population - Females (%) - Black or African American
Population - Females (%) - Asian
Population - Females (%) - Hispanic or Latino
Population - Females (%) - American Indian and Alaska Native
Population - Females (%) - Multirace
Population - Females (%) - Other Race
Coronavirus confirmed cases (May 07, 2024)
Deaths caused by coronavirus (May 07, 2024)
Coronavirus confirmed cases (per 100k population) (May 07, 2024)
Deaths caused by coronavirus (per 100k population) (May 07, 2024)
Daily increase in number of cases (May 07, 2024)
Weekly increase in number of cases (May 07, 2024)
Cases doubled (in days) (May 07, 2024)
Hospitalized patients (Apr 18, 2022)
Negative test results (Apr 18, 2022)
Total test results (Apr 18, 2022)
COVID Vaccine doses distributed (per 100k population) (Sep 19, 2023)
COVID Vaccine doses administered (per 100k population) (Sep 19, 2023)
COVID Vaccine doses distributed (Sep 19, 2023)
COVID Vaccine doses administered (Sep 19, 2023)
Likely homosexual households (%)
Likely homosexual households (% change since 2000)
Likely homosexual households - Lesbian couples (%)
Likely homosexual households - Lesbian couples (% change since 2000)
Likely homosexual households - Gay men (%)
Likely homosexual households - Gay men (% change since 2000)
Cost of living index
Median gross rent ($)
Median contract rent ($)
Median monthly housing costs ($)
Median house or condo value ($)
Median house or condo value ($ change since 2000)
Mean house or condo value by units in structure - 1, detached ($)
Mean house or condo value by units in structure - 1, attached ($)
Mean house or condo value by units in structure - 2 ($)
Mean house or condo value by units in structure by units in structure - 3 or 4 ($)
Mean house or condo value by units in structure - 5 or more ($)
Mean house or condo value by units in structure - Boat, RV, van, etc. ($)
Mean house or condo value by units in structure - Mobile home ($)
Median house or condo value ($) - White
Median house or condo value ($) - Black or African American
Median house or condo value ($) - Asian
Median house or condo value ($) - Hispanic or Latino
Median house or condo value ($) - American Indian and Alaska Native
Median house or condo value ($) - Multirace
Median house or condo value ($) - Other Race
Median resident age
Resident age diversity
Median resident age - Males
Median resident age - Females
Median resident age - White
Median resident age - Black or African American
Median resident age - Asian
Median resident age - Hispanic or Latino
Median resident age - American Indian and Alaska Native
Median resident age - Multirace
Median resident age - Other Race
Median resident age - Males - White
Median resident age - Males - Black or African American
Median resident age - Males - Asian
Median resident age - Males - Hispanic or Latino
Median resident age - Males - American Indian and Alaska Native
Median resident age - Males - Multirace
Median resident age - Males - Other Race
Median resident age - Females - White
Median resident age - Females - Black or African American
Median resident age - Females - Asian
Median resident age - Females - Hispanic or Latino
Median resident age - Females - American Indian and Alaska Native
Median resident age - Females - Multirace
Median resident age - Females - Other Race
Commute - mean travel time to work (minutes)
Travel time to work - Less than 5 minutes (%)
Travel time to work - Less than 5 minutes (% change since 2000)
Travel time to work - 5 to 9 minutes (%)
Travel time to work - 5 to 9 minutes (% change since 2000)
Travel time to work - 10 to 19 minutes (%)
Travel time to work - 10 to 19 minutes (% change since 2000)
Travel time to work - 20 to 29 minutes (%)
Travel time to work - 20 to 29 minutes (% change since 2000)
Travel time to work - 30 to 39 minutes (%)
Travel time to work - 30 to 39 minutes (% change since 2000)
Travel time to work - 40 to 59 minutes (%)
Travel time to work - 40 to 59 minutes (% change since 2000)
Travel time to work - 60 to 89 minutes (%)
Travel time to work - 60 to 89 minutes (% change since 2000)
Travel time to work - 90 or more minutes (%)
Travel time to work - 90 or more minutes (% change since 2000)
Marital status - Never married (%)
Marital status - Now married (%)
Marital status - Separated (%)
Marital status - Widowed (%)
Marital status - Divorced (%)
Median family income ($)
Median family income (% change since 2000)
Median non-family income ($)
Median non-family income (% change since 2000)
Median per capita income ($)
Median per capita income (% change since 2000)
Median family income ($) - White
Median family income ($) - Black or African American
Median family income ($) - Asian
Median family income ($) - Hispanic or Latino
Median family income ($) - American Indian and Alaska Native
Median family income ($) - Multirace
Median family income ($) - Other Race
Median year house/condo built
Median year apartment built
Year house built - Built 2005 or later (%)
Year house built - Built 2000 to 2004 (%)
Year house built - Built 1990 to 1999 (%)
Year house built - Built 1980 to 1989 (%)
Year house built - Built 1970 to 1979 (%)
Year house built - Built 1960 to 1969 (%)
Year house built - Built 1950 to 1959 (%)
Year house built - Built 1940 to 1949 (%)
Year house built - Built 1939 or earlier (%)
Average household size
Household density (households per square mile)
Average household size - White
Average household size - Black or African American
Average household size - Asian
Average household size - Hispanic or Latino
Average household size - American Indian and Alaska Native
Average household size - Multirace
Average household size - Other Race
Occupied housing units (%)
Vacant housing units (%)
Owner occupied housing units (%)
Renter occupied housing units (%)
Vacancy status - For rent (%)
Vacancy status - For sale only (%)
Vacancy status - Rented or sold, not occupied (%)
Vacancy status - For seasonal, recreational, or occasional use (%)
Vacancy status - For migrant workers (%)
Vacancy status - Other vacant (%)
Residents with income below the poverty level (%)
Residents with income below 50% of the poverty level (%)
Children below poverty level (%)
Poor families by family type - Married-couple family (%)
Poor families by family type - Male, no wife present (%)
Poor families by family type - Female, no husband present (%)
Poverty status for native-born residents (%)
Poverty status for foreign-born residents (%)
Poverty among high school graduates not in families (%)
Poverty among people who did not graduate high school not in families (%)
Residents with income below the poverty level (%) - White
Residents with income below the poverty level (%) - Black or African American
Residents with income below the poverty level (%) - Asian
Residents with income below the poverty level (%) - Hispanic or Latino
Residents with income below the poverty level (%) - American Indian and Alaska Native
Residents with income below the poverty level (%) - Multirace
Residents with income below the poverty level (%) - Other Race
Air pollution - Air Quality Index (AQI)
Air pollution - CO
Air pollution - NO2
Air pollution - SO2
Air pollution - Ozone
Air pollution - PM10
Air pollution - PM25
Air pollution - Pb
Crime - Murders per 100,000 population
Crime - Rapes per 100,000 population
Crime - Robberies per 100,000 population
Crime - Assaults per 100,000 population
Crime - Burglaries per 100,000 population
Crime - Thefts per 100,000 population
Crime - Auto thefts per 100,000 population
Crime - Arson per 100,000 population
Crime - City-data.com crime index
Crime - Violent crime index
Crime - Property crime index
Crime - Murders per 100,000 population (5 year average)
Crime - Rapes per 100,000 population (5 year average)
Crime - Robberies per 100,000 population (5 year average)
Crime - Assaults per 100,000 population (5 year average)
Crime - Burglaries per 100,000 population (5 year average)
Crime - Thefts per 100,000 population (5 year average)
Crime - Auto thefts per 100,000 population (5 year average)
Crime - Arson per 100,000 population (5 year average)
Crime - City-data.com crime index (5 year average)
Crime - Violent crime index (5 year average)
Crime - Property crime index (5 year average)
1996 Presidential Elections Results (%) - Democratic Party (Clinton)
1996 Presidential Elections Results (%) - Republican Party (Dole)
1996 Presidential Elections Results (%) - Other
2000 Presidential Elections Results (%) - Democratic Party (Gore)
2000 Presidential Elections Results (%) - Republican Party (Bush)
2000 Presidential Elections Results (%) - Other
2004 Presidential Elections Results (%) - Democratic Party (Kerry)
2004 Presidential Elections Results (%) - Republican Party (Bush)
2004 Presidential Elections Results (%) - Other
2008 Presidential Elections Results (%) - Democratic Party (Obama)
2008 Presidential Elections Results (%) - Republican Party (McCain)
2008 Presidential Elections Results (%) - Other
2012 Presidential Elections Results (%) - Democratic Party (Obama)
2012 Presidential Elections Results (%) - Republican Party (Romney)
2012 Presidential Elections Results (%) - Other
2016 Presidential Elections Results (%) - Democratic Party (Clinton)
2016 Presidential Elections Results (%) - Republican Party (Trump)
2016 Presidential Elections Results (%) - Other
2020 Presidential Elections Results (%) - Democratic Party (Biden)
2020 Presidential Elections Results (%) - Republican Party (Trump)
2020 Presidential Elections Results (%) - Other
Ancestries Reported - Arab (%)
Ancestries Reported - Czech (%)
Ancestries Reported - Danish (%)
Ancestries Reported - Dutch (%)
Ancestries Reported - English (%)
Ancestries Reported - French (%)
Ancestries Reported - French Canadian (%)
Ancestries Reported - German (%)
Ancestries Reported - Greek (%)
Ancestries Reported - Hungarian (%)
Ancestries Reported - Irish (%)
Ancestries Reported - Italian (%)
Ancestries Reported - Lithuanian (%)
Ancestries Reported - Norwegian (%)
Ancestries Reported - Polish (%)
Ancestries Reported - Portuguese (%)
Ancestries Reported - Russian (%)
Ancestries Reported - Scotch-Irish (%)
Ancestries Reported - Scottish (%)
Ancestries Reported - Slovak (%)
Ancestries Reported - Subsaharan African (%)
Ancestries Reported - Swedish (%)
Ancestries Reported - Swiss (%)
Ancestries Reported - Ukrainian (%)
Ancestries Reported - United States (%)
Ancestries Reported - Welsh (%)
Ancestries Reported - West Indian (%)
Ancestries Reported - Other (%)
Educational Attainment - No schooling completed (%)
Educational Attainment - Less than high school (%)
Educational Attainment - High school or equivalent (%)
Educational Attainment - Less than 1 year of college (%)
Educational Attainment - 1 or more years of college (%)
Educational Attainment - Associate degree (%)
Educational Attainment - Bachelor's degree (%)
Educational Attainment - Master's degree (%)
Educational Attainment - Professional school degree (%)
Educational Attainment - Doctorate degree (%)
School Enrollment - Nursery, preschool (%)
School Enrollment - Kindergarten (%)
School Enrollment - Grade 1 to 4 (%)
School Enrollment - Grade 5 to 8 (%)
School Enrollment - Grade 9 to 12 (%)
School Enrollment - College undergrad (%)
School Enrollment - Graduate or professional (%)
School Enrollment - Not enrolled in school (%)
School enrollment - Public schools (%)
School enrollment - Private schools (%)
School enrollment - Not enrolled (%)
Median number of rooms in houses and condos
Median number of rooms in apartments
Housing units lacking complete plumbing facilities (%)
Housing units lacking complete kitchen facilities (%)
Density of houses
Urban houses (%)
Rural houses (%)
Households with people 60 years and over (%)
Households with people 65 years and over (%)
Households with people 75 years and over (%)
Households with one or more nonrelatives (%)
Households with no nonrelatives (%)
Population in households (%)
Family households (%)
Nonfamily households (%)
Population in families (%)
Family households with own children (%)
Median number of bedrooms in owner occupied houses
Mean number of bedrooms in owner occupied houses
Median number of bedrooms in renter occupied houses
Mean number of bedrooms in renter occupied houses
Median number of vehichles in owner occupied houses
Mean number of vehichles in owner occupied houses
Median number of vehichles in renter occupied houses
Mean number of vehichles in renter occupied houses
Mortgage status - with mortgage (%)
Mortgage status - with second mortgage (%)
Mortgage status - with home equity loan (%)
Mortgage status - with both second mortgage and home equity loan (%)
Mortgage status - without a mortgage (%)
Average family size
Average family size - White
Average family size - Black or African American
Average family size - Asian
Average family size - Hispanic or Latino
Average family size - American Indian and Alaska Native
Average family size - Multirace
Average family size - Other Race
Geographical mobility - Same house 1 year ago (%)
Geographical mobility - Moved within same county (%)
Geographical mobility - Moved from different county within same state (%)
Geographical mobility - Moved from different state (%)
Geographical mobility - Moved from abroad (%)
Place of birth - Born in state of residence (%)
Place of birth - Born in other state (%)
Place of birth - Native, outside of US (%)
Place of birth - Foreign born (%)
Housing units in structures - 1, detached (%)
Housing units in structures - 1, attached (%)
Housing units in structures - 2 (%)
Housing units in structures - 3 or 4 (%)
Housing units in structures - 5 to 9 (%)
Housing units in structures - 10 to 19 (%)
Housing units in structures - 20 to 49 (%)
Housing units in structures - 50 or more (%)
Housing units in structures - Mobile home (%)
Housing units in structures - Boat, RV, van, etc. (%)
House/condo owner moved in on average (years ago)
Renter moved in on average (years ago)
Year householder moved into unit - Moved in 1999 to March 2000 (%)
Year householder moved into unit - Moved in 1995 to 1998 (%)
Year householder moved into unit - Moved in 1990 to 1994 (%)
Year householder moved into unit - Moved in 1980 to 1989 (%)
Year householder moved into unit - Moved in 1970 to 1979 (%)
Year householder moved into unit - Moved in 1969 or earlier (%)
Means of transportation to work - Drove car alone (%)
Means of transportation to work - Carpooled (%)
Means of transportation to work - Public transportation (%)
Means of transportation to work - Bus or trolley bus (%)
Means of transportation to work - Streetcar or trolley car (%)
Means of transportation to work - Subway or elevated (%)
Means of transportation to work - Railroad (%)
Means of transportation to work - Ferryboat (%)
Means of transportation to work - Taxicab (%)
Means of transportation to work - Motorcycle (%)
Means of transportation to work - Bicycle (%)
Means of transportation to work - Walked (%)
Means of transportation to work - Other means (%)
Working at home (%)
Industry diversity
Most Common Industries - Agriculture, forestry, fishing and hunting, and mining (%)
Most Common Industries - Agriculture, forestry, fishing and hunting (%)
Most Common Industries - Mining, quarrying, and oil and gas extraction (%)
Most Common Industries - Construction (%)
Most Common Industries - Manufacturing (%)
Most Common Industries - Wholesale trade (%)
Most Common Industries - Retail trade (%)
Most Common Industries - Transportation and warehousing, and utilities (%)
Most Common Industries - Transportation and warehousing (%)
Most Common Industries - Utilities (%)
Most Common Industries - Information (%)
Most Common Industries - Finance and insurance, and real estate and rental and leasing (%)
Most Common Industries - Finance and insurance (%)
Most Common Industries - Real estate and rental and leasing (%)
Most Common Industries - Professional, scientific, and management, and administrative and waste management services (%)
Most Common Industries - Professional, scientific, and technical services (%)
Most Common Industries - Management of companies and enterprises (%)
Most Common Industries - Administrative and support and waste management services (%)
Most Common Industries - Educational services, and health care and social assistance (%)
Most Common Industries - Educational services (%)
Most Common Industries - Health care and social assistance (%)
Most Common Industries - Arts, entertainment, and recreation, and accommodation and food services (%)
Most Common Industries - Arts, entertainment, and recreation (%)
Most Common Industries - Accommodation and food services (%)
Most Common Industries - Other services, except public administration (%)
Most Common Industries - Public administration (%)
Occupation diversity
Most Common Occupations - Management, business, science, and arts occupations (%)
Most Common Occupations - Management, business, and financial occupations (%)
Most Common Occupations - Management occupations (%)
Most Common Occupations - Business and financial operations occupations (%)
Most Common Occupations - Computer, engineering, and science occupations (%)
Most Common Occupations - Computer and mathematical occupations (%)
Most Common Occupations - Architecture and engineering occupations (%)
Most Common Occupations - Life, physical, and social science occupations (%)
Most Common Occupations - Education, legal, community service, arts, and media occupations (%)
Most Common Occupations - Community and social service occupations (%)
Most Common Occupations - Legal occupations (%)
Most Common Occupations - Education, training, and library occupations (%)
Most Common Occupations - Arts, design, entertainment, sports, and media occupations (%)
Most Common Occupations - Healthcare practitioners and technical occupations (%)
Most Common Occupations - Health diagnosing and treating practitioners and other technical occupations (%)
Most Common Occupations - Health technologists and technicians (%)
Most Common Occupations - Service occupations (%)
Most Common Occupations - Healthcare support occupations (%)
Most Common Occupations - Protective service occupations (%)
Most Common Occupations - Fire fighting and prevention, and other protective service workers including supervisors (%)
Most Common Occupations - Law enforcement workers including supervisors (%)
Most Common Occupations - Food preparation and serving related occupations (%)
Most Common Occupations - Building and grounds cleaning and maintenance occupations (%)
Most Common Occupations - Personal care and service occupations (%)
Most Common Occupations - Sales and office occupations (%)
Most Common Occupations - Sales and related occupations (%)
Most Common Occupations - Office and administrative support occupations (%)
Most Common Occupations - Natural resources, construction, and maintenance occupations (%)
Most Common Occupations - Farming, fishing, and forestry occupations (%)
Most Common Occupations - Construction and extraction occupations (%)
Most Common Occupations - Installation, maintenance, and repair occupations (%)
Most Common Occupations - Production, transportation, and material moving occupations (%)
Most Common Occupations - Production occupations (%)
Most Common Occupations - Transportation occupations (%)
Most Common Occupations - Material moving occupations (%)
People in Group quarters - Institutionalized population (%)
People in Group quarters - Correctional institutions (%)
People in Group quarters - Federal prisons and detention centers (%)
People in Group quarters - Halfway houses (%)
People in Group quarters - Local jails and other confinement facilities (including police lockups) (%)
People in Group quarters - Military disciplinary barracks (%)
People in Group quarters - State prisons (%)
People in Group quarters - Other types of correctional institutions (%)
People in Group quarters - Nursing homes (%)
People in Group quarters - Hospitals/wards, hospices, and schools for the handicapped (%)
People in Group quarters - Hospitals/wards and hospices for chronically ill (%)
People in Group quarters - Hospices or homes for chronically ill (%)
People in Group quarters - Military hospitals or wards for chronically ill (%)
People in Group quarters - Other hospitals or wards for chronically ill (%)
People in Group quarters - Hospitals or wards for drug/alcohol abuse (%)
People in Group quarters - Mental (Psychiatric) hospitals or wards (%)
People in Group quarters - Schools, hospitals, or wards for the mentally retarded (%)
People in Group quarters - Schools, hospitals, or wards for the physically handicapped (%)
People in Group quarters - Institutions for the deaf (%)
People in Group quarters - Institutions for the blind (%)
People in Group quarters - Orthopedic wards and institutions for the physically handicapped (%)
People in Group quarters - Wards in general hospitals for patients who have no usual home elsewhere (%)
People in Group quarters - Wards in military hospitals for patients who have no usual home elsewhere (%)
People in Group quarters - Juvenile institutions (%)
People in Group quarters - Long-term care (%)
People in Group quarters - Homes for abused, dependent, and neglected children (%)
People in Group quarters - Residential treatment centers for emotionally disturbed children (%)
People in Group quarters - Training schools for juvenile delinquents (%)
People in Group quarters - Short-term care, detention or diagnostic centers for delinquent children (%)
People in Group quarters - Type of juvenile institution unknown (%)
People in Group quarters - Noninstitutionalized population (%)
People in Group quarters - College dormitories (includes college quarters off campus) (%)
People in Group quarters - Military quarters (%)
People in Group quarters - On base (%)
People in Group quarters - Barracks, unaccompanied personnel housing (UPH), (Enlisted/Officer), ;and similar group living quarters for military personnel (%)
People in Group quarters - Transient quarters for temporary residents (%)
People in Group quarters - Military ships (%)
People in Group quarters - Group homes (%)
People in Group quarters - Homes or halfway houses for drug/alcohol abuse (%)
People in Group quarters - Homes for the mentally ill (%)
People in Group quarters - Homes for the mentally retarded (%)
People in Group quarters - Homes for the physically handicapped (%)
People in Group quarters - Other group homes (%)
People in Group quarters - Religious group quarters (%)
People in Group quarters - Dormitories (%)
People in Group quarters - Agriculture workers' dormitories on farms (%)
People in Group quarters - Job Corps and vocational training facilities (%)
People in Group quarters - Other workers' dormitories (%)
People in Group quarters - Crews of maritime vessels (%)
People in Group quarters - Other nonhousehold living situations (%)
People in Group quarters - Other noninstitutional group quarters (%)
Residents speaking English at home (%)
Residents speaking English at home - Born in the United States (%)
Residents speaking English at home - Native, born elsewhere (%)
Residents speaking English at home - Foreign born (%)
Residents speaking Spanish at home (%)
Residents speaking Spanish at home - Born in the United States (%)
Residents speaking Spanish at home - Native, born elsewhere (%)
Residents speaking Spanish at home - Foreign born (%)
Residents speaking other language at home (%)
Residents speaking other language at home - Born in the United States (%)
Residents speaking other language at home - Native, born elsewhere (%)
Residents speaking other language at home - Foreign born (%)
Class of Workers - Employee of private company (%)
Class of Workers - Self-employed in own incorporated business (%)
Class of Workers - Private not-for-profit wage and salary workers (%)
Class of Workers - Local government workers (%)
Class of Workers - State government workers (%)
Class of Workers - Federal government workers (%)
Class of Workers - Self-employed workers in own not incorporated business and Unpaid family workers (%)
House heating fuel used in houses and condos - Utility gas (%)
House heating fuel used in houses and condos - Bottled, tank, or LP gas (%)
House heating fuel used in houses and condos - Electricity (%)
House heating fuel used in houses and condos - Fuel oil, kerosene, etc. (%)
House heating fuel used in houses and condos - Coal or coke (%)
House heating fuel used in houses and condos - Wood (%)
House heating fuel used in houses and condos - Solar energy (%)
House heating fuel used in houses and condos - Other fuel (%)
House heating fuel used in houses and condos - No fuel used (%)
House heating fuel used in apartments - Utility gas (%)
House heating fuel used in apartments - Bottled, tank, or LP gas (%)
House heating fuel used in apartments - Electricity (%)
House heating fuel used in apartments - Fuel oil, kerosene, etc. (%)
House heating fuel used in apartments - Coal or coke (%)
House heating fuel used in apartments - Wood (%)
House heating fuel used in apartments - Solar energy (%)
House heating fuel used in apartments - Other fuel (%)
House heating fuel used in apartments - No fuel used (%)
Armed forces status - In Armed Forces (%)
Armed forces status - Civilian (%)
Armed forces status - Civilian - Veteran (%)
Armed forces status - Civilian - Nonveteran (%)
Fatal accidents locations in years 2005-2021
Fatal accidents locations in 2005
Fatal accidents locations in 2006
Fatal accidents locations in 2007
Fatal accidents locations in 2008
Fatal accidents locations in 2009
Fatal accidents locations in 2010
Fatal accidents locations in 2011
Fatal accidents locations in 2012
Fatal accidents locations in 2013
Fatal accidents locations in 2014
Fatal accidents locations in 2015
Fatal accidents locations in 2016
Fatal accidents locations in 2017
Fatal accidents locations in 2018
Fatal accidents locations in 2019
Fatal accidents locations in 2020
Fatal accidents locations in 2021
Alcohol use - People drinking some alcohol every month (%)
Alcohol use - People not drinking at all (%)
Alcohol use - Average days/month drinking alcohol
Alcohol use - Average drinks/week
Alcohol use - Average days/year people drink much
Audiometry - Average condition of hearing (%)
Audiometry - People that can hear a whisper from across a quiet room (%)
Audiometry - People that can hear normal voice from across a quiet room (%)
Audiometry - Ears ringing, roaring, buzzing (%)
Audiometry - Had a job exposure to loud noise (%)
Audiometry - Had off-work exposure to loud noise (%)
Blood Pressure & Cholesterol - Has high blood pressure (%)
Blood Pressure & Cholesterol - Checking blood pressure at home (%)
Blood Pressure & Cholesterol - Frequently checking blood cholesterol (%)
Blood Pressure & Cholesterol - Has high cholesterol level (%)
Consumer Behavior - Money monthly spent on food at supermarket/grocery store
Consumer Behavior - Money monthly spent on food at other stores
Consumer Behavior - Money monthly spent on eating out
Consumer Behavior - Money monthly spent on carryout/delivered foods
Consumer Behavior - Income spent on food at supermarket/grocery store (%)
Consumer Behavior - Income spent on food at other stores (%)
Consumer Behavior - Income spent on eating out (%)
Consumer Behavior - Income spent on carryout/delivered foods (%)
Current Health Status - General health condition (%)
Current Health Status - Blood donors (%)
Current Health Status - Has blood ever tested for HIV virus (%)
Current Health Status - Left-handed people (%)
Dermatology - People using sunscreen (%)
Diabetes - Diabetics (%)
Diabetes - Had a blood test for high blood sugar (%)
Diabetes - People taking insulin (%)
Diet Behavior & Nutrition - Diet health (%)
Diet Behavior & Nutrition - Milk product consumption (# of products/month)
Diet Behavior & Nutrition - Meals not home prepared (#/week)
Diet Behavior & Nutrition - Meals from fast food or pizza place (#/week)
Diet Behavior & Nutrition - Ready-to-eat foods (#/month)
Diet Behavior & Nutrition - Frozen meals/pizza (#/month)
Drug Use - People that ever used marijuana or hashish (%)
Drug Use - Ever used hard drugs (%)
Drug Use - Ever used any form of cocaine (%)
Drug Use - Ever used heroin (%)
Drug Use - Ever used methamphetamine (%)
Health Insurance - People covered by health insurance (%)
Kidney Conditions-Urology - Avg. # of times urinating at night
Medical Conditions - People with asthma (%)
Medical Conditions - People with anemia (%)
Medical Conditions - People with psoriasis (%)
Medical Conditions - People with overweight (%)
Medical Conditions - Elderly people having difficulties in thinking or remembering (%)
Medical Conditions - People who ever received blood transfusion (%)
Medical Conditions - People having trouble seeing even with glass/contacts (%)
Medical Conditions - People with arthritis (%)
Medical Conditions - People with gout (%)
Medical Conditions - People with congestive heart failure (%)
Medical Conditions - People with coronary heart disease (%)
Medical Conditions - People with angina pectoris (%)
Medical Conditions - People who ever had heart attack (%)
Medical Conditions - People who ever had stroke (%)
Medical Conditions - People with emphysema (%)
Medical Conditions - People with thyroid problem (%)
Medical Conditions - People with chronic bronchitis (%)
Medical Conditions - People with any liver condition (%)
Medical Conditions - People who ever had cancer or malignancy (%)
Mental Health - People who have little interest in doing things (%)
Mental Health - People feeling down, depressed, or hopeless (%)
Mental Health - People who have trouble sleeping or sleeping too much (%)
Mental Health - People feeling tired or having little energy (%)
Mental Health - People with poor appetite or overeating (%)
Mental Health - People feeling bad about themself (%)
Mental Health - People who have trouble concentrating on things (%)
Mental Health - People moving or speaking slowly or too fast (%)
Mental Health - People having thoughts they would be better off dead (%)
Oral Health - Average years since last visit a dentist
Oral Health - People embarrassed because of mouth (%)
Oral Health - People with gum disease (%)
Oral Health - General health of teeth and gums (%)
Oral Health - Average days a week using dental floss/device
Oral Health - Average days a week using mouthwash for dental problem
Oral Health - Average number of teeth
Pesticide Use - Households using pesticides to control insects (%)
Pesticide Use - Households using pesticides to kill weeds (%)
Physical Activity - People doing vigorous-intensity work activities (%)
Physical Activity - People doing moderate-intensity work activities (%)
Physical Activity - People walking or bicycling (%)
Physical Activity - People doing vigorous-intensity recreational activities (%)
Physical Activity - People doing moderate-intensity recreational activities (%)
Physical Activity - Average hours a day doing sedentary activities
Physical Activity - Average hours a day watching TV or videos
Physical Activity - Average hours a day using computer
Physical Functioning - People having limitations keeping them from working (%)
Physical Functioning - People limited in amount of work they can do (%)
Physical Functioning - People that need special equipment to walk (%)
Physical Functioning - People experiencing confusion/memory problems (%)
Physical Functioning - People requiring special healthcare equipment (%)
Prescription Medications - Average number of prescription medicines taking
Preventive Aspirin Use - Adults 40+ taking low-dose aspirin (%)
Reproductive Health - Vaginal deliveries (%)
Reproductive Health - Cesarean deliveries (%)
Reproductive Health - Deliveries resulted in a live birth (%)
Reproductive Health - Pregnancies resulted in a delivery (%)
Reproductive Health - Women breastfeeding newborns (%)
Reproductive Health - Women that had a hysterectomy (%)
Reproductive Health - Women that had both ovaries removed (%)
Reproductive Health - Women that have ever taken birth control pills (%)
Reproductive Health - Women taking birth control pills (%)
Reproductive Health - Women that have ever used Depo-Provera or injectables (%)
Reproductive Health - Women that have ever used female hormones (%)
Sexual Behavior - People 18+ that ever had sex (vaginal, anal, or oral) (%)
Sexual Behavior - Males 18+ that ever had vaginal sex with a woman (%)
Sexual Behavior - Males 18+ that ever performed oral sex on a woman (%)
Sexual Behavior - Males 18+ that ever had anal sex with a woman (%)
Sexual Behavior - Males 18+ that ever had any sex with a man (%)
Sexual Behavior - Females 18+ that ever had vaginal sex with a man (%)
Sexual Behavior - Females 18+ that ever performed oral sex on a man (%)
Sexual Behavior - Females 18+ that ever had anal sex with a man (%)
Sexual Behavior - Females 18+ that ever had any kind of sex with a woman (%)
Sexual Behavior - Average age people first had sex
Sexual Behavior - Average number of female sex partners in lifetime (males 18+)
Sexual Behavior - Average number of female vaginal sex partners in lifetime (males 18+)
Sexual Behavior - Average age people first performed oral sex on a woman (18+)
Sexual Behavior - Average number of woman performed oral sex on in lifetime (18+)
Sexual Behavior - Average number of male sex partners in lifetime (males 18+)
Sexual Behavior - Average number of male anal sex partners in lifetime (males 18+)
Sexual Behavior - Average age people first performed oral sex on a man (18+)
Sexual Behavior - Average number of male oral sex partners in lifetime (18+)
Sexual Behavior - People using protection when performing oral sex (%)
Sexual Behavior - Average number of times people have vaginal or anal sex a year
Sexual Behavior - People having sex without condom (%)
Sexual Behavior - Average number of male sex partners in lifetime (females 18+)
Sexual Behavior - Average number of male vaginal sex partners in lifetime (females 18+)
Sexual Behavior - Average number of female sex partners in lifetime (females 18+)
Sexual Behavior - Circumcised males 18+ (%)
Sleep Disorders - Average hours sleeping at night
Sleep Disorders - People that has trouble sleeping (%)
Smoking-Cigarette Use - People smoking cigarettes (%)
Taste & Smell - People 40+ having problems with smell (%)
Taste & Smell - People 40+ having problems with taste (%)
Taste & Smell - People 40+ that ever had wisdom teeth removed (%)
Taste & Smell - People 40+ that ever had tonsils teeth removed (%)
Taste & Smell - People 40+ that ever had a loss of consciousness because of a head injury (%)
Taste & Smell - People 40+ that ever had a broken nose or other serious injury to face or skull (%)
Taste & Smell - People 40+ that ever had two or more sinus infections (%)
Weight - Average height (inches)
Weight - Average weight (pounds)
Weight - Average BMI
Weight - People that are obese (%)
Weight - People that ever were obese (%)
Weight - People trying to lose weight (%)
Urban population: 2,216
Rural population: 8,310
Estimated median house/condo value in 2022: $238,540
38011:
$238,540Tennessee:
$284,800
According to our research of Tennessee and other state lists, there were 18 registered sex offenders living in 38011 zip code as of May 07, 2024 . The ratio of all residents to sex offenders in zip code 38011 is 582 to 1.The ratio of registered sex offenders to all residents in this zip code is lower than the state average.
Median resident age: This zip code:
37.5 yearsTennessee median age:
39.2 years
Average household size: This zip code:
2.8 peopleTennessee:
2.4 people
Averages for the 2020 tax year for zip code 38011, filed in 2021:
Average Adjusted Gross Income (AGI) in 2020: $59,457 (Individual Income Tax Returns) Here:
$59,457State:
$69,014
Salary/wage: $54,030 (reported on 83.8% of returns )Here:
$54,030State:
$55,872
(% of AGI for various income ranges: 1092.0% for AGIs below $25k , 3632.8% for AGIs $25k-50k , 6546.0% for AGIs $50k-75k , 9592.6% for AGIs $75k-100k , 16900.0% for AGIs $100k-200k , 50797.5% for AGIs over 200k ) Taxable interest for individuals: $732 (reported on 22.9% of returns )This zip code:
$732Tennessee:
$1,945
(% of AGI for various income ranges: 9.4% for AGIs below $25k , 10.9% for AGIs $25k-50k , 15.2% for AGIs $50k-75k , 26.3% for AGIs $75k-100k , 40.3% for AGIs $100k-200k , 515.0% for AGIs over 200k ) Ordinary dividends: $2,082 (reported on 10.1% of returns )(% of AGI for various income ranges: 7.5% for AGIs below $25k , 13.3% for AGIs $25k-50k , 19.6% for AGIs $50k-75k , 52.3% for AGIs $75k-100k , 75.4% for AGIs $100k-200k , 345.0% for AGIs over 200k ) Net capital gain/loss in AGI: +$7,307 (reported on 9.6% of returns )Here:
+$7,307State:
+$33,664
(% of AGI for various income ranges: 9.3% for AGIs below $25k , 20.0% for AGIs $25k-50k , 92.4% for AGIs $50k-75k , 80.6% for AGIs $75k-100k , 270.0% for AGIs $100k-200k , 2470.0% for AGIs over 200k ) Profit/loss from business: +$11,118 (reported on 15.1% of returns )Here:
+$11,118State:
+$18,991
(% of AGI for various income ranges: 92.5% for AGIs below $25k , 55.0% for AGIs $25k-50k , 333.1% for AGIs $75k-100k , 287.9% for AGIs $100k-200k , 9367.5% for AGIs over 200k ) Taxable individual retirement arrangement distribution: $17,017 (reported on 6.6% of returns )38011:
$17,017Tennessee:
$20,036
(% of AGI for various income ranges: 39.8% for AGIs below $25k , 91.0% for AGIs $25k-50k , 155.4% for AGIs $50k-75k , 164.0% for AGIs $75k-100k , 594.1% for AGIs $100k-200k ) Total itemized deductions: $29,714 (reported on 3.2% of returns )Here:
$29,714State:
$40,136
(% of AGI for various income ranges: 84.4% for AGIs below $25k , 224.4% for AGIs $50k-75k , 357.9% for AGIs $100k-200k , 1827.5% for AGIs over 200k ) Charity contributions: $13,600 (reported on 2.7% of returns )Here:
$13,600State:
$19,852
(% of AGI for various income ranges: 9.8% for AGIs below $25k , 74.2% for AGIs $50k-75k , 296.2% for AGIs $100k-200k ) Taxes paid: $4,900 (reported on 3.2% of returns )(% of AGI for various income ranges: 9.5% for AGIs below $25k , 35.6% for AGIs $50k-75k , 67.7% for AGIs $100k-200k , 352.5% for AGIs over 200k ) Earned income credit: $2,289 (reported on 18.3% of returns )(% of AGI for various income ranges: 109.5% for AGIs below $25k , 70.4% for AGIs $25k-50k ) Percentage of individuals using paid preparers for their 2020 taxes: 94.7%(% for various income ranges: 95.0% for AGIs below $25k , 95.5% for AGIs $25k-50k , 93.9% for AGIs $50k-75k , 93.8% for AGIs $75k-100k , 93.5% for AGIs $100k-200k , 100.0% for AGIs over 200k )
Averages for the 2012 tax year for zip code 38011, filed in 2013:
Average Adjusted Gross Income (AGI) in 2012: $48,670 (Individual Income Tax Returns) Here:
$48,670State:
$53,767
Salary/wage: $45,345 (reported on 86.1% of returns )Here:
$45,345State:
$45,421
(% of AGI for various income ranges: 76.1% for AGIs below $25k , 83.5% for AGIs $25k-50k , 80.7% for AGIs $50k-75k , 84.6% for AGIs $75k-100k , 79.8% for AGIs $100k-200k , 67.1% for AGIs over 200k ) Taxable interest for individuals: $652 (reported on 24.0% of returns )This zip code:
$652Tennessee:
$1,732
(% of AGI for various income ranges: 0.7% for AGIs below $25k , 0.3% for AGIs $25k-50k , 0.4% for AGIs $50k-75k , 0.2% for AGIs $75k-100k , 0.2% for AGIs $100k-200k , 0.3% for AGIs over 200k ) Ordinary dividends: $1,434 (reported on 10.0% of returns )(% of AGI for various income ranges: 0.3% for AGIs below $25k , 0.2% for AGIs $25k-50k , 0.3% for AGIs $50k-75k , 0.3% for AGIs $75k-100k , 0.2% for AGIs $100k-200k , 0.6% for AGIs over 200k ) Net capital gain/loss in AGI: +$4,304 (reported on 6.6% of returns )Here:
+$4,304State:
+$19,082
(% of AGI for various income ranges: 0.1% for AGIs $25k-50k , 0.1% for AGIs $50k-75k , 1.0% for AGIs $100k-200k , 3.4% for AGIs over 200k ) Profit/loss from business: +$8,593 (reported on 17.1% of returns )Here:
+$8,593State:
+$15,240
(% of AGI for various income ranges: 10.0% for AGIs below $25k , 2.1% for AGIs $25k-50k , 2.3% for AGIs $50k-75k , 3.1% for AGIs $75k-100k , 2.6% for AGIs $100k-200k ) Taxable individual retirement arrangement distribution: $11,393 (reported on 6.6% of returns )38011:
$11,393Tennessee:
$15,505
(% of AGI for various income ranges: 2.3% for AGIs below $25k , 1.0% for AGIs $25k-50k , 1.9% for AGIs $50k-75k , 1.3% for AGIs $75k-100k , 2.1% for AGIs $100k-200k ) Total itemized deductions: $18,033 (21% of AGI, reported on 25.4% of returns )Here:
$18,033State:
$21,976
Here:
21.1% of AGIState:
17.8% of AGI
(% of AGI for various income ranges: 6.4% for AGIs below $25k , 8.3% for AGIs $25k-50k , 10.3% for AGIs $50k-75k , 10.0% for AGIs $75k-100k , 10.4% for AGIs $100k-200k , 9.2% for AGIs over 200k ) Charity contributions: $4,614 (reported on 20.8% of returns )(% of AGI for various income ranges: 0.9% for AGIs below $25k , 1.4% for AGIs $25k-50k , 2.0% for AGIs $50k-75k , 2.1% for AGIs $75k-100k , 2.6% for AGIs $100k-200k , 2.5% for AGIs over 200k ) Taxes paid: $3,566 (reported on 25.2% of returns )(% of AGI for various income ranges: 0.9% for AGIs below $25k , 1.4% for AGIs $25k-50k , 1.9% for AGIs $50k-75k , 2.0% for AGIs $75k-100k , 2.4% for AGIs $100k-200k , 1.9% for AGIs over 200k ) Earned income credit: $2,425 (reported on 22.2% of returns )(% of AGI for various income ranges: 9.1% for AGIs below $25k , 1.4% for AGIs $25k-50k ) Percentage of individuals using paid preparers for their 2012 taxes: 57.2%(% for various income ranges: 52.9% for AGIs below $25k , 56.3% for AGIs $25k-50k , 62.1% for AGIs $50k-75k , 65.9% for AGIs $75k-100k , 57.9% for AGIs $100k-200k , 60.0% for AGIs over 200k )
Averages for the 2004 tax year for zip code 38011, filed in 2005:
Average Adjusted Gross Income (AGI) in 2004: $41,203 (Individual Income Tax Returns) Here:
$41,203State:
$44,088
Salary/wage: $38,515 (reported on 87.6% of returns )Here:
$38,515State:
$38,825
(% of AGI for various income ranges: 97.3% for AGIs below $10k , 77.5% for AGIs $10k-25k , 84.4% for AGIs $25k-50k , 85.2% for AGIs $50k-75k , 87.7% for AGIs $75k-100k , 69.8% for AGIs over 100k ) Taxable interest for individuals: $717 (reported on 32.0% of returns )This zip code:
$717Tennessee:
$1,802
(% of AGI for various income ranges: 3.2% for AGIs below $10k , 1.4% for AGIs $10k-25k , 0.5% for AGIs $25k-50k , 0.4% for AGIs $50k-75k , 0.2% for AGIs $75k-100k , 0.5% for AGIs over 100k ) Taxable dividends: $827 (reported on 12.0% of returns )(% of AGI for various income ranges: 0.9% for AGIs below $10k , 0.3% for AGIs $10k-25k , 0.3% for AGIs $25k-50k , 0.2% for AGIs $50k-75k , 0.1% for AGIs $75k-100k , 0.2% for AGIs over 100k ) Net capital gain/loss: +$3,975 (reported on 9.4% of returns )Here:
+$3,975State:
+$15,776
(% of AGI for various income ranges: -0.6% for AGIs below $10k , 0.0% for AGIs $10k-25k , 0.3% for AGIs $25k-50k , 0.3% for AGIs $50k-75k , 1.4% for AGIs $75k-100k , 2.5% for AGIs over 100k ) Profit/loss from business: +$9,405 (reported on 16.9% of returns )Here:
+$9,405State:
+$12,882
(% of AGI for various income ranges: 16.7% for AGIs below $10k , 5.9% for AGIs $10k-25k , 3.9% for AGIs $25k-50k , 2.6% for AGIs $50k-75k , 2.3% for AGIs $75k-100k , 5.0% for AGIs over 100k ) IRA payment deduction: $2,845 (reported on 1.7% of returns )38011:
$2,845Tennessee:
$2,934
(% of AGI for various income ranges: 0.1% for AGIs $10k-25k , 0.1% for AGIs $25k-50k , 0.1% for AGIs $50k-75k , 0.1% for AGIs $75k-100k , 0.1% for AGIs over 100k ) Total itemized deductions: $15,236 (23% of AGI, reported on 31.0% of returns )Here:
$15,236State:
$18,035
Here:
22.5% of AGIState:
19.9% of AGI
(% of AGI for various income ranges: 9.4% for AGIs below $10k , 6.5% for AGIs $10k-25k , 10.5% for AGIs $25k-50k , 12.7% for AGIs $50k-75k , 12.4% for AGIs $75k-100k , 12.5% for AGIs over 100k ) Charity contributions deductions: $3,206 (5% of AGI, reported on 25.3% of returns )Here:
4.6% of AGIState:
5.3% of AGI
(% of AGI for various income ranges: 0.8% for AGIs below $10k , 0.6% for AGIs $10k-25k , 1.6% for AGIs $25k-50k , 2.0% for AGIs $50k-75k , 2.5% for AGIs $75k-100k , 2.6% for AGIs over 100k ) Total tax: $5,054 (reported on 75.1% of returns )(% of AGI for various income ranges: 3.9% for AGIs below $10k , 3.8% for AGIs $10k-25k , 6.0% for AGIs $25k-50k , 8.0% for AGIs $50k-75k , 10.2% for AGIs $75k-100k , 16.9% for AGIs over 100k ) Earned income credit: $1,826 (reported on 18.7% of returns )Percentage of individuals using paid preparers for their 2004 taxes: 62.7%(% for various income ranges: 57.2% for AGIs below $10k , 63.6% for AGIs $10k-25k , 64.5% for AGIs $25k-50k , 66.5% for AGIs $50k-75k , 60.4% for AGIs $75k-100k , 58.5% for AGIs over 100k )
Estimated median household income in 2022: This zip code:
$70,868Tennessee:
$65,254
Nearest zip codes: 38004 ,
38058 ,
38019 ,
38015 ,
38036 ,
38002 .
Gilt Edge Zip Code Map
Percentage of family households: This zip code:
57.1%Tennessee:
46.2%
Percentage of households with unmarried partners: This zip code:
4.6%Tennessee:
47.1%
Likely homosexual households (counted as self-reported same-sex unmarried-partner households)
Lesbian couples: 0.2% of all households Gay men: 0.0% of all households
Household received Food Stamps/SNAP in the past 12 months: 550Household did not receive Food Stamps/SNAP in the past 12 months: 3,254
Women who had a birth in the past 12 months: 241 (199 now married , 44 unmarried) Women who did not have a birth in the past 12 months: 2,317 (1,088 now married , 1,229 unmarried)
Housing units in zip code 38011 with a mortgage: 1,913 (150
second mortgage , 144
both second mortgage and home equity loan )
Houses without a mortgage: 14
Median monthly owner costs for units with a mortgage: $1,335
Median monthly owner costs for units without a mortgage: $417
Residents with income below the poverty level in 2022:
This zip code:
8.3%Whole state:
13.3%
Residents with income below 50% of the poverty level in 2022:
This zip code:
3.9%Whole state:
7.1%
Median number of rooms in houses and condos: Median number of rooms in apartments: Notable locations in this zip code not listed on our city pages
Click to draw/clear zip code borders Notable locations in zip code 38011: (A) , Three Star Volunteer Fire Department (B) , Brighton Fire Department (C) , Dunlap Orphanage (D) , Brighton Community Center (E) , Brighton City Hall (F) . Display/hide their locations on the map
Churches in zip code 38011 include: (A) , Shiloh Church (B) , Holly Grove Cumberland Presbyterian Church (C) , Mount Tipton Christian Methodist Episcopal Church (D) , Galilee Church (E) , Liberty Baptist Church (F) , Pleasant Hill Church (G) , Pleasant Grove Baptist Church (H) , Pisgah Church (I) . Display/hide their locations on the map
Cemeteries: (1) , Morrison Cemetery (2) , Clopton Cemetery (3) , Galilee Cemetery (4) . Display/hide their locations on the map
Reservoir: (A) . Display/hide its location on the map
Streams, rivers, and creeks: (A) , Hatchel Creek (B) , Myron Creek (C) , Smith Branch (D) . Display/hide their locations on the map
Year house built (houses)
0 2020 or later148 2010 to 20191,045 2000 to 2009666 1990 to 1999484 1980 to 1989712 1970 to 1979226 1960 to 1969242 1950 to 1959136 1940 to 1949157 1939 or earlier
Zip code 38011 household income distribution in 2022 150 Less than $10,00092 $10,000 to $14,99982 $15,000 to $19,999176 $20,000 to $24,999150 $25,000 to $29,999162 $30,000 to $34,999106 $35,000 to $39,99963 $40,000 to $44,999195 $45,000 to $49,999304 $50,000 to $59,999513 $60,000 to $74,999552 $75,000 to $99,999472 $100,000 to $124,999154 $125,000 to $149,999400 $150,000 to $199,999245 $200,000 or moreEstimate of home value of owner-occupied houses/condos in 2022 in zip code 38011 47 Less than $10,00030 $15,000 to $19,99918 $20,000 to $24,99912 $25,000 to $29,99919 $30,000 to $34,9996 $40,000 to $49,99928 $50,000 to $59,99919 $60,000 to $69,999144 $70,000 to $79,99910 $80,000 to $89,99947 $90,000 to $99,999173 $100,000 to $124,999151 $125,000 to $149,999269 $150,000 to $174,999163 $175,000 to $199,999421 $200,000 to $249,999391 $250,000 to $299,999424 $300,000 to $399,999158 $400,000 to $499,99931 $500,000 to $749,99922 $750,000 to $999,99920 $1,500,000 to $1,999,999Rent paid by renters in 2022 in zip code 38011 19 $150 to $19976 $400 to $44911 $450 to $4994 $500 to $5499 $550 to $59972 $600 to $649138 $650 to $69955 $700 to $74961 $750 to $7994 $800 to $899206 $900 to $999133 $1,000 to $1,24923 $1,250 to $1,49940 $1,500 to $1,99950 No cash rent
Median gross rent in 2022: $1,079.
Median price asked for vacant for-sale houses and condos in 2022: $296,862.
Estimated median house (or condo) value in 2022 for: White Non-Hispanic householders: $246,782Black or African American householders: $221,804Some other race householders: $237,291Two or more races householders: $281,002Hispanic or Latino householders: $231,795Estimated median house or condo value in 2022: $238,540
38011:
$238,540Tennessee:
$284,800
Lower value quartile - upper value quartile: $156,533 - $327,909
Mean price in 2022: Detached houses: $225,450Here:
$225,450State:
$374,382
Townhouses or other attached units: $155,272Here:
$155,272State:
$354,101
Mobile homes: $67,719Here:
$67,719State:
$101,421
Housing units in structures:
One, detached: 3,077One, attached: 77Two: 183 or 4: 1005 to 9: 83Mobile homes: 558Unemployment : 2.1%
Means of transportation to work in zip code 38011 76.3% 3,876 Drove a car alone10.6% 537 Carpooled0.4% 21 Other means12.4% 629 Worked at homeTravel time to work (commute) in zip code 38011 1 Less than 5 minutes257 5 to 9 minutes487 10 to 14 minutes400 15 to 19 minutes409 20 to 24 minutes369 25 to 29 minutes593 30 to 34 minutes302 35 to 39 minutes347 40 to 44 minutes920 45 to 59 minutes334 60 to 89 minutes14 90 or more minutes
Percentage of zip code residents living and working in this county: 45.8%
Household type by relationship:
Households: 10,527
Male householders: 1,965 (241 living alone ), Female householders: 1,846 (323 living alone )2,133 spouses (2,133 opposite-sex spouses ), 319 unmarried partners , (316 opposite-sex unmarried partners ), 3,238 children (2,871 natural , 85 adopted , 274 stepchildren ), 514 grandchildren , 72 brothers or sisters , 118 parents , 17 foster children , 144 other relatives , 162 non-relatives
Size of family households: 1,167 2-persons , 874 3-persons , 576 4-persons , 230 5-persons , 111 6-persons , 92 7-or-more-persons
Size of nonfamily households: 564 1-person , 175 2-persons , 21 3-persons , 4 4-persons
1,348 married couples with children. single-parent households (202 men , 391 women ).
94.4% of residents of 38011 zip code speak English at home. of residents speak Spanish at home (45% very well, 24% well, 31% not well ).of residents speak other Indo-European language at home (100% very well ).of residents speak Asian or Pacific Island language at home (100% very well ).of residents speak other language at home (100% very well ).
Foreign born population: 275 (2.6%)
(16.9%
of them are naturalized citizens )
This zip code:
2.6%Whole state:
5.6%
34% Honduras 32% Barbados 6% France 4% Germany 3% Scotland 3% El Salvador 3% Hong Kong 45% American 13% English 5% Irish 5% German 1% Scotch-Irish 1% European 1% Italian
Year of entry for the foreign-born population
48 2010 or later 103 2000 to 2009 86 1990 to 1999 98 Before 1990
Facilities with environmental interests located in this zip code:
BRIGHTON ELEMENTARY SCHOOL (1201 OLD HIGHWAY 51 in BRIGHTON, TN)
(Geographic Names Information System) (National Center for Education Statistics) - STATE ID-0007 Organizations: TIPTON COUNTY SCHOOL DISTRICT (SCHOOL DISTRICT)
BRIGHTON HIGH SCHOOL (8045 HWY 51 S in BRIGHTON, TN)
(National Center for Education Statistics) - STATE ID-0011 Organizations: TIPTON COUNTY SCHOOL DISTRICT (SCHOOL DISTRICT)
BRIGHTON MIDDLE SCHOOL (7785 HWY 51 SOUTH in BRIGHTON, TN)
(National Center for Education Statistics) - STATE ID-0012 Organizations: TIPTON COUNTY SCHOOL DISTRICT (SCHOOL DISTRICT)
ADD-VAN FARMS & CO (1463 PISGAH RD in BRIGHTON, TN)
(Integrated Compliance Information System) - ICIS-04-1997-0375, FORMAL ENFORCEMENT ACTION
Housing units lacking complete plumbing facilities: 0.8%
Housing units lacking complete kitchen facilities: 0.8%
60.7% Utility gas 35.3% Electricity 2.8% Bottled, tank, or LP gas 1.0% Wood
Population in 1990: 9,668.
Place of birth for U.S.-born residents:
This state: 7,133Northeast: 232Midwest: 547South: 1,778West: 433
57% of the 38011 zip code residents lived in the same house 5 years ago.
Out of people who lived in different houses, 47% lived in this county.
Out of people who lived in different counties, 50% lived in Tennessee.
92% of the 38011 zip code residents lived in the same house 1 year ago.
Out of people who lived in different houses, 49% moved from this county.
Out of people who lived in different houses, 27% moved from different county within same state.
Out of people who lived in different houses, 25% moved from different state.
Private vs. public school enrollment:
Students in private schools in grades 1 to 8 (elementary and middle school): 133
Here:
14.2%Tennessee:
15.0%
Students in private schools in grades 9 to 12 (high school): 13
Students in private undergraduate colleges: 3
Occupation by median earnings in the past 12 months ($)
115,286 Architecture and engineering occupations 100,650 Computer and mathematical occupations 71,769 Fire fighting and prevention, and other protective service workers including supervisors 64,966 Health diagnosing and treating practitioners and other technical occupations 59,518 Management occupations 58,731 Business and financial operations occupations
Companies with federal contracts located in this zip code:
HENSLEY MAINTENANCE (189 WOODLAWN TRCE in BRIGHTON, TN; small business) in 10 contracts from 2005 to 2006
Contracts for Maintenance, Repair or Alteration of Real Property -- Other Administrative Facilities and Service Buildings, Maintenance, Repair or Alteration of Real Property -- Other Residential Buildings, Maintenance, Repair or Alteration of Real Property -- Miscellaneous Buildings by NavySigned by year: 2000: $0; 2001: $0; 2002: $0; 2003: $0; 2004: $0; 2005: $88,897; 2006: $40,712.
Biggest contracts: with Navy for Maintenance, Repair or Alteration of Real Property -- Other Administrative Facilities and Service Buildings. Signed on 2005-09-21. Completion date: 2005-12-22.
, same as above. Signed on 2005-07-11. Completion date: 2005-08-01.
, same as above. Signed on 2006-04-11. Completion date: 2006-05-27.
, same as above. Signed on 2006-04-27. Completion date: 2006-06-27.
INDUSTRIAL PAINTING LTD INC (8359 HWY 51 SOUTH in BRIGHTON, TN; small business) in 2 contracts in 2000
$15,000 with Navy for Maintenance, Repair or Alteration of Real Property -- Religious Facilities. Signed on 2000-09-11. Completion date: 2000-11-15.
, same as above. Signed on 2000-11-28. Completion date: 2000-11-29.
Top industries in this zip code by the number of employees in 2005:
Construction: Painting and Wall Covering Contractors (50-99 employees: 1 establishment, 20-49 employees: 1 establishment, 1-4 employees: 2 establishments)Real Estate and Rental and Leasing: Lessors of Residential Buildings and Dwellings (20-49: 1)Other Services (except Public Administration): Religious Organizations (10-19: 1, 1-4: 7)Construction: Site Preparation Contractors (10-19: 1, 1-4: 2)Mining: Construction Sand and Gravel Mining (10-19: 1, 1-4: 1)Health Care and Social Assistance: Offices of Physicians (except Mental Health Specialists) (10-19: 1, 1-4: 1)
People in group quarters in 2000:
25 people in other noninstitutional group quarters
Fatal accident statistics in 2014:
Fatal accident count: 2Vehicles involved in fatal accidents: 3Fatal accidents caused by drunken drivers: 0Fatalities: 2Persons involved in fatal accidents: 4Pedestrians involved in fatal accidents: 0
Fatal accident statistics in 2013:
Fatal accident count: 2Vehicles involved in fatal accidents: 3Fatal accidents caused by drunken drivers: 0Fatalities: 3Persons involved in fatal accidents: 4Pedestrians involved in fatal accidents: 0
Home Mortgage Disclosure Act Aggregated Statistics For Year 2009(Based on 8 partial tracts) A) FHA, FSA/RHS & VA B) Conventional C) Refinancings D) Home Improvement Loans F) Non-occupant Loans on G) Loans On Manufactured Number Average Value Number Average Value Number Average Value Number Average Value Number Average Value Number Average Value
LOANS ORIGINATED 121 $151,184 73 $137,671 366 $142,344 29 $28,403 44 $96,973 18 $52,631 APPLICATIONS APPROVED, NOT ACCEPTED 2 $154,805 1 $43,140 34 $159,850 5 $13,640 0 $0 3 $62,120 APPLICATIONS DENIED 15 $91,823 16 $87,081 132 $137,998 9 $40,968 6 $90,465 19 $64,001 APPLICATIONS WITHDRAWN 8 $147,356 8 $121,104 104 $141,656 6 $38,307 2 $185,260 3 $91,933 FILES CLOSED FOR INCOMPLETENESS 2 $111,265 0 $0 27 $145,309 0 $0 0 $0 0 $0
Aggregated Statistics For Year 2008(Based on 8 partial tracts) A) FHA, FSA/RHS & VA B) Conventional C) Refinancings D) Home Improvement Loans F) Non-occupant Loans on G) Loans On Manufactured Number Average Value Number Average Value Number Average Value Number Average Value Number Average Value Number Average Value
LOANS ORIGINATED 92 $153,032 95 $135,805 308 $130,957 28 $49,112 49 $88,628 24 $64,974 APPLICATIONS APPROVED, NOT ACCEPTED 7 $136,494 10 $82,865 46 $140,476 2 $102,750 0 $0 9 $66,850 APPLICATIONS DENIED 19 $118,428 18 $93,737 214 $135,622 26 $54,165 12 $86,968 12 $72,095 APPLICATIONS WITHDRAWN 12 $141,720 15 $190,046 107 $125,870 6 $49,017 4 $97,342 3 $84,920 FILES CLOSED FOR INCOMPLETENESS 1 $81,550 0 $0 12 $176,928 2 $123,075 0 $0 0 $0
Aggregated Statistics For Year 2007(Based on 8 partial tracts) A) FHA, FSA/RHS & VA B) Conventional C) Refinancings D) Home Improvement Loans F) Non-occupant Loans on G) Loans On Manufactured Number Average Value Number Average Value Number Average Value Number Average Value Number Average Value Number Average Value
LOANS ORIGINATED 79 $145,641 278 $127,311 299 $124,113 49 $39,282 77 $118,950 28 $58,748 APPLICATIONS APPROVED, NOT ACCEPTED 1 $49,970 24 $101,330 29 $117,001 8 $25,928 1 $48,100 4 $54,505 APPLICATIONS DENIED 14 $108,694 58 $99,114 267 $126,932 53 $40,311 11 $109,310 30 $56,175 APPLICATIONS WITHDRAWN 3 $234,153 28 $157,394 110 $126,804 6 $8,822 11 $86,171 2 $7,095 FILES CLOSED FOR INCOMPLETENESS 0 $0 11 $105,439 34 $140,227 0 $0 3 $151,223 2 $80,190
Aggregated Statistics For Year 2006(Based on 8 partial tracts) A) FHA, FSA/RHS & VA B) Conventional C) Refinancings D) Home Improvement Loans F) Non-occupant Loans on G) Loans On Manufactured Number Average Value Number Average Value Number Average Value Number Average Value Number Average Value Number Average Value
LOANS ORIGINATED 81 $132,835 374 $105,471 353 $116,135 56 $50,792 80 $75,500 34 $67,219 APPLICATIONS APPROVED, NOT ACCEPTED 2 $107,360 51 $120,944 58 $98,629 12 $37,125 7 $74,057 5 $66,060 APPLICATIONS DENIED 13 $114,433 66 $102,096 305 $114,360 71 $45,363 22 $92,560 28 $57,248 APPLICATIONS WITHDRAWN 12 $129,607 41 $100,294 184 $118,489 11 $57,503 3 $59,157 3 $93,553 FILES CLOSED FOR INCOMPLETENESS 2 $110,660 16 $138,896 70 $114,047 4 $84,062 3 $45,247 0 $0
Aggregated Statistics For Year 2005(Based on 8 partial tracts) A) FHA, FSA/RHS & VA B) Conventional C) Refinancings D) Home Improvement Loans F) Non-occupant Loans on G) Loans On Manufactured Number Average Value Number Average Value Number Average Value Number Average Value Number Average Value Number Average Value
LOANS ORIGINATED 86 $125,940 391 $96,374 452 $107,321 59 $47,045 92 $84,938 29 $52,580 APPLICATIONS APPROVED, NOT ACCEPTED 5 $50,360 50 $84,982 73 $122,335 14 $18,934 3 $101,193 17 $67,154 APPLICATIONS DENIED 13 $132,385 76 $73,190 402 $114,396 75 $29,232 8 $101,164 49 $63,046 APPLICATIONS WITHDRAWN 5 $161,732 61 $121,005 230 $114,304 22 $118,579 5 $92,276 1 $121,670 FILES CLOSED FOR INCOMPLETENESS 3 $153,430 16 $77,311 41 $115,880 2 $47,420 4 $63,055 0 $0
Aggregated Statistics For Year 2004(Based on 8 partial tracts) A) FHA, FSA/RHS & VA B) Conventional C) Refinancings D) Home Improvement Loans F) Non-occupant Loans on G) Loans On Manufactured Number Average Value Number Average Value Number Average Value Number Average Value Number Average Value Number Average Value
LOANS ORIGINATED 103 $114,506 316 $98,703 470 $99,358 44 $48,906 65 $85,578 36 $57,107 APPLICATIONS APPROVED, NOT ACCEPTED 9 $81,863 29 $79,520 100 $98,946 0 $0 4 $57,530 20 $60,257 APPLICATIONS DENIED 12 $124,604 81 $87,374 355 $101,840 60 $30,503 12 $49,596 57 $61,269 APPLICATIONS WITHDRAWN 5 $97,106 30 $91,138 208 $111,661 14 $59,971 4 $66,708 9 $93,013 FILES CLOSED FOR INCOMPLETENESS 4 $82,578 10 $116,840 28 $98,648 2 $77,080 2 $74,280 0 $0
Aggregated Statistics For Year 2003(Based on 8 partial tracts) A) FHA, FSA/RHS & VA B) Conventional C) Refinancings D) Home Improvement Loans F) Non-occupant Loans on Number Average Value Number Average Value Number Average Value Number Average Value Number Average Value
LOANS ORIGINATED 135 $113,320 234 $105,008 727 $103,311 38 $19,997 54 $75,531 APPLICATIONS APPROVED, NOT ACCEPTED 5 $101,510 25 $93,416 117 $108,642 10 $17,133 6 $81,262 APPLICATIONS DENIED 10 $115,877 62 $83,670 344 $100,313 35 $40,629 11 $67,316 APPLICATIONS WITHDRAWN 4 $120,230 37 $80,842 194 $111,089 6 $111,805 3 $80,303 FILES CLOSED FOR INCOMPLETENESS 2 $62,775 10 $116,295 42 $120,941 4 $33,650 1 $35,160
Aggregated Statistics For Year 2002(Based on 4 partial tracts) A) FHA, FSA/RHS & VA B) Conventional C) Refinancings D) Home Improvement Loans F) Non-occupant Loans on Number Average Value Number Average Value Number Average Value Number Average Value Number Average Value
LOANS ORIGINATED 78 $109,494 109 $95,507 279 $93,449 19 $34,722 22 $107,554 APPLICATIONS APPROVED, NOT ACCEPTED 0 $0 19 $85,458 46 $72,307 2 $24,055 0 $0 APPLICATIONS DENIED 8 $123,842 26 $65,543 161 $83,348 6 $32,908 0 $0 APPLICATIONS WITHDRAWN 5 $86,284 11 $127,693 86 $83,982 2 $16,895 2 $72,975 FILES CLOSED FOR INCOMPLETENESS 3 $96,763 9 $50,642 30 $96,459 0 $0 0 $0
Aggregated Statistics For Year 2001(Based on 4 partial tracts) A) FHA, FSA/RHS & VA B) Conventional C) Refinancings D) Home Improvement Loans F) Non-occupant Loans on Number Average Value Number Average Value Number Average Value Number Average Value Number Average Value
LOANS ORIGINATED 93 $105,780 94 $92,869 236 $89,327 46 $22,823 36 $50,581 APPLICATIONS APPROVED, NOT ACCEPTED 8 $93,822 18 $65,323 38 $84,069 2 $10,915 2 $78,585 APPLICATIONS DENIED 7 $103,854 35 $64,110 152 $69,557 22 $17,763 9 $52,713 APPLICATIONS WITHDRAWN 3 $152,690 10 $61,827 68 $68,656 6 $33,412 2 $9,625 FILES CLOSED FOR INCOMPLETENESS 2 $132,315 5 $58,378 16 $73,326 0 $0 3 $80,190
Aggregated Statistics For Year 2000(Based on 4 partial tracts) A) FHA, FSA/RHS & VA B) Conventional C) Refinancings D) Home Improvement Loans F) Non-occupant Loans on Number Average Value Number Average Value Number Average Value Number Average Value Number Average Value
LOANS ORIGINATED 85 $101,414 95 $88,899 101 $81,290 25 $13,321 20 $52,572 APPLICATIONS APPROVED, NOT ACCEPTED 3 $117,047 12 $61,788 18 $68,476 4 $23,882 0 $0 APPLICATIONS DENIED 8 $81,794 78 $68,018 149 $61,227 43 $18,717 6 $59,608 APPLICATIONS WITHDRAWN 10 $95,426 4 $69,565 41 $65,505 3 $66,907 2 $8,020 FILES CLOSED FOR INCOMPLETENESS 2 $88,210 3 $123,590 8 $75,792 0 $0 0 $0
Aggregated Statistics For Year 1999(Based on 4 partial tracts) A) FHA, FSA/RHS & VA B) Conventional C) Refinancings D) Home Improvement Loans F) Non-occupant Loans on Number Average Value Number Average Value Number Average Value Number Average Value Number Average Value
LOANS ORIGINATED 79 $104,014 91 $139,597 142 $83,817 28 $20,238 8 $55,821 APPLICATIONS APPROVED, NOT ACCEPTED 3 $90,653 13 $57,239 41 $70,204 11 $17,602 0 $0 APPLICATIONS DENIED 6 $97,720 31 $60,939 93 $66,070 23 $21,053 2 $65,675 APPLICATIONS WITHDRAWN 9 $98,121 8 $91,335 57 $74,988 7 $47,214 1 $39,980 FILES CLOSED FOR INCOMPLETENESS 2 $139,125 6 $70,220 17 $89,909 0 $0 1 $40,830
Detailed HMDA statistics for the following Tracts:
0402.00
,
0403.01 ,
0405.00 ,
0408.00
Private Mortgage Insurance Companies Aggregated Statistics For Year 2009(Based on 8 partial tracts) A) Conventional B) Refinancings Number Average Value Number Average Value
LOANS ORIGINATED 8 $205,876 8 $142,734 APPLICATIONS APPROVED, NOT ACCEPTED 3 $170,720 12 $178,622 APPLICATIONS DENIED 2 $220,045 0 $0 APPLICATIONS WITHDRAWN 0 $0 2 $119,620 FILES CLOSED FOR INCOMPLETENESS 0 $0 0 $0
Aggregated Statistics For Year 2008(Based on 8 partial tracts) A) Conventional B) Refinancings C) Non-occupant Loans on D) Loans On Manufactured Number Average Value Number Average Value Number Average Value Number Average Value
LOANS ORIGINATED 31 $161,085 35 $177,243 2 $65,755 2 $99,435 APPLICATIONS APPROVED, NOT ACCEPTED 9 $137,518 8 $167,176 1 $94,060 0 $0 APPLICATIONS DENIED 3 $179,310 2 $164,120 0 $0 0 $0 APPLICATIONS WITHDRAWN 3 $114,770 0 $0 0 $0 0 $0 FILES CLOSED FOR INCOMPLETENESS 2 $106,150 0 $0 0 $0 0 $0
Aggregated Statistics For Year 2007(Based on 8 partial tracts) A) Conventional B) Refinancings C) Non-occupant Loans on D) Loans On Manufactured Number Average Value Number Average Value Number Average Value Number Average Value
LOANS ORIGINATED 96 $141,158 47 $146,238 3 $121,373 3 $60,410 APPLICATIONS APPROVED, NOT ACCEPTED 8 $181,948 21 $191,691 2 $119,485 0 $0 APPLICATIONS DENIED 3 $104,413 2 $44,905 1 $128,150 2 $44,905 APPLICATIONS WITHDRAWN 0 $0 5 $233,220 0 $0 0 $0 FILES CLOSED FOR INCOMPLETENESS 0 $0 0 $0 0 $0 0 $0
Aggregated Statistics For Year 2006(Based on 8 partial tracts) A) Conventional B) Refinancings C) Non-occupant Loans on Number Average Value Number Average Value Number Average Value
LOANS ORIGINATED 57 $138,205 41 $171,898 4 $112,372 APPLICATIONS APPROVED, NOT ACCEPTED 5 $142,392 10 $117,654 0 $0 APPLICATIONS DENIED 0 $0 2 $97,830 0 $0 APPLICATIONS WITHDRAWN 0 $0 4 $108,340 0 $0 FILES CLOSED FOR INCOMPLETENESS 0 $0 0 $0 0 $0
Aggregated Statistics For Year 2005(Based on 8 partial tracts) A) Conventional B) Refinancings C) Non-occupant Loans on Number Average Value Number Average Value Number Average Value
LOANS ORIGINATED 65 $137,555 40 $139,377 6 $81,980 APPLICATIONS APPROVED, NOT ACCEPTED 5 $156,098 10 $173,679 2 $103,795 APPLICATIONS DENIED 0 $0 3 $175,030 3 $175,030 APPLICATIONS WITHDRAWN 0 $0 3 $107,570 0 $0 FILES CLOSED FOR INCOMPLETENESS 0 $0 0 $0 0 $0
Aggregated Statistics For Year 2004(Based on 8 partial tracts) A) Conventional B) Refinancings C) Non-occupant Loans on D) Loans On Manufactured Number Average Value Number Average Value Number Average Value Number Average Value
LOANS ORIGINATED 76 $118,604 57 $121,861 3 $64,807 0 $0 APPLICATIONS APPROVED, NOT ACCEPTED 6 $114,785 15 $126,495 0 $0 2 $50,520 APPLICATIONS DENIED 2 $161,610 0 $0 0 $0 0 $0 APPLICATIONS WITHDRAWN 7 $130,507 3 $137,107 0 $0 0 $0 FILES CLOSED FOR INCOMPLETENESS 0 $0 0 $0 0 $0 0 $0
Aggregated Statistics For Year 2003(Based on 8 partial tracts) A) Conventional B) Refinancings C) Non-occupant Loans on Number Average Value Number Average Value Number Average Value
LOANS ORIGINATED 72 $118,738 116 $132,376 7 $106,617 APPLICATIONS APPROVED, NOT ACCEPTED 13 $98,715 29 $115,750 1 $39,880 APPLICATIONS DENIED 1 $93,150 1 $111,710 0 $0 APPLICATIONS WITHDRAWN 6 $108,792 4 $233,798 0 $0 FILES CLOSED FOR INCOMPLETENESS 0 $0 2 $142,740 0 $0
Aggregated Statistics For Year 2002(Based on 4 partial tracts) A) Conventional B) Refinancings C) Non-occupant Loans on Number Average Value Number Average Value Number Average Value
LOANS ORIGINATED 24 $117,981 58 $104,315 2 $37,690 APPLICATIONS APPROVED, NOT ACCEPTED 5 $87,032 7 $183,879 2 $48,915 APPLICATIONS DENIED 0 $0 0 $0 0 $0 APPLICATIONS WITHDRAWN 2 $39,295 6 $106,920 2 $39,295 FILES CLOSED FOR INCOMPLETENESS 0 $0 0 $0 0 $0
Aggregated Statistics For Year 2001(Based on 4 partial tracts) A) Conventional B) Refinancings C) Non-occupant Loans on Number Average Value Number Average Value Number Average Value
LOANS ORIGINATED 24 $95,003 24 $113,196 2 $27,265 APPLICATIONS APPROVED, NOT ACCEPTED 2 $132,315 3 $232,787 0 $0 APPLICATIONS DENIED 0 $0 0 $0 0 $0 APPLICATIONS WITHDRAWN 0 $0 0 $0 0 $0 FILES CLOSED FOR INCOMPLETENESS 0 $0 0 $0 0 $0
Aggregated Statistics For Year 2000(Based on 4 partial tracts) A) Conventional B) Refinancings Number Average Value Number Average Value
LOANS ORIGINATED 21 $104,705 8 $115,352 APPLICATIONS APPROVED, NOT ACCEPTED 8 $120,485 3 $119,750 APPLICATIONS DENIED 0 $0 0 $0 APPLICATIONS WITHDRAWN 0 $0 0 $0 FILES CLOSED FOR INCOMPLETENESS 0 $0 0 $0
Aggregated Statistics For Year 1999(Based on 4 partial tracts) A) Conventional B) Refinancings C) Non-occupant Loans on Number Average Value Number Average Value Number Average Value
LOANS ORIGINATED 16 $131,842 9 $130,182 0 $0 APPLICATIONS APPROVED, NOT ACCEPTED 2 $102,480 3 $112,003 0 $0 APPLICATIONS DENIED 1 $104,160 2 $61,245 1 $58,440 APPLICATIONS WITHDRAWN 0 $0 0 $0 0 $0 FILES CLOSED FOR INCOMPLETENESS 0 $0 0 $0 0 $0
Detailed PMIC statistics for the following Tracts:
0402.00
,
0403.01 ,
0405.00 ,
0408.00
2002 - 2018 National Fire Incident Reporting System (NFIRS) incidents See full 2006 National Fire Incident Reporting System statistics for zip code 38011, Tennessee
Most common first names in zip code 38011 among deceased individuals Name Count Lived (average)
James 53 73.5 years William 46 73.1 years John 41 70.7 years Mary 36 80.6 years Robert 35 70.5 years Willie 25 71.3 years George 19 71.0 years Charles 19 73.5 years Annie 18 79.2 years Thomas 17 73.8 years
Most common last names in zip code 38011 among deceased individuals Last name Count Lived (average)
Smith 52 77.7 years Wilson 16 72.9 years Taylor 13 71.8 years Jones 13 69.8 years Johnson 12 67.1 years Gray 12 74.8 years Fayne 11 79.8 years Wright 11 77.3 years Anderson 10 63.9 years Hall 10 63.4 years
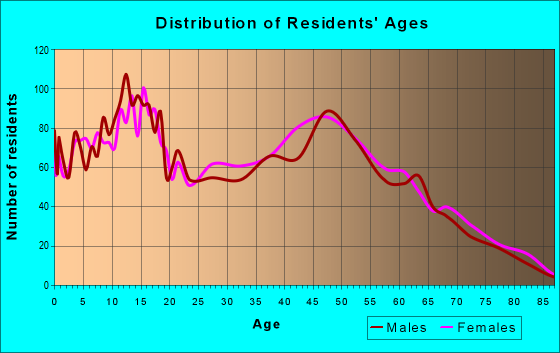
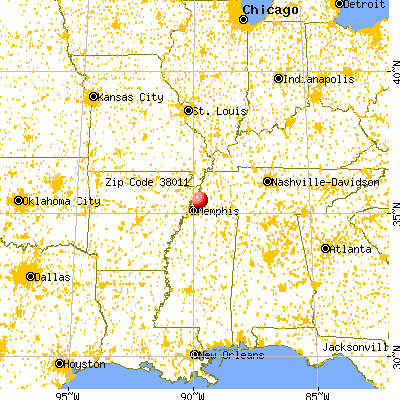


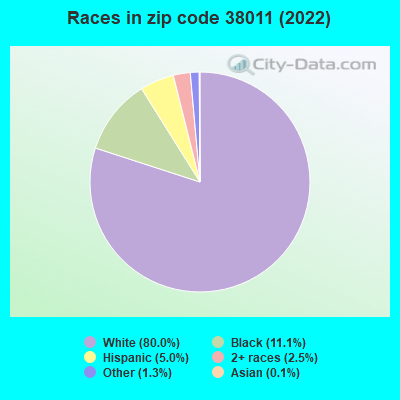


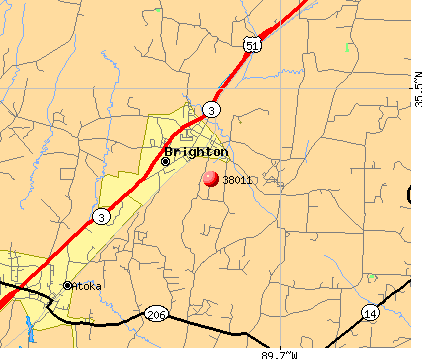 Nearest zip codes: 38004, 38058, 38019, 38015, 38036, 38002.
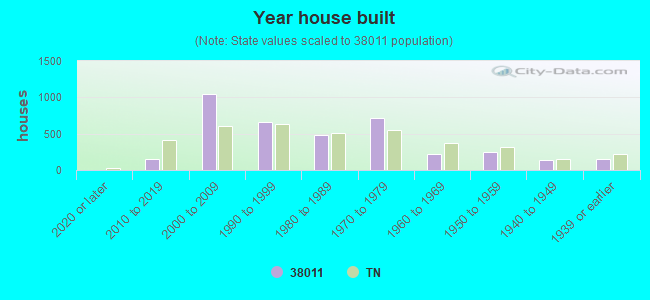
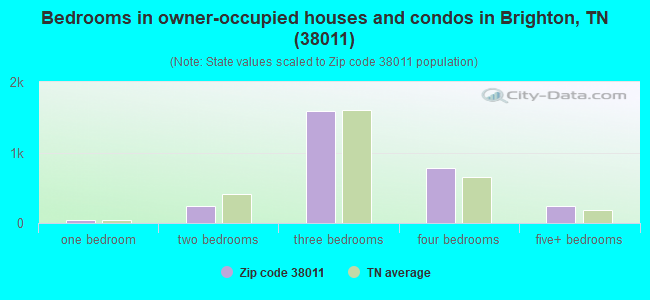
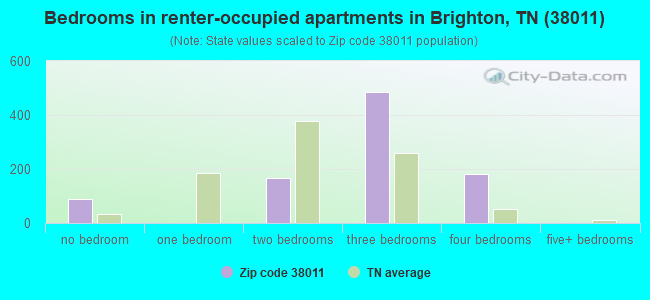
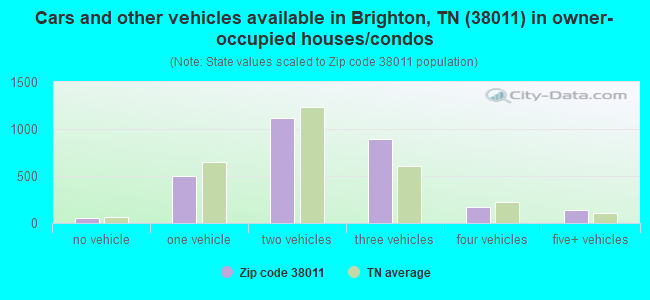
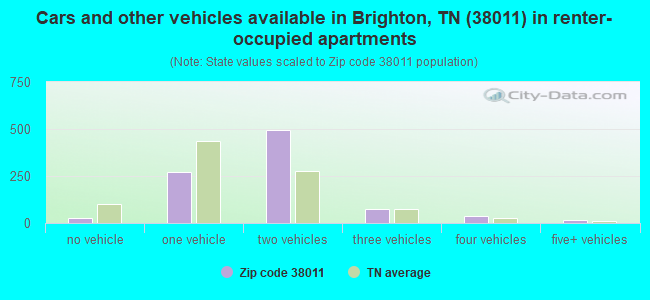


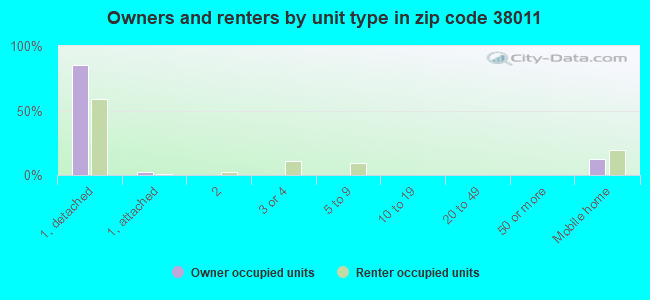
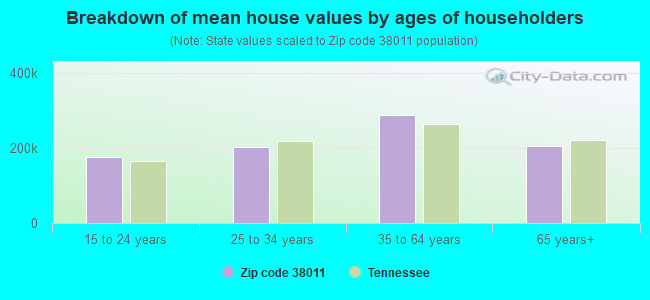


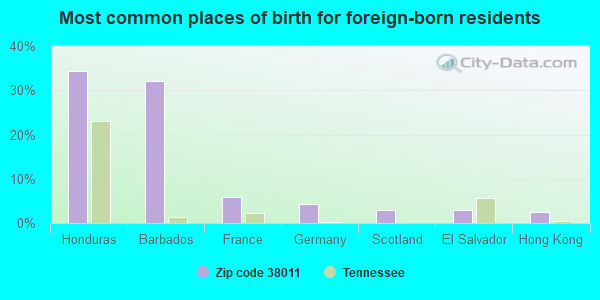
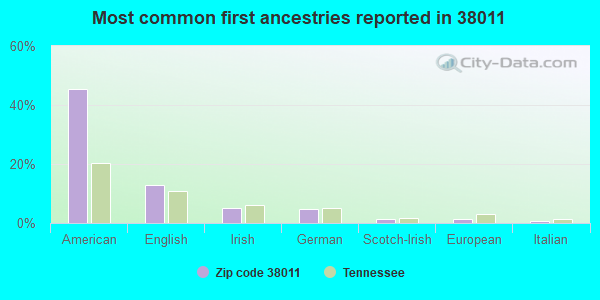
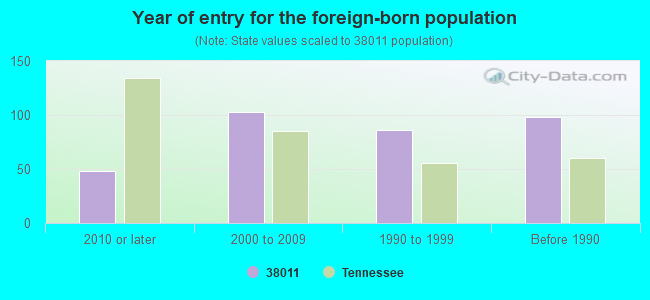
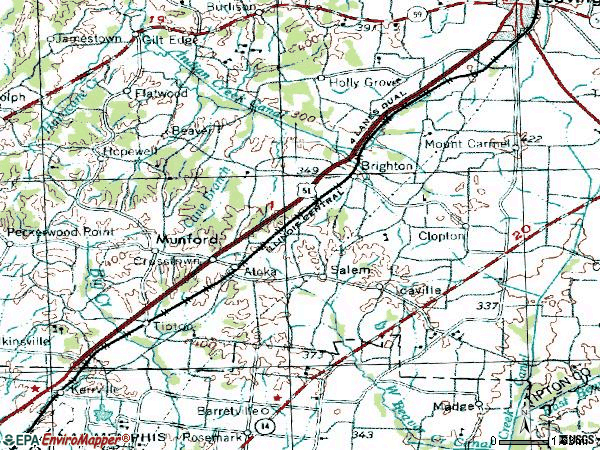

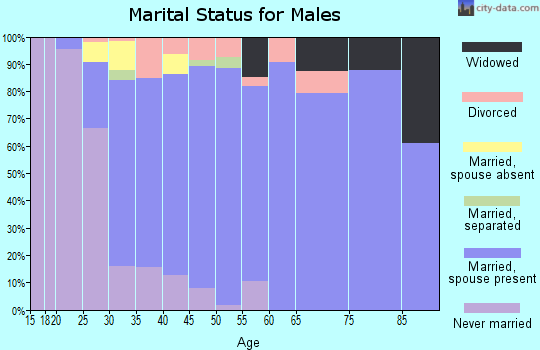
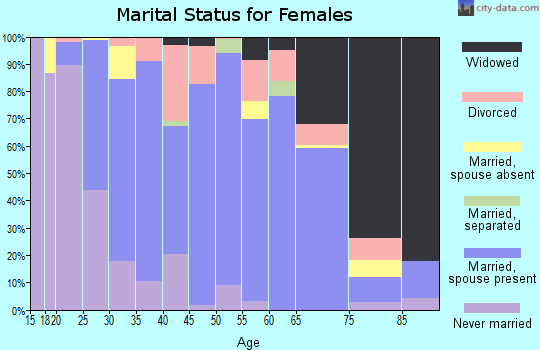
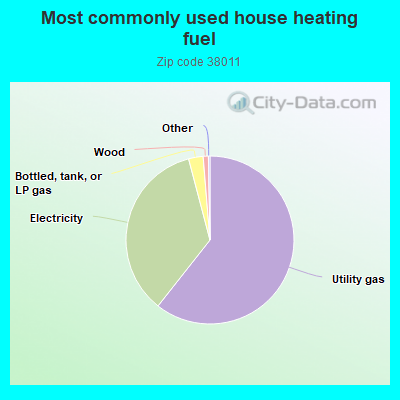
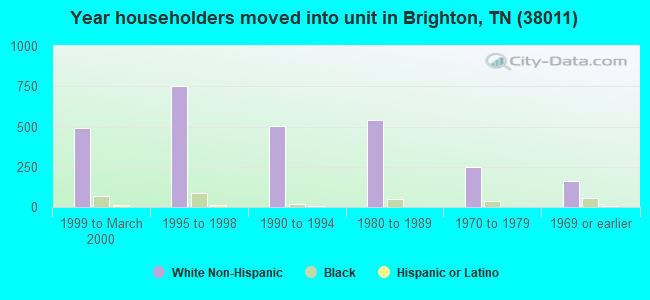
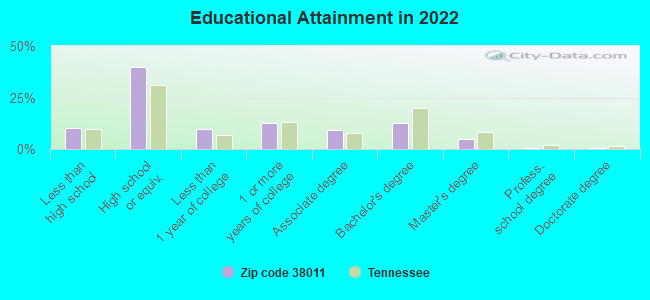
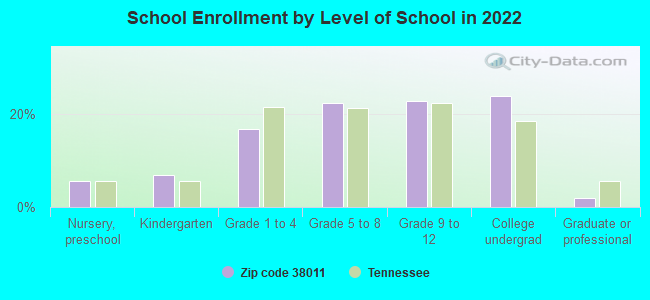
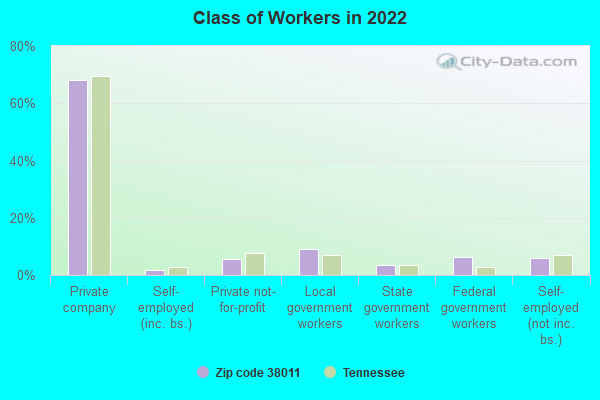
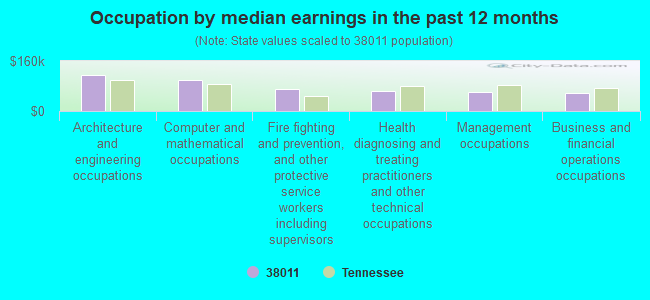
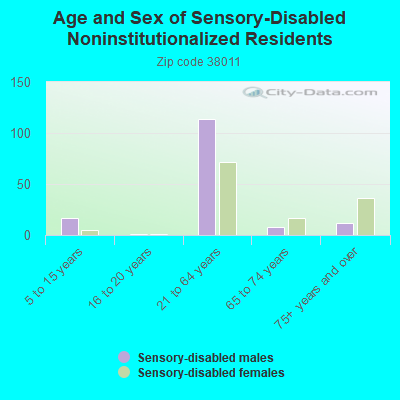
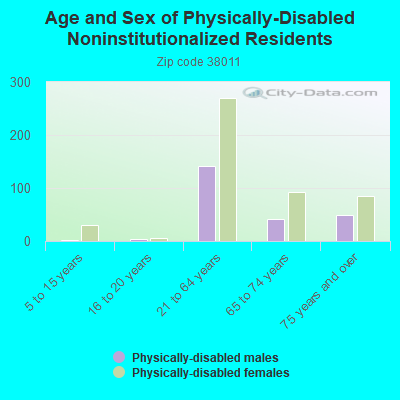
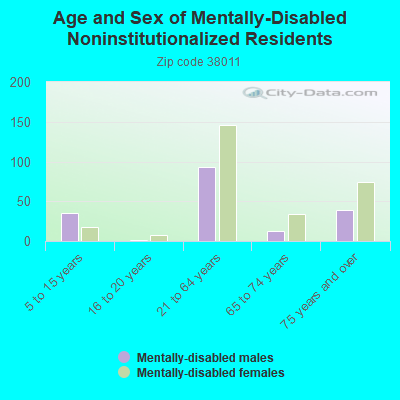
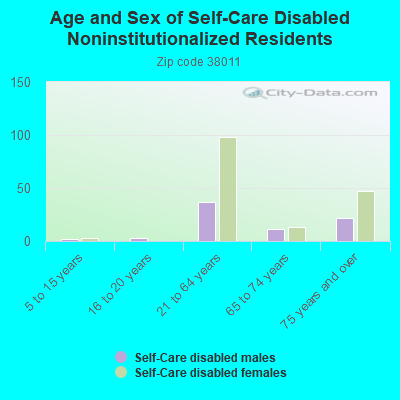
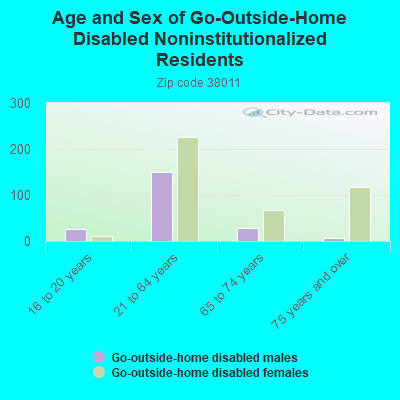
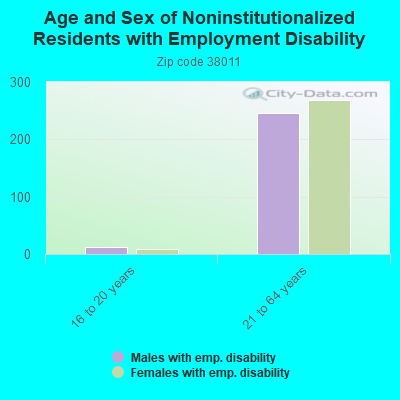
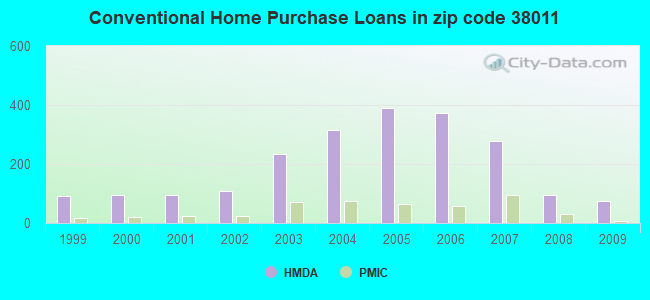
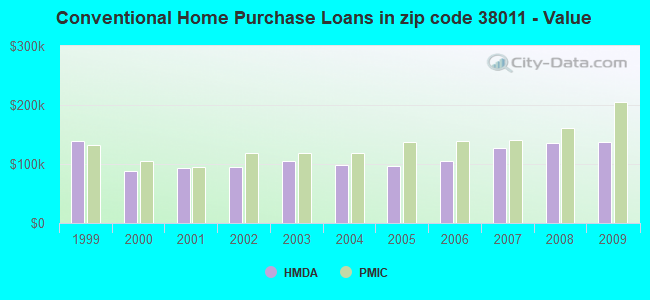
 Based on the data from the years 2002 - 2018 the average number of fire incidents per year is 67. The highest number of reported fire incidents - 115 took place in 2006, and the least - 17 in 2003. The data has a decreasing trend.
 When looking into fire subcategories, the most reports belonged to: Outside Fires (50.0%), and Structure Fires (37.4%).