Estimated zip code population in 2022: 23,839 Zip code population in 2010: 23,409 Zip code population in 2000: 24,727
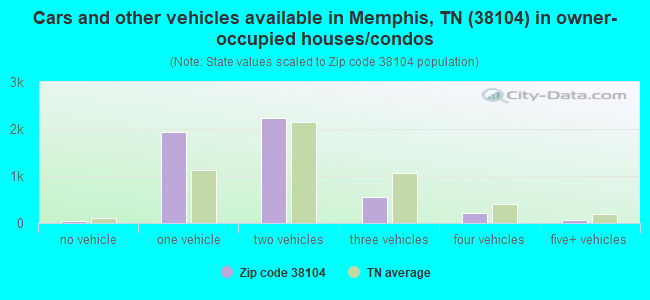
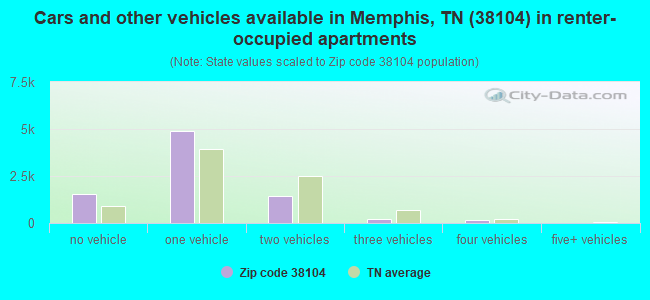
Houses and condos: 14,864 Renter-occupied apartments: 8,323
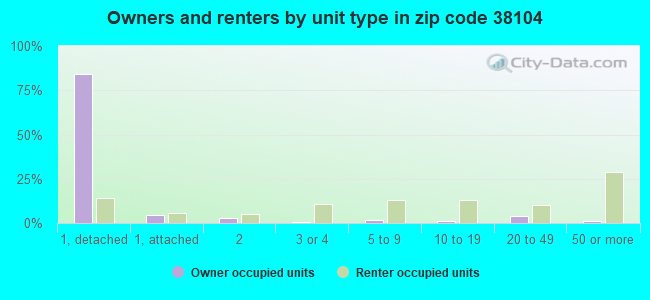
% of renters here:
62%
State:
33%
March 2022 cost of living index in zip code 38104: 88.5 (less than average, U.S. average is 100)
Land area: 5.1 sq. mi. Water area: 0.0 sq. mi.
Population density: 4,676 people per square mile
(average).
OSM Map
General Map
Google Map
MSN Map
OSM Map
General Map
Google Map
MSN Map
OSM Map
General Map
Google Map
MSN Map
OSM Map
General Map
Google Map
MSN Map
Please wait while loading the map...
Real estate property taxes paid for housing units in 2022:
This zip code:
1.0% ($3,377)
Tennessee:
0.5% ($1,376)
Median real estate property taxes paid for housing units with mortgages in 2022: $3,497 (1.0%) Median real estate property taxes paid for housing units with no mortgage in 2022: $3,065 (0.9%)
Estimated median house/condo value in 2022: $354,497
38104:
$354,497
Tennessee:
$284,800
According to our research of Tennessee and other state lists, there were 53 registered sex offenders living in 38104 zip code as of April 26, 2024. The ratio of all residents to sex offenders in zip code 38104 is 459 to 1. The ratio of registered sex offenders to all residents in this zip code is lower than the state average.
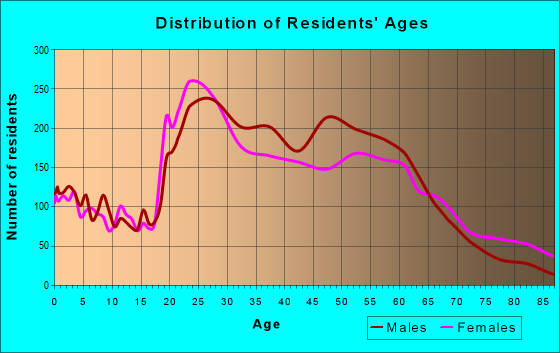
Median resident age:
This zip code:
37.4 years
Tennessee median age:
39.2 years
Average household size:
This zip code:
1.7 people
Tennessee:
2.4 people
Averages for the 2020 tax year for zip code 38104, filed in 2021:
Average Adjusted Gross Income (AGI) in 2020: $81,275 (Individual Income Tax Returns)
Here:
$81,275
State:
$69,014
Salary/wage: $70,192 (reported on 84.9% of returns)
Here:
$70,192
State:
$55,872
(% of AGI for various income ranges: 1269.7% for AGIs below $25k, 3945.6% for AGIs $25k-50k, 7333.9% for AGIs $50k-75k, 10348.1% for AGIs $75k-100k, 19829.6% for AGIs $100k-200k, 84651.4% for AGIs over 200k)
Taxable interest for individuals: $1,709 (reported on 25.6% of returns)
This zip code:
$1,709
Tennessee:
$1,945
(% of AGI for various income ranges: 5.4% for AGIs below $25k, 15.6% for AGIs $25k-50k, 23.6% for AGIs $50k-75k, 45.1% for AGIs $75k-100k, 136.3% for AGIs $100k-200k, 966.4% for AGIs over 200k)
Ordinary dividends: $8,407 (reported on 20.8% of returns)
Here:
$8,407
State:
$8,105
(% of AGI for various income ranges: 22.1% for AGIs below $25k, 33.9% for AGIs $25k-50k, 81.3% for AGIs $50k-75k, 169.6% for AGIs $75k-100k, 587.5% for AGIs $100k-200k, 4055.0% for AGIs over 200k)
Net capital gain/loss in AGI: +$19,907 (reported on 20.0% of returns)
Here:
+$19,907
State:
+$33,664
(% of AGI for various income ranges: 17.0% for AGIs below $25k, 24.4% for AGIs $25k-50k, 75.0% for AGIs $50k-75k, 261.5% for AGIs $75k-100k, 647.5% for AGIs $100k-200k, 12390.4% for AGIs over 200k)
Profit/loss from business: +$16,749 (reported on 21.6% of returns)
Here:
+$16,749
State:
+$18,991
(% of AGI for various income ranges: 137.3% for AGIs below $25k, 77.9% for AGIs $25k-50k, 267.5% for AGIs $50k-75k, 465.8% for AGIs $75k-100k, 1188.4% for AGIs $100k-200k, 6935.0% for AGIs over 200k)
Taxable individual retirement arrangement distribution: $20,257 (reported on 5.6% of returns)
38104:
$20,257
Tennessee:
$20,036
(% of AGI for various income ranges: 28.8% for AGIs below $25k, 43.6% for AGIs $25k-50k, 115.4% for AGIs $50k-75k, 236.4% for AGIs $75k-100k, 564.2% for AGIs $100k-200k, 1362.5% for AGIs over 200k)
Self-employed (Keogh) retirement plans: $27,657 (reported on 1.3% of returns)
38104:
$27,657
Tennessee:
$28,955
(% of AGI for various income ranges: 93.6% for AGIs $100k-200k, 1138.9% for AGIs over 200k)
Total itemized deductions: $34,924 (reported on 8.9% of returns)
Here:
$34,924
State:
$40,136
(% of AGI for various income ranges: 32.8% for AGIs below $25k, 104.5% for AGIs $25k-50k, 202.9% for AGIs $50k-75k, 438.7% for AGIs $75k-100k, 996.0% for AGIs $100k-200k, 6496.8% for AGIs over 200k)
Charity contributions: $14,000 (reported on 7.8% of returns)
Here:
$14,000
State:
$19,852
(% of AGI for various income ranges: 3.3% for AGIs below $25k, 27.0% for AGIs $25k-50k, 43.2% for AGIs $50k-75k, 125.5% for AGIs $75k-100k, 251.9% for AGIs $100k-200k, 2840.7% for AGIs over 200k)
Taxes paid: $7,359 (reported on 8.7% of returns)
38104:
$7,359
State:
$6,038
(% of AGI for various income ranges: 5.8% for AGIs below $25k, 16.0% for AGIs $25k-50k, 48.4% for AGIs $50k-75k, 107.2% for AGIs $75k-100k, 239.7% for AGIs $100k-200k, 1247.5% for AGIs over 200k)
Earned income credit: $1,872 (reported on 14.4% of returns)
Here:
$1,872
State:
$2,391
(% of AGI for various income ranges: 87.7% for AGIs below $25k, 29.9% for AGIs $25k-50k)
Percentage of individuals using paid preparers for their 2020 taxes: 92.4%
Here:
92%
State:
93%
(% for various income ranges: 91.2% for AGIs below $25k, 93.0% for AGIs $25k-50k, 92.3% for AGIs $50k-75k, 92.2% for AGIs $75k-100k, 93.4% for AGIs $100k-200k, 94.9% for AGIs over 200k)
Averages for the 2012 tax year for zip code 38104, filed in 2013:
Average Adjusted Gross Income (AGI) in 2012: $61,700 (Individual Income Tax Returns)
Here:
$61,700
State:
$53,767
Salary/wage: $52,379 (reported on 86.6% of returns)
Here:
$52,379
State:
$45,421
(% of AGI for various income ranges: 82.1% for AGIs below $25k, 88.9% for AGIs $25k-50k, 84.7% for AGIs $50k-75k, 76.8% for AGIs $75k-100k, 76.5% for AGIs $100k-200k, 59.3% for AGIs over 200k)
Taxable interest for individuals: $1,632 (reported on 24.0% of returns)
This zip code:
$1,632
Tennessee:
$1,732
(% of AGI for various income ranges: 0.6% for AGIs below $25k, 0.4% for AGIs $25k-50k, 0.5% for AGIs $50k-75k, 0.7% for AGIs $75k-100k, 0.6% for AGIs $100k-200k, 0.8% for AGIs over 200k)
Ordinary dividends: $8,030 (reported on 17.2% of returns)
Here:
$8,030
State:
$6,739
(% of AGI for various income ranges: 1.3% for AGIs below $25k, 1.0% for AGIs $25k-50k, 1.0% for AGIs $50k-75k, 1.9% for AGIs $75k-100k, 1.9% for AGIs $100k-200k, 3.6% for AGIs over 200k)
Net capital gain/loss in AGI: +$29,575 (reported on 14.2% of returns)
Here:
+$29,575
State:
+$19,082
(% of AGI for various income ranges: 0.2% for AGIs $25k-50k, 0.4% for AGIs $50k-75k, 2.4% for AGIs $75k-100k, 2.1% for AGIs $100k-200k, 16.5% for AGIs over 200k)
Profit/loss from business: +$16,673 (reported on 19.8% of returns)
Here:
+$16,673
State:
+$15,240
(% of AGI for various income ranges: 8.2% for AGIs below $25k, 2.6% for AGIs $25k-50k, 4.3% for AGIs $50k-75k, 5.0% for AGIs $75k-100k, 5.8% for AGIs $100k-200k, 5.9% for AGIs over 200k)
Taxable individual retirement arrangement distribution: $18,189 (reported on 5.8% of returns)
38104:
$18,189
Tennessee:
$15,505
(% of AGI for various income ranges: 1.3% for AGIs below $25k, 1.2% for AGIs $25k-50k, 1.8% for AGIs $50k-75k, 2.9% for AGIs $75k-100k, 2.2% for AGIs $100k-200k, 1.5% for AGIs over 200k)
Self-employment retirement plans: $22,146 (reported on 1.2% of returns)
38104:
$22,146
Tennessee:
$22,567
(% of AGI for various income ranges: 0.4% for AGIs $50k-75k, 0.7% for AGIs $100k-200k, 0.7% for AGIs over 200k)
Total itemized deductions: $23,225 (16% of AGI, reported on 27.2% of returns)
Here:
$23,225
State:
$21,976
Here:
16.0% of AGI
State:
17.8% of AGI
(% of AGI for various income ranges: 7.1% for AGIs below $25k, 7.9% for AGIs $25k-50k, 11.9% for AGIs $50k-75k, 11.8% for AGIs $75k-100k, 13.1% for AGIs $100k-200k, 9.7% for AGIs over 200k)
Charity contributions: $6,534 (reported on 23.1% of returns)
Here:
$6,534
State:
$6,709
(% of AGI for various income ranges: 0.7% for AGIs below $25k, 1.3% for AGIs $25k-50k, 1.8% for AGIs $50k-75k, 1.9% for AGIs $75k-100k, 2.8% for AGIs $100k-200k, 3.5% for AGIs over 200k)
Taxes paid: $6,616 (reported on 26.5% of returns)
38104:
$6,616
State:
$4,829
(% of AGI for various income ranges: 1.5% for AGIs below $25k, 1.8% for AGIs $25k-50k, 3.2% for AGIs $50k-75k, 3.7% for AGIs $75k-100k, 4.2% for AGIs $100k-200k, 2.6% for AGIs over 200k)
Earned income credit: $2,119 (reported on 19.9% of returns)
Here:
$2,119
State:
$2,404
(% of AGI for various income ranges: 6.5% for AGIs below $25k, 0.5% for AGIs $25k-50k)
Percentage of individuals using paid preparers for their 2012 taxes: 44.1%
Here:
44%
State:
52%
(% for various income ranges: 44.1% for AGIs below $25k, 37.0% for AGIs $25k-50k, 39.5% for AGIs $50k-75k, 47.6% for AGIs $75k-100k, 51.7% for AGIs $100k-200k, 79.2% for AGIs over 200k)
Averages for the 2004 tax year for zip code 38104, filed in 2005:
Average Adjusted Gross Income (AGI) in 2004: $50,071 (Individual Income Tax Returns)
Here:
$50,071
State:
$44,088
Salary/wage: $43,383 (reported on 87.2% of returns)
Here:
$43,383
State:
$38,825
(% of AGI for various income ranges: 166.0% for AGIs below $10k, 87.4% for AGIs $10k-25k, 90.1% for AGIs $25k-50k, 83.6% for AGIs $50k-75k, 81.8% for AGIs $75k-100k, 62.6% for AGIs over 100k)
Taxable interest for individuals: $2,045 (reported on 30.2% of returns)
This zip code:
$2,045
Tennessee:
$1,802
(% of AGI for various income ranges: 5.7% for AGIs below $10k, 0.9% for AGIs $10k-25k, 0.8% for AGIs $25k-50k, 1.1% for AGIs $50k-75k, 1.1% for AGIs $75k-100k, 1.4% for AGIs over 100k)
Taxable dividends: $6,414 (reported on 20.1% of returns)
Here:
$6,414
State:
$3,727
(% of AGI for various income ranges: 6.8% for AGIs below $10k, 0.9% for AGIs $10k-25k, 0.8% for AGIs $25k-50k, 1.9% for AGIs $50k-75k, 2.0% for AGIs $75k-100k, 3.7% for AGIs over 100k)
Net capital gain/loss: +$20,965 (reported on 17.2% of returns)
Here:
+$20,965
State:
+$15,776
(% of AGI for various income ranges: -0.3% for AGIs below $10k, 0.4% for AGIs $10k-25k, 0.4% for AGIs $25k-50k, 0.8% for AGIs $50k-75k, 1.7% for AGIs $75k-100k, 13.8% for AGIs over 100k)
Profit/loss from business: +$15,255 (reported on 15.9% of returns)
Here:
+$15,255
State:
+$12,882
(% of AGI for various income ranges: 8.1% for AGIs below $10k, 4.0% for AGIs $10k-25k, 2.6% for AGIs $25k-50k, 4.6% for AGIs $50k-75k, 5.1% for AGIs $75k-100k, 5.8% for AGIs over 100k)
IRA payment deduction: $2,601 (reported on 1.9% of returns)
38104:
$2,601
Tennessee:
$2,934
(% of AGI for various income ranges: 0.4% for AGIs below $10k, 0.1% for AGIs $10k-25k, 0.2% for AGIs $25k-50k, 0.2% for AGIs $50k-75k, 0.1% for AGIs $75k-100k, 0.1% for AGIs over 100k)
Self-employed pension: $15,403 (reported on 1.5% of returns)
Here:
$15,403
Tennessee:
$16,857
(% of AGI for various income ranges: 0.1% for AGIs $25k-50k, 0.2% for AGIs $50k-75k, 0.4% for AGIs $75k-100k, 0.8% for AGIs over 100k)
Total itemized deductions: $20,094 (18% of AGI, reported on 27.6% of returns)
Here:
$20,094
State:
$18,035
Here:
18.1% of AGI
State:
19.9% of AGI
(% of AGI for various income ranges: 10.8% for AGIs below $10k, 6.1% for AGIs $10k-25k, 9.4% for AGIs $25k-50k, 13.7% for AGIs $50k-75k, 15.3% for AGIs $75k-100k, 11.3% for AGIs over 100k)
Charity contributions deductions: $5,534 (5% of AGI, reported on 23.5% of returns)
Here:
$5,534
State:
$5,167
Here:
4.6% of AGI
State:
5.3% of AGI
(% of AGI for various income ranges: 1.1% for AGIs below $10k, 0.8% for AGIs $10k-25k, 1.4% for AGIs $25k-50k, 2.3% for AGIs $50k-75k, 2.5% for AGIs $75k-100k, 3.5% for AGIs over 100k)
Total tax: $10,227 (reported on 75.4% of returns)
38104:
$10,227
State:
$7,482
(% of AGI for various income ranges: 5.2% for AGIs below $10k, 4.4% for AGIs $10k-25k, 8.8% for AGIs $25k-50k, 12.0% for AGIs $50k-75k, 13.3% for AGIs $75k-100k, 21.5% for AGIs over 100k)
Earned income credit: $1,634 (reported on 20.0% of returns)
Here:
$1,634
State:
$1,826
Percentage of individuals using paid preparers for their 2004 taxes: 50.1%
Here:
50%
State:
60%
(% for various income ranges: 49.3% for AGIs below $10k, 52.7% for AGIs $10k-25k, 43.0% for AGIs $25k-50k, 47.0% for AGIs $50k-75k, 50.1% for AGIs $75k-100k, 66.5% for AGIs over 100k)
Likely homosexual households (counted as self-reported same-sex unmarried-partner households)
Lesbian couples: 0.7% of all households
Gay men: 1.4% of all households
Household received Food Stamps/SNAP in the past 12 months: 1,264 Household did not receive Food Stamps/SNAP in the past 12 months: 12,141
Women who had a birth in the past 12 months: 239 (154 now married, 84 unmarried) Women who did not have a birth in the past 12 months: 6,812 (1,939 now married, 4,870 unmarried)
Housing units in zip code 38104 with a mortgage: 3,321 (504 second mortgage, 477 both second mortgage and home equity loan) Houses without a mortgage: 55
Median monthly owner costs for units with a mortgage: $1,864 Median monthly owner costs for units without a mortgage: $705
Residents with income below the poverty level in 2022:
This zip code:
14.3%
Whole state:
13.3%
Residents with income below 50% of the poverty level in 2022:
This zip code:
7.1%
Whole state:
7.1%
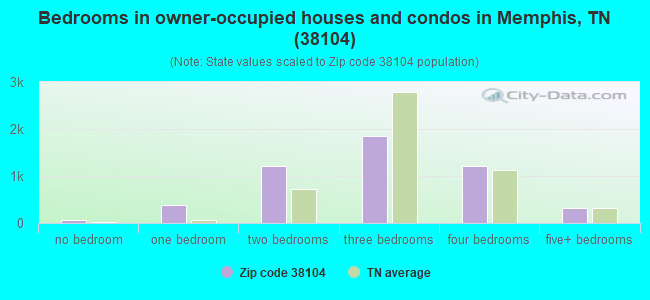
Median number of rooms in houses and condos:
Here:
6.8
State:
6.5
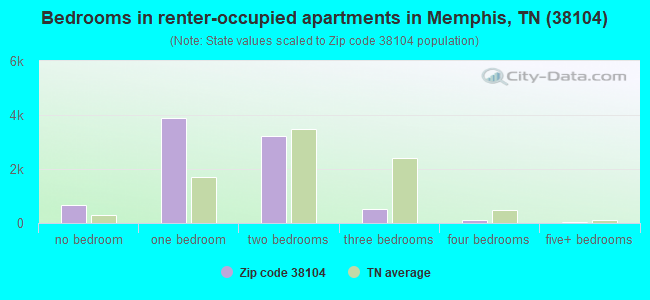
Median number of rooms in apartments:
Here:
3.6
State:
4.4
Notable locations in this zip code not listed on our city pages
Notable locations in zip code 38104: Memphis Boys Club (A), Sargent Yards (B), City of Memphis Division of Fire Station 7 (C), Maurelian Hall (D), Kenrick Hall (E), De LaSalle Hall (F), CBU Theatre (G), Buckman Hall (H), Believers Choice Life Center (I), Battersby Hall (J), Barry Hall (K), Barron Heights Transitional Living Center (L), Union Avenue Baptist Church Child Enrichment Center (M), Thomas Center (N), Saint Joseph Hall (O), Saint Benilde Hall (P), Rozier Hall (Q), Plough Library (R), Pauline Garage (S), Pauline Annex (T). Display/hide their locations on the map
Shopping Centers: Idlewild Plaza Shopping Center (1), Center City Shopping Center (2), Midtown Shopping Center (3), Overton Square Shopping Center (4). Display/hide their locations on the map
Churches in zip code 38104 include: Saint Johns Church (A), Bellevue Baptist Church (B), Little Rock Church (C), Divine Temple Church of God in Christ (D), Eastern Star Baptist Church (E), Emmanuel Presbyterian Church (F), Galloway United Methodist Church (G), Grace-Saint Lukes Episcopal Church (H), Idlewild Church (I). Display/hide their locations on the map
Parks in zip code 38104 include: Libertyland (1), Mid-South Fairgrounds (2), Lewis Center Park (3), Spanish War Memorial Park (4), Memphis Memorial Stadium (5), Crump Stadium (6), Signalgo Field (7), Nolan Field (8), Buckman Quadrangle (9). Display/hide their locations on the map
Tourist attractions (not listed on the city page) : Libertyland Amusement Park (Amusement & Theme Parks; 940 Early Maxwell Boulevard), Mid-South Fair Inc (Amusement & Theme Parks; 940 Early Maxwell Boulevard).
1,691 married couples with children.
1,112 single-parent households (213 men, 899 women).
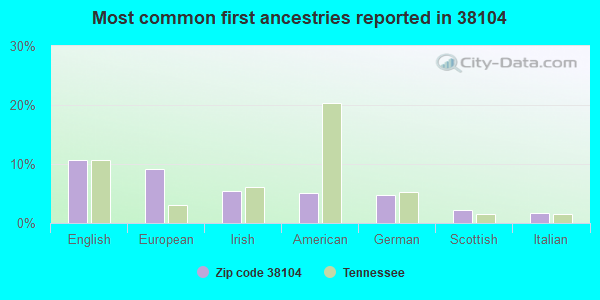
93.7% of residents of 38104 zip code speak English at home.
2.7% of residents speak Spanish at home (53% very well, 16% well, 19% not well, 12% not at all).
1.1% of residents speak other Indo-European language at home (94% very well, 6% well).
2.0% of residents speak Asian or Pacific Island language at home (53% very well, 25% well, 18% not well, 3% not at all).
0.3% of residents speak other language at home (48% very well, 52% well).
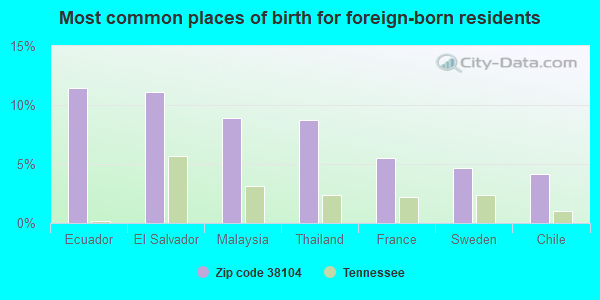
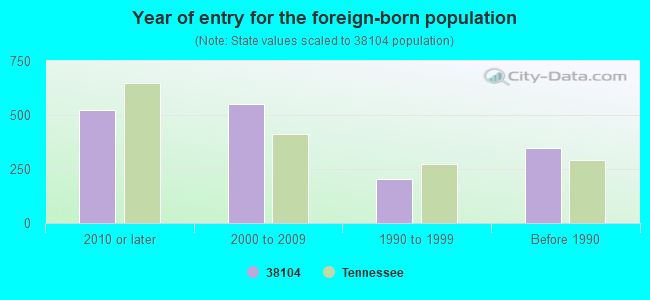
Foreign born population: 1,297 (5.4%) (44.3% of them are naturalized citizens)
Major facilities with environmental interests located in this zip code:
CONAGRA GROCERY PRODUCTS CO (1351 WILLIAMS AVENUE in MEMPHIS, TN)
AIR MAJOR (AIRS/AFS) CRITERIA AND HAZARDOUS AIR POLLUTANT INVENTORY (Inventory of air pollution sources) National Pollutant Discharge Elimination System NON-MAJOR (Tracking pollutant discharge elimination systems) - permit (Resource Conservation and Recovery Act (tracking hazardous waste)) TRI REPORTER (Tracking of toxic chemicals releasing facilities) - ICIS-, ENFORCEMENT/COMPLIANCE ACTIVITY Business SIC classification: SHORTENING, TABLE OILS, MARGARINE, AND OTHER EDIBLE FATS AND OILS Business NAICS classification: FATS AND OILS REFINING AND BLENDING. Organizations: CONAGRA GROCERY PRODUCTS CO. (CONTACT/OWNER)
Alternative names: ConAgra Foods Grocery Foods Group / Wesson, CONAGRA FOODS GROCERY FOODS GROUP / WESSON REFY., CONAGRA FOODS MEMPHIS REFINERY MAIN OFFICE, CONAGRA GROCERY PRODS. CO. HUNT WESSON FOODS, CONAGRA GROCERY PRODUCTS COMPA, HUNT-WESSON FOODS INC.(MEMPHIS REFINERY)
BRUCE ELEMENTARY SCHOOL (1206 CARR AV in MEMPHIS, TN)
(Geographic Names Information System) (National Center for Education Statistics) - STATE ID-0060 Organizations: MEMPHIS CITY SCHOOL DISTRICT (SCHOOL DISTRICT)
CENTRAL HIGH SCHOOL (306 S BELLEVUE in MEMPHIS, TN)
(Geographic Names Information System) (National Center for Education Statistics) - STATE ID-0090 Organizations: MEMPHIS CITY SCHOOL DISTRICT (SCHOOL DISTRICT)
CARWILES CUSTOM CLEANERS INC (2178 CENTRAL AVE in MEMPHIS, TN)
(Resource Conservation and Recovery Act (tracking hazardous waste)) Organizations: DONALD E CARWILE (CONTACT/OPERATOR)
BCS INDUSTRIES LLC (1175 HARBOR AVENUE in MEMPHIS, TN)
(Resource Conservation and Recovery Act (tracking hazardous waste)) TRI REPORTER (Tracking of toxic chemicals releasing facilities) Business SIC classification: STEEL WIREDRAWING AND STEEL NAILS AND SPIKES; METAL HEAT TREATING; COATING, ENGRAVING, AND ALLIED SERVICES Business NAICS classification: STEEL WIRE DRAWING. Alternative names: BCS INDUSTRIES INC, Bluff City Steel , LACLEDE MEMPHIS, LACLEDE STEEL MEMPHIS
CITY ASPHALT (1075 CENTRAL AVENUE in MEMPHIS, TN)
AIR MINOR (AIRS/AFS) CRITERIA AND HAZARDOUS AIR POLLUTANT INVENTORY (Inventory of air pollution sources) Business SIC classification: ASPHALT PAVING MIXTURES AND BLOCKS
ALS OFFICE PRODUCTS INC (1354 MADISON AVE in MEMPHIS, TN)
(Resource Conservation and Recovery Act (tracking hazardous waste)) Business NAICS classification: COMMERCIAL LITHOGRAPHIC PRINTING.
AMERICAN SCREEN & DOOR CO INC (1732 POPLAR AVE in MEMPHIS, TN)
(Resource Conservation and Recovery Act (tracking hazardous waste)) Business NAICS classification: METAL WINDOW AND DOOR MANUFACTURING.
AMOCO OIL SS# 302 (2124 UNION AVE in MEMPHIS, TN)
(Resource Conservation and Recovery Act (tracking hazardous waste)) Business NAICS classification: OTHER FUEL DEALERS.; ALL OTHER AUTOMOTIVE REPAIR AND MAINTENANCE.
APS INC (601 S DUDLEY in MEMPHIS, TN)
(Resource Conservation and Recovery Act (tracking hazardous waste))
ARNOULT PHIL C SIGNS (2025 MADISON AVE in MEMPHIS, TN)
(Resource Conservation and Recovery Act (tracking hazardous waste))
AUDITRONICS INC (207 SUMMITT COR COOPER ST in MEMPHIS, TN)
(Resource Conservation and Recovery Act (tracking hazardous waste))
AUSTIN WILLIAM L DVM (2192 CENTRAL AVE in MEMPHIS, TN)
(Resource Conservation and Recovery Act (tracking hazardous waste))
Housing units lacking complete plumbing facilities: 1.3% Housing units lacking complete kitchen facilities: 2.3%
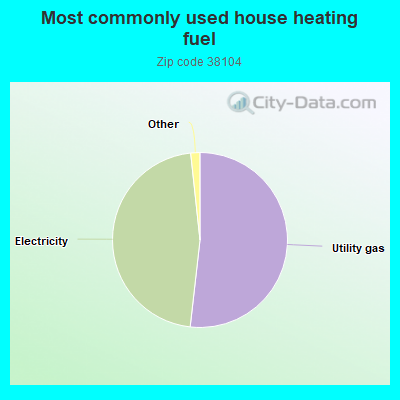
51.8%Utility gas
46.5%Electricity
0.8%Other fuel
0.5%Bottled, tank, or LP gas
Population in 1990: 29,496.
Place of birth for U.S.-born residents:
This state: 12,694
Northeast: 1,244
Midwest: 2,373
South: 5,033
West: 869
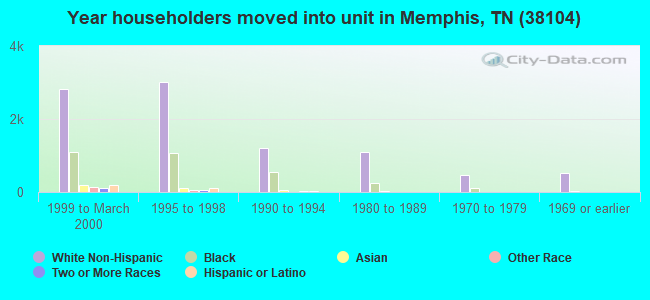
42% of the 38104 zip code residents lived in the same house 5 years ago. Out of people who lived in different houses, 68% lived in this county. Out of people who lived in different counties, 50% lived in Tennessee.
84% of the 38104 zip code residents lived in the same house 1 year ago. Out of people who lived in different houses, 63% moved from this county. Out of people who lived in different houses, 8% moved from different county within same state. Out of people who lived in different houses, 22% moved from different state. Out of people who lived in different houses, 2% moved from abroad.
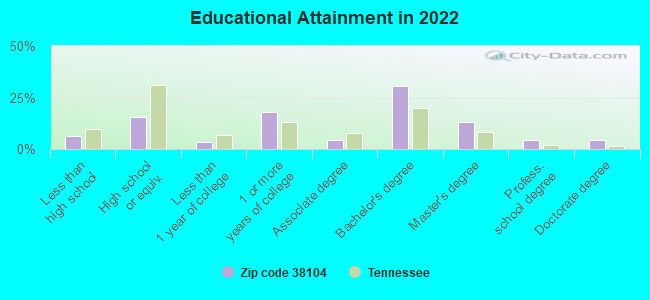
Private vs. public school enrollment:
Students in private schools in grades 1 to 8 (elementary and middle school): 333
Here:
31.0%
Tennessee:
15.0%
Students in private schools in grades 9 to 12 (high school): 250
Here:
37.9%
Tennessee:
16.2%
Students in private undergraduate colleges: 303
Here:
33.0%
Tennessee:
23.5%
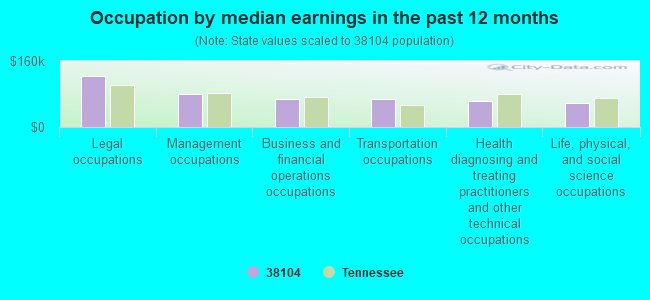
Occupation by median earnings in the past 12 months ($)
124,467Legal occupations
81,202Management occupations
68,037Business and financial operations occupations
67,939Transportation occupations
62,866Health diagnosing and treating practitioners and other technical occupations
58,718Life, physical, and social science occupations
Companies with biggest federal contracts located in this zip code (MEMPHIS, TN):
DWA INC (1331 UNION AVE STE 928; small business) : $5,427,109 in 52 contractsfrom 1999 to 2006
Contracts for Guard Services, Patent and Trademark Services, Other Professional Services, Surveillance Services, and moreby U.S. Army Corps of Engineers - civil program financing only, Air Force, Department of Veterans Affairs, Army, and others Signed by year:2000: $1,068,604; 2001: $1,194,542; 2002: $340,045; 2003: $415,546; 2004: $871,702; 2005: $1,448,300; 2006: $47,370.
Biggest contracts:
$734,244 with U.S. Army Corps of Engineers - civil program financing only for Guard Services. Signed on 2001-06-05. Completion date: 2002-05-25.
$720,036, same as above.Signed on 2000-05-30. Completion date: 2001-05-30.
$369,200 with Air Force for Patent and Trademark Services. Taking place in MS. Signed on 2004-10-01. Completion date: 2005-09-30.
$365,534 with Department of Veterans Affairs for Guard Services. Signed on 2004-10-01. Completion date: 2005-10-01.
SOUTHERN COLLEGE OF OPTOMETRY (1245 MADISON AVE) : $768,485 in 21 contractsfrom 2000 to 2006
Contracts for Tuition, Registration, and Membership Fees, Educational Services, Education Services, Optometry Services by Army, Navy, Department of Veterans Affairs Signed by year:2000: $131,114; 2001: $161,900; 2002: $106,018; 2003: $102,867; 2004: $72,392; 2005: $118,684; 2006: $75,510.
Biggest contracts:
$132,822 with Army for Tuition, Registration, and Membership Fees. Signed on 2001-09-26. Completion date: 2001-09-30.
$98,010 with Navy for Tuition, Registration, and Membership Fees. Signed on 2000-10-01. Completion date: 2000-09-14.
$75,510 with Army for Educational Services. Signed on 2006-04-21. Completion date: 2006-09-30.
$53,376 with Army for Tuition, Registration, and Membership Fees. Signed on 2002-06-12. Completion date: 2002-09-30.
PICKERING FIRM INCORPORATED (1750 MADISON AVE , SUITE 5) : $513,710 in 10 contractsfrom 2000 to 2003
Contracts for Other Non-Building Structures, Other Architect and Engineering Services by Air Force, Department of Veterans Affairs, Navy Signed by year:2000: $80,112; 2001: $6,400; 2002: $423,398; 2003: $3,800; 2004: $0; 2005: $0; 2006: $0.
Biggest contracts:
$203,435 with Air Force for Other Non-Building Structures. Taking place in AR. Signed on 2002-09-29. Completion date: 2003-04-28.
$113,505, same as above.Signed on 2002-09-18. Completion date: 2003-05-30.
$81,000 with Department of Veterans Affairs for Other Non-Building Structures. Signed on 2000-06-15. Completion date: 2000-09-15.
$44,068 with Air Force for Other Non-Building Structures. Taking place in AR. Signed on 2002-09-29. Completion date: 2003-03-05.
CHRISTIAN BROTHERS UNIVERSITY (650 E PARKWAY SOUTH) : $411,500 in 7 contractsfrom 2002 to 2004
Contracts for Other Research and Development -- Basic Research (R&D), Educational Services by NASA, Army Signed by year:2000: $0; 2001: $0; 2002: $218,000; 2003: $185,000; 2004: $8,500; 2005: $0; 2006: $0.
Biggest contracts:
$158,000 with NASA for Other Research and Development -- Basic Research (R&D). Signed on 2002-01-15. Completion date: 2002-12-15.
$145,000, same as above.Signed on 2003-10-01. Completion date: 2002-12-31.
$60,000, same as above.Signed on 2002-12-15. Completion date: 2002-12-15.
$35,000, same as above.Signed on 2003-10-01. Completion date: 2002-12-31.
MID AMERICA SAFETY CONSULTANTS (1519 UNION AVE 211; small business) : $155,500 in 5 contractsfrom 2003 to 2005
Contracts for Educational Services by Army Signed by year:2000: $0; 2001: $0; 2002: $0; 2003: $54,000; 2004: $45,000; 2005: $56,500; 2006: $0.
Biggest contracts:
$54,000 with Army for Educational Services. Signed on 2003-11-12. Completion date: 2004-09-26.
$52,500, same as above.Signed on 2005-11-14. Completion date: 2006-09-30.
$45,000, same as above.Signed on 2004-10-20. Completion date: 2005-09-30.
$4,000, same as above.Signed on 2005-03-16. Completion date: 2005-09-30.
THOMAS CONSULTANTS INC (187 SUMMITT ST; small business)
$131,203 with Army for ADP Input/Output and Storage Devices. Signed on 2004-12-30. Completion date: 2005-01-28.
METHODIST HEALTHCARE (1211 UNION AVE) : $129,340 in 10 contractsfrom 2002 to 2006
Contracts for Radiology Services, Other Medical Services, Other Social Services by Department of Veterans Affairs, Army, U.S. Army Corps of Engineers - civil program financing only Signed by year:2000: $0; 2001: $0; 2002: $13,500; 2003: $27,000; 2004: $44,965; 2005: $40,500; 2006: $3,375.
Biggest contracts:
$44,965 with Department of Veterans Affairs for Radiology Services. Signed on 2004-02-23. Completion date: 2004-06-15.
$13,500 with Army for Other Medical Services. Signed on 2005-07-01. Completion date: 2004-11-09.
$13,500 with U.S. Army Corps of Engineers - civil program financing only for Other Medical Services. Signed on 2005-07-01. Completion date: 2004-11-09.
$13,500 with Army for Other Social Services. Signed on 2003-12-24. Completion date: 2003-01-02.
ARCHITECTS THE HORRELL GROUP (1425 MADISON AVENUE)
$42,485 with Offices, Boards and Divisions (includes Attorney General, Deputy Attorney General, etc.) for Expert Witness. Signed on 2005-02-28. Completion date: 2005-05-30.
PROFESSIONAL VIDEO SYSTEMS (190 SOUTH COOPER ST; small business)
$6,592 with U.S. Army Corps of Engineers - civil program financing only for Photographic Projection Equipment. Signed on 2002-11-08. Completion date: 2002-11-12.
BARNETT SUPPLY CO INC (2089 YORK AVE; small business)
$3,126 with Army for Food Products Machinery and Equipment. Signed on 2004-04-08. Completion date: 2004-04-15.
Top industries in this zip code by the number of employees in 2005:
Health Care and Social Assistance: General Medical and Surgical Hospitals (over 1000 employees: 2 establishments)
2002 - 2018 National Fire Incident Reporting System (NFIRS) incidents
According to the data from the years 2002 - 2018 the average number of fires per year is 112. The highest number of reported fires - 153 took place in 2010, and the least - 35 in 2004. The data has a growing trend.
When looking into fire subcategories, the most reports belonged to: Structure Fires (43.6%), and Mobile Property/Vehicle Fires (26.7%).
Fire incident types reported to NFIRS in Zip Code 38104


 Nearest zip codes: 38112, 38105, 38114, 38126, 38107, 38103.
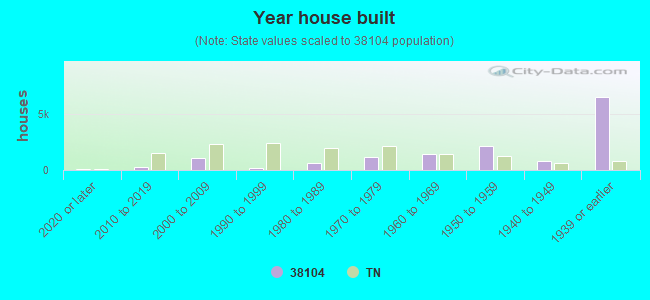


 According to the data from the years 2002 - 2018 the average number of fires per year is 112. The highest number of reported fires - 153 took place in 2010, and the least - 35 in 2004. The data has a growing trend.
 When looking into fire subcategories, the most reports belonged to: Structure Fires (43.6%), and Mobile Property/Vehicle Fires (26.7%).