Estimated zip code population in 2022: 5,311
Zip code population in 2010: 6,184
Zip code population in 2000: 8,976
Houses and condos: 4,165
Renter-occupied apartments: 3,035
% of renters here:
90%State:
33%
March 2022 cost of living index in zip code 38105: 85.1
(less than average, U.S. average is 100)
Land area: 1.7
sq. mi.
Water area: 0.0
sq. mi.
Population density: 3,119 people per square mile (average).
OSM Map
General Map
Google Map
MSN Map
OSM Map
General Map
Google Map
MSN Map
OSM Map
General Map
Google Map
MSN Map
OSM Map
General Map
Google Map
MSN Map
Please wait while loading the map...
Real estate property taxes paid for housing units in 2022:
This zip code:
0.8% ($786)Tennessee:
0.5% ($1,376)
Median real estate property taxes paid for housing units with mortgages in 2022: $797 (0.8%)
Median real estate property taxes paid for housing units with no mortgage in 2022: $756 (1.0%)
Business Search - 14 Million verified businesses
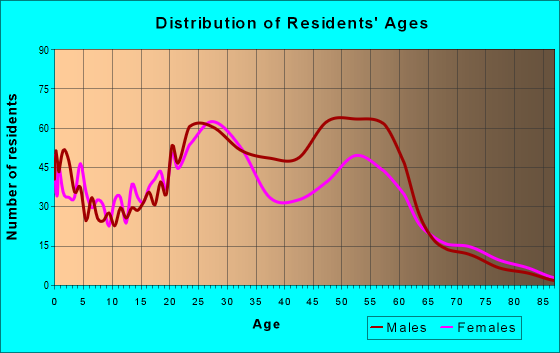
Males: 2,328 Females: 2,982
For population 25 years and over in 38105:
High school or higher: 80.3%Bachelor's degree or higher: 21.6%Graduate or professional degree: 8.4%Unemployed: 7.1%Mean travel time to work (commute): 20.9 minutes
For population 15 years and over in 38105:
Never married: 56.2%Now married: 21.8%Separated: 3.9%Widowed: 4.5%Divorced: 13.5%
Zip code 38105 compared to state average:
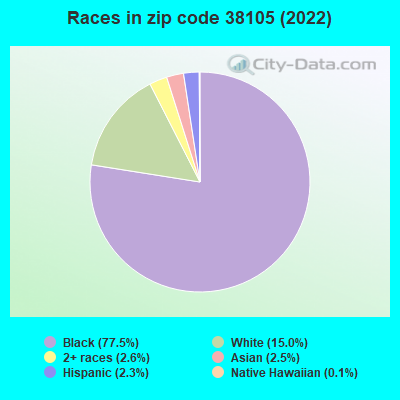
Median household income significantly below state average. Median house value significantly below state average. Unemployed percentage above state average. Black race population percentage significantly above state average. Hispanic race population percentage below state average. Median age above state average. Renting percentage significantly above state average. Length of stay since moving in significantly above state average. Number of rooms per house significantly below state average. House age above state average. 4,113 77.5% Black 797 15.0% White 139 2.6% Two or more races 133 2.5% Asian 121 2.3% Hispanic or Latino 6 0.1% Native Hawaiian and Other
Data:
Median household income ($)
Median household income (% change since 2000)
Household income diversity
Ratio of average income to average house value (%)
Ratio of average income to average rent
Median household income ($) - White
Median household income ($) - Black or African American
Median household income ($) - Asian
Median household income ($) - Hispanic or Latino
Median household income ($) - American Indian and Alaska Native
Median household income ($) - Multirace
Median household income ($) - Other Race
Median household income for houses/condos with a mortgage ($)
Median household income for apartments without a mortgage ($)
Races - White alone (%)
Races - White alone (% change since 2000)
Races - Black alone (%)
Races - Black alone (% change since 2000)
Races - American Indian alone (%)
Races - American Indian alone (% change since 2000)
Races - Asian alone (%)
Races - Asian alone (% change since 2000)
Races - Hispanic (%)
Races - Hispanic (% change since 2000)
Races - Native Hawaiian and Other Pacific Islander alone (%)
Races - Native Hawaiian and Other Pacific Islander alone (% change since 2000)
Races - Two or more races (%)
Races - Two or more races (% change since 2000)
Races - Other race alone (%)
Races - Other race alone (% change since 2000)
Racial diversity
Unemployment (%)
Unemployment (% change since 2000)
Unemployment (%) - White
Unemployment (%) - Black or African American
Unemployment (%) - Asian
Unemployment (%) - Hispanic or Latino
Unemployment (%) - American Indian and Alaska Native
Unemployment (%) - Multirace
Unemployment (%) - Other Race
Population density (people per square mile)
Population - Males (%)
Population - Females (%)
Population - Males (%) - White
Population - Males (%) - Black or African American
Population - Males (%) - Asian
Population - Males (%) - Hispanic or Latino
Population - Males (%) - American Indian and Alaska Native
Population - Males (%) - Multirace
Population - Males (%) - Other Race
Population - Females (%) - White
Population - Females (%) - Black or African American
Population - Females (%) - Asian
Population - Females (%) - Hispanic or Latino
Population - Females (%) - American Indian and Alaska Native
Population - Females (%) - Multirace
Population - Females (%) - Other Race
Coronavirus confirmed cases (Apr 27, 2024)
Deaths caused by coronavirus (Apr 27, 2024)
Coronavirus confirmed cases (per 100k population) (Apr 27, 2024)
Deaths caused by coronavirus (per 100k population) (Apr 27, 2024)
Daily increase in number of cases (Apr 27, 2024)
Weekly increase in number of cases (Apr 27, 2024)
Cases doubled (in days) (Apr 27, 2024)
Hospitalized patients (Apr 18, 2022)
Negative test results (Apr 18, 2022)
Total test results (Apr 18, 2022)
COVID Vaccine doses distributed (per 100k population) (Sep 19, 2023)
COVID Vaccine doses administered (per 100k population) (Sep 19, 2023)
COVID Vaccine doses distributed (Sep 19, 2023)
COVID Vaccine doses administered (Sep 19, 2023)
Likely homosexual households (%)
Likely homosexual households (% change since 2000)
Likely homosexual households - Lesbian couples (%)
Likely homosexual households - Lesbian couples (% change since 2000)
Likely homosexual households - Gay men (%)
Likely homosexual households - Gay men (% change since 2000)
Cost of living index
Median gross rent ($)
Median contract rent ($)
Median monthly housing costs ($)
Median house or condo value ($)
Median house or condo value ($ change since 2000)
Mean house or condo value by units in structure - 1, detached ($)
Mean house or condo value by units in structure - 1, attached ($)
Mean house or condo value by units in structure - 2 ($)
Mean house or condo value by units in structure by units in structure - 3 or 4 ($)
Mean house or condo value by units in structure - 5 or more ($)
Mean house or condo value by units in structure - Boat, RV, van, etc. ($)
Mean house or condo value by units in structure - Mobile home ($)
Median house or condo value ($) - White
Median house or condo value ($) - Black or African American
Median house or condo value ($) - Asian
Median house or condo value ($) - Hispanic or Latino
Median house or condo value ($) - American Indian and Alaska Native
Median house or condo value ($) - Multirace
Median house or condo value ($) - Other Race
Median resident age
Resident age diversity
Median resident age - Males
Median resident age - Females
Median resident age - White
Median resident age - Black or African American
Median resident age - Asian
Median resident age - Hispanic or Latino
Median resident age - American Indian and Alaska Native
Median resident age - Multirace
Median resident age - Other Race
Median resident age - Males - White
Median resident age - Males - Black or African American
Median resident age - Males - Asian
Median resident age - Males - Hispanic or Latino
Median resident age - Males - American Indian and Alaska Native
Median resident age - Males - Multirace
Median resident age - Males - Other Race
Median resident age - Females - White
Median resident age - Females - Black or African American
Median resident age - Females - Asian
Median resident age - Females - Hispanic or Latino
Median resident age - Females - American Indian and Alaska Native
Median resident age - Females - Multirace
Median resident age - Females - Other Race
Commute - mean travel time to work (minutes)
Travel time to work - Less than 5 minutes (%)
Travel time to work - Less than 5 minutes (% change since 2000)
Travel time to work - 5 to 9 minutes (%)
Travel time to work - 5 to 9 minutes (% change since 2000)
Travel time to work - 10 to 19 minutes (%)
Travel time to work - 10 to 19 minutes (% change since 2000)
Travel time to work - 20 to 29 minutes (%)
Travel time to work - 20 to 29 minutes (% change since 2000)
Travel time to work - 30 to 39 minutes (%)
Travel time to work - 30 to 39 minutes (% change since 2000)
Travel time to work - 40 to 59 minutes (%)
Travel time to work - 40 to 59 minutes (% change since 2000)
Travel time to work - 60 to 89 minutes (%)
Travel time to work - 60 to 89 minutes (% change since 2000)
Travel time to work - 90 or more minutes (%)
Travel time to work - 90 or more minutes (% change since 2000)
Marital status - Never married (%)
Marital status - Now married (%)
Marital status - Separated (%)
Marital status - Widowed (%)
Marital status - Divorced (%)
Median family income ($)
Median family income (% change since 2000)
Median non-family income ($)
Median non-family income (% change since 2000)
Median per capita income ($)
Median per capita income (% change since 2000)
Median family income ($) - White
Median family income ($) - Black or African American
Median family income ($) - Asian
Median family income ($) - Hispanic or Latino
Median family income ($) - American Indian and Alaska Native
Median family income ($) - Multirace
Median family income ($) - Other Race
Median year house/condo built
Median year apartment built
Year house built - Built 2005 or later (%)
Year house built - Built 2000 to 2004 (%)
Year house built - Built 1990 to 1999 (%)
Year house built - Built 1980 to 1989 (%)
Year house built - Built 1970 to 1979 (%)
Year house built - Built 1960 to 1969 (%)
Year house built - Built 1950 to 1959 (%)
Year house built - Built 1940 to 1949 (%)
Year house built - Built 1939 or earlier (%)
Average household size
Household density (households per square mile)
Average household size - White
Average household size - Black or African American
Average household size - Asian
Average household size - Hispanic or Latino
Average household size - American Indian and Alaska Native
Average household size - Multirace
Average household size - Other Race
Occupied housing units (%)
Vacant housing units (%)
Owner occupied housing units (%)
Renter occupied housing units (%)
Vacancy status - For rent (%)
Vacancy status - For sale only (%)
Vacancy status - Rented or sold, not occupied (%)
Vacancy status - For seasonal, recreational, or occasional use (%)
Vacancy status - For migrant workers (%)
Vacancy status - Other vacant (%)
Residents with income below the poverty level (%)
Residents with income below 50% of the poverty level (%)
Children below poverty level (%)
Poor families by family type - Married-couple family (%)
Poor families by family type - Male, no wife present (%)
Poor families by family type - Female, no husband present (%)
Poverty status for native-born residents (%)
Poverty status for foreign-born residents (%)
Poverty among high school graduates not in families (%)
Poverty among people who did not graduate high school not in families (%)
Residents with income below the poverty level (%) - White
Residents with income below the poverty level (%) - Black or African American
Residents with income below the poverty level (%) - Asian
Residents with income below the poverty level (%) - Hispanic or Latino
Residents with income below the poverty level (%) - American Indian and Alaska Native
Residents with income below the poverty level (%) - Multirace
Residents with income below the poverty level (%) - Other Race
Air pollution - Air Quality Index (AQI)
Air pollution - CO
Air pollution - NO2
Air pollution - SO2
Air pollution - Ozone
Air pollution - PM10
Air pollution - PM25
Air pollution - Pb
Crime - Murders per 100,000 population
Crime - Rapes per 100,000 population
Crime - Robberies per 100,000 population
Crime - Assaults per 100,000 population
Crime - Burglaries per 100,000 population
Crime - Thefts per 100,000 population
Crime - Auto thefts per 100,000 population
Crime - Arson per 100,000 population
Crime - City-data.com crime index
Crime - Violent crime index
Crime - Property crime index
Crime - Murders per 100,000 population (5 year average)
Crime - Rapes per 100,000 population (5 year average)
Crime - Robberies per 100,000 population (5 year average)
Crime - Assaults per 100,000 population (5 year average)
Crime - Burglaries per 100,000 population (5 year average)
Crime - Thefts per 100,000 population (5 year average)
Crime - Auto thefts per 100,000 population (5 year average)
Crime - Arson per 100,000 population (5 year average)
Crime - City-data.com crime index (5 year average)
Crime - Violent crime index (5 year average)
Crime - Property crime index (5 year average)
1996 Presidential Elections Results (%) - Democratic Party (Clinton)
1996 Presidential Elections Results (%) - Republican Party (Dole)
1996 Presidential Elections Results (%) - Other
2000 Presidential Elections Results (%) - Democratic Party (Gore)
2000 Presidential Elections Results (%) - Republican Party (Bush)
2000 Presidential Elections Results (%) - Other
2004 Presidential Elections Results (%) - Democratic Party (Kerry)
2004 Presidential Elections Results (%) - Republican Party (Bush)
2004 Presidential Elections Results (%) - Other
2008 Presidential Elections Results (%) - Democratic Party (Obama)
2008 Presidential Elections Results (%) - Republican Party (McCain)
2008 Presidential Elections Results (%) - Other
2012 Presidential Elections Results (%) - Democratic Party (Obama)
2012 Presidential Elections Results (%) - Republican Party (Romney)
2012 Presidential Elections Results (%) - Other
2016 Presidential Elections Results (%) - Democratic Party (Clinton)
2016 Presidential Elections Results (%) - Republican Party (Trump)
2016 Presidential Elections Results (%) - Other
2020 Presidential Elections Results (%) - Democratic Party (Biden)
2020 Presidential Elections Results (%) - Republican Party (Trump)
2020 Presidential Elections Results (%) - Other
Ancestries Reported - Arab (%)
Ancestries Reported - Czech (%)
Ancestries Reported - Danish (%)
Ancestries Reported - Dutch (%)
Ancestries Reported - English (%)
Ancestries Reported - French (%)
Ancestries Reported - French Canadian (%)
Ancestries Reported - German (%)
Ancestries Reported - Greek (%)
Ancestries Reported - Hungarian (%)
Ancestries Reported - Irish (%)
Ancestries Reported - Italian (%)
Ancestries Reported - Lithuanian (%)
Ancestries Reported - Norwegian (%)
Ancestries Reported - Polish (%)
Ancestries Reported - Portuguese (%)
Ancestries Reported - Russian (%)
Ancestries Reported - Scotch-Irish (%)
Ancestries Reported - Scottish (%)
Ancestries Reported - Slovak (%)
Ancestries Reported - Subsaharan African (%)
Ancestries Reported - Swedish (%)
Ancestries Reported - Swiss (%)
Ancestries Reported - Ukrainian (%)
Ancestries Reported - United States (%)
Ancestries Reported - Welsh (%)
Ancestries Reported - West Indian (%)
Ancestries Reported - Other (%)
Educational Attainment - No schooling completed (%)
Educational Attainment - Less than high school (%)
Educational Attainment - High school or equivalent (%)
Educational Attainment - Less than 1 year of college (%)
Educational Attainment - 1 or more years of college (%)
Educational Attainment - Associate degree (%)
Educational Attainment - Bachelor's degree (%)
Educational Attainment - Master's degree (%)
Educational Attainment - Professional school degree (%)
Educational Attainment - Doctorate degree (%)
School Enrollment - Nursery, preschool (%)
School Enrollment - Kindergarten (%)
School Enrollment - Grade 1 to 4 (%)
School Enrollment - Grade 5 to 8 (%)
School Enrollment - Grade 9 to 12 (%)
School Enrollment - College undergrad (%)
School Enrollment - Graduate or professional (%)
School Enrollment - Not enrolled in school (%)
School enrollment - Public schools (%)
School enrollment - Private schools (%)
School enrollment - Not enrolled (%)
Median number of rooms in houses and condos
Median number of rooms in apartments
Housing units lacking complete plumbing facilities (%)
Housing units lacking complete kitchen facilities (%)
Density of houses
Urban houses (%)
Rural houses (%)
Households with people 60 years and over (%)
Households with people 65 years and over (%)
Households with people 75 years and over (%)
Households with one or more nonrelatives (%)
Households with no nonrelatives (%)
Population in households (%)
Family households (%)
Nonfamily households (%)
Population in families (%)
Family households with own children (%)
Median number of bedrooms in owner occupied houses
Mean number of bedrooms in owner occupied houses
Median number of bedrooms in renter occupied houses
Mean number of bedrooms in renter occupied houses
Median number of vehichles in owner occupied houses
Mean number of vehichles in owner occupied houses
Median number of vehichles in renter occupied houses
Mean number of vehichles in renter occupied houses
Mortgage status - with mortgage (%)
Mortgage status - with second mortgage (%)
Mortgage status - with home equity loan (%)
Mortgage status - with both second mortgage and home equity loan (%)
Mortgage status - without a mortgage (%)
Average family size
Average family size - White
Average family size - Black or African American
Average family size - Asian
Average family size - Hispanic or Latino
Average family size - American Indian and Alaska Native
Average family size - Multirace
Average family size - Other Race
Geographical mobility - Same house 1 year ago (%)
Geographical mobility - Moved within same county (%)
Geographical mobility - Moved from different county within same state (%)
Geographical mobility - Moved from different state (%)
Geographical mobility - Moved from abroad (%)
Place of birth - Born in state of residence (%)
Place of birth - Born in other state (%)
Place of birth - Native, outside of US (%)
Place of birth - Foreign born (%)
Housing units in structures - 1, detached (%)
Housing units in structures - 1, attached (%)
Housing units in structures - 2 (%)
Housing units in structures - 3 or 4 (%)
Housing units in structures - 5 to 9 (%)
Housing units in structures - 10 to 19 (%)
Housing units in structures - 20 to 49 (%)
Housing units in structures - 50 or more (%)
Housing units in structures - Mobile home (%)
Housing units in structures - Boat, RV, van, etc. (%)
House/condo owner moved in on average (years ago)
Renter moved in on average (years ago)
Year householder moved into unit - Moved in 1999 to March 2000 (%)
Year householder moved into unit - Moved in 1995 to 1998 (%)
Year householder moved into unit - Moved in 1990 to 1994 (%)
Year householder moved into unit - Moved in 1980 to 1989 (%)
Year householder moved into unit - Moved in 1970 to 1979 (%)
Year householder moved into unit - Moved in 1969 or earlier (%)
Means of transportation to work - Drove car alone (%)
Means of transportation to work - Carpooled (%)
Means of transportation to work - Public transportation (%)
Means of transportation to work - Bus or trolley bus (%)
Means of transportation to work - Streetcar or trolley car (%)
Means of transportation to work - Subway or elevated (%)
Means of transportation to work - Railroad (%)
Means of transportation to work - Ferryboat (%)
Means of transportation to work - Taxicab (%)
Means of transportation to work - Motorcycle (%)
Means of transportation to work - Bicycle (%)
Means of transportation to work - Walked (%)
Means of transportation to work - Other means (%)
Working at home (%)
Industry diversity
Most Common Industries - Agriculture, forestry, fishing and hunting, and mining (%)
Most Common Industries - Agriculture, forestry, fishing and hunting (%)
Most Common Industries - Mining, quarrying, and oil and gas extraction (%)
Most Common Industries - Construction (%)
Most Common Industries - Manufacturing (%)
Most Common Industries - Wholesale trade (%)
Most Common Industries - Retail trade (%)
Most Common Industries - Transportation and warehousing, and utilities (%)
Most Common Industries - Transportation and warehousing (%)
Most Common Industries - Utilities (%)
Most Common Industries - Information (%)
Most Common Industries - Finance and insurance, and real estate and rental and leasing (%)
Most Common Industries - Finance and insurance (%)
Most Common Industries - Real estate and rental and leasing (%)
Most Common Industries - Professional, scientific, and management, and administrative and waste management services (%)
Most Common Industries - Professional, scientific, and technical services (%)
Most Common Industries - Management of companies and enterprises (%)
Most Common Industries - Administrative and support and waste management services (%)
Most Common Industries - Educational services, and health care and social assistance (%)
Most Common Industries - Educational services (%)
Most Common Industries - Health care and social assistance (%)
Most Common Industries - Arts, entertainment, and recreation, and accommodation and food services (%)
Most Common Industries - Arts, entertainment, and recreation (%)
Most Common Industries - Accommodation and food services (%)
Most Common Industries - Other services, except public administration (%)
Most Common Industries - Public administration (%)
Occupation diversity
Most Common Occupations - Management, business, science, and arts occupations (%)
Most Common Occupations - Management, business, and financial occupations (%)
Most Common Occupations - Management occupations (%)
Most Common Occupations - Business and financial operations occupations (%)
Most Common Occupations - Computer, engineering, and science occupations (%)
Most Common Occupations - Computer and mathematical occupations (%)
Most Common Occupations - Architecture and engineering occupations (%)
Most Common Occupations - Life, physical, and social science occupations (%)
Most Common Occupations - Education, legal, community service, arts, and media occupations (%)
Most Common Occupations - Community and social service occupations (%)
Most Common Occupations - Legal occupations (%)
Most Common Occupations - Education, training, and library occupations (%)
Most Common Occupations - Arts, design, entertainment, sports, and media occupations (%)
Most Common Occupations - Healthcare practitioners and technical occupations (%)
Most Common Occupations - Health diagnosing and treating practitioners and other technical occupations (%)
Most Common Occupations - Health technologists and technicians (%)
Most Common Occupations - Service occupations (%)
Most Common Occupations - Healthcare support occupations (%)
Most Common Occupations - Protective service occupations (%)
Most Common Occupations - Fire fighting and prevention, and other protective service workers including supervisors (%)
Most Common Occupations - Law enforcement workers including supervisors (%)
Most Common Occupations - Food preparation and serving related occupations (%)
Most Common Occupations - Building and grounds cleaning and maintenance occupations (%)
Most Common Occupations - Personal care and service occupations (%)
Most Common Occupations - Sales and office occupations (%)
Most Common Occupations - Sales and related occupations (%)
Most Common Occupations - Office and administrative support occupations (%)
Most Common Occupations - Natural resources, construction, and maintenance occupations (%)
Most Common Occupations - Farming, fishing, and forestry occupations (%)
Most Common Occupations - Construction and extraction occupations (%)
Most Common Occupations - Installation, maintenance, and repair occupations (%)
Most Common Occupations - Production, transportation, and material moving occupations (%)
Most Common Occupations - Production occupations (%)
Most Common Occupations - Transportation occupations (%)
Most Common Occupations - Material moving occupations (%)
People in Group quarters - Institutionalized population (%)
People in Group quarters - Correctional institutions (%)
People in Group quarters - Federal prisons and detention centers (%)
People in Group quarters - Halfway houses (%)
People in Group quarters - Local jails and other confinement facilities (including police lockups) (%)
People in Group quarters - Military disciplinary barracks (%)
People in Group quarters - State prisons (%)
People in Group quarters - Other types of correctional institutions (%)
People in Group quarters - Nursing homes (%)
People in Group quarters - Hospitals/wards, hospices, and schools for the handicapped (%)
People in Group quarters - Hospitals/wards and hospices for chronically ill (%)
People in Group quarters - Hospices or homes for chronically ill (%)
People in Group quarters - Military hospitals or wards for chronically ill (%)
People in Group quarters - Other hospitals or wards for chronically ill (%)
People in Group quarters - Hospitals or wards for drug/alcohol abuse (%)
People in Group quarters - Mental (Psychiatric) hospitals or wards (%)
People in Group quarters - Schools, hospitals, or wards for the mentally retarded (%)
People in Group quarters - Schools, hospitals, or wards for the physically handicapped (%)
People in Group quarters - Institutions for the deaf (%)
People in Group quarters - Institutions for the blind (%)
People in Group quarters - Orthopedic wards and institutions for the physically handicapped (%)
People in Group quarters - Wards in general hospitals for patients who have no usual home elsewhere (%)
People in Group quarters - Wards in military hospitals for patients who have no usual home elsewhere (%)
People in Group quarters - Juvenile institutions (%)
People in Group quarters - Long-term care (%)
People in Group quarters - Homes for abused, dependent, and neglected children (%)
People in Group quarters - Residential treatment centers for emotionally disturbed children (%)
People in Group quarters - Training schools for juvenile delinquents (%)
People in Group quarters - Short-term care, detention or diagnostic centers for delinquent children (%)
People in Group quarters - Type of juvenile institution unknown (%)
People in Group quarters - Noninstitutionalized population (%)
People in Group quarters - College dormitories (includes college quarters off campus) (%)
People in Group quarters - Military quarters (%)
People in Group quarters - On base (%)
People in Group quarters - Barracks, unaccompanied personnel housing (UPH), (Enlisted/Officer), ;and similar group living quarters for military personnel (%)
People in Group quarters - Transient quarters for temporary residents (%)
People in Group quarters - Military ships (%)
People in Group quarters - Group homes (%)
People in Group quarters - Homes or halfway houses for drug/alcohol abuse (%)
People in Group quarters - Homes for the mentally ill (%)
People in Group quarters - Homes for the mentally retarded (%)
People in Group quarters - Homes for the physically handicapped (%)
People in Group quarters - Other group homes (%)
People in Group quarters - Religious group quarters (%)
People in Group quarters - Dormitories (%)
People in Group quarters - Agriculture workers' dormitories on farms (%)
People in Group quarters - Job Corps and vocational training facilities (%)
People in Group quarters - Other workers' dormitories (%)
People in Group quarters - Crews of maritime vessels (%)
People in Group quarters - Other nonhousehold living situations (%)
People in Group quarters - Other noninstitutional group quarters (%)
Residents speaking English at home (%)
Residents speaking English at home - Born in the United States (%)
Residents speaking English at home - Native, born elsewhere (%)
Residents speaking English at home - Foreign born (%)
Residents speaking Spanish at home (%)
Residents speaking Spanish at home - Born in the United States (%)
Residents speaking Spanish at home - Native, born elsewhere (%)
Residents speaking Spanish at home - Foreign born (%)
Residents speaking other language at home (%)
Residents speaking other language at home - Born in the United States (%)
Residents speaking other language at home - Native, born elsewhere (%)
Residents speaking other language at home - Foreign born (%)
Class of Workers - Employee of private company (%)
Class of Workers - Self-employed in own incorporated business (%)
Class of Workers - Private not-for-profit wage and salary workers (%)
Class of Workers - Local government workers (%)
Class of Workers - State government workers (%)
Class of Workers - Federal government workers (%)
Class of Workers - Self-employed workers in own not incorporated business and Unpaid family workers (%)
House heating fuel used in houses and condos - Utility gas (%)
House heating fuel used in houses and condos - Bottled, tank, or LP gas (%)
House heating fuel used in houses and condos - Electricity (%)
House heating fuel used in houses and condos - Fuel oil, kerosene, etc. (%)
House heating fuel used in houses and condos - Coal or coke (%)
House heating fuel used in houses and condos - Wood (%)
House heating fuel used in houses and condos - Solar energy (%)
House heating fuel used in houses and condos - Other fuel (%)
House heating fuel used in houses and condos - No fuel used (%)
House heating fuel used in apartments - Utility gas (%)
House heating fuel used in apartments - Bottled, tank, or LP gas (%)
House heating fuel used in apartments - Electricity (%)
House heating fuel used in apartments - Fuel oil, kerosene, etc. (%)
House heating fuel used in apartments - Coal or coke (%)
House heating fuel used in apartments - Wood (%)
House heating fuel used in apartments - Solar energy (%)
House heating fuel used in apartments - Other fuel (%)
House heating fuel used in apartments - No fuel used (%)
Armed forces status - In Armed Forces (%)
Armed forces status - Civilian (%)
Armed forces status - Civilian - Veteran (%)
Armed forces status - Civilian - Nonveteran (%)
Fatal accidents locations in years 2005-2021
Fatal accidents locations in 2005
Fatal accidents locations in 2006
Fatal accidents locations in 2007
Fatal accidents locations in 2008
Fatal accidents locations in 2009
Fatal accidents locations in 2010
Fatal accidents locations in 2011
Fatal accidents locations in 2012
Fatal accidents locations in 2013
Fatal accidents locations in 2014
Fatal accidents locations in 2015
Fatal accidents locations in 2016
Fatal accidents locations in 2017
Fatal accidents locations in 2018
Fatal accidents locations in 2019
Fatal accidents locations in 2020
Fatal accidents locations in 2021
Alcohol use - People drinking some alcohol every month (%)
Alcohol use - People not drinking at all (%)
Alcohol use - Average days/month drinking alcohol
Alcohol use - Average drinks/week
Alcohol use - Average days/year people drink much
Audiometry - Average condition of hearing (%)
Audiometry - People that can hear a whisper from across a quiet room (%)
Audiometry - People that can hear normal voice from across a quiet room (%)
Audiometry - Ears ringing, roaring, buzzing (%)
Audiometry - Had a job exposure to loud noise (%)
Audiometry - Had off-work exposure to loud noise (%)
Blood Pressure & Cholesterol - Has high blood pressure (%)
Blood Pressure & Cholesterol - Checking blood pressure at home (%)
Blood Pressure & Cholesterol - Frequently checking blood cholesterol (%)
Blood Pressure & Cholesterol - Has high cholesterol level (%)
Consumer Behavior - Money monthly spent on food at supermarket/grocery store
Consumer Behavior - Money monthly spent on food at other stores
Consumer Behavior - Money monthly spent on eating out
Consumer Behavior - Money monthly spent on carryout/delivered foods
Consumer Behavior - Income spent on food at supermarket/grocery store (%)
Consumer Behavior - Income spent on food at other stores (%)
Consumer Behavior - Income spent on eating out (%)
Consumer Behavior - Income spent on carryout/delivered foods (%)
Current Health Status - General health condition (%)
Current Health Status - Blood donors (%)
Current Health Status - Has blood ever tested for HIV virus (%)
Current Health Status - Left-handed people (%)
Dermatology - People using sunscreen (%)
Diabetes - Diabetics (%)
Diabetes - Had a blood test for high blood sugar (%)
Diabetes - People taking insulin (%)
Diet Behavior & Nutrition - Diet health (%)
Diet Behavior & Nutrition - Milk product consumption (# of products/month)
Diet Behavior & Nutrition - Meals not home prepared (#/week)
Diet Behavior & Nutrition - Meals from fast food or pizza place (#/week)
Diet Behavior & Nutrition - Ready-to-eat foods (#/month)
Diet Behavior & Nutrition - Frozen meals/pizza (#/month)
Drug Use - People that ever used marijuana or hashish (%)
Drug Use - Ever used hard drugs (%)
Drug Use - Ever used any form of cocaine (%)
Drug Use - Ever used heroin (%)
Drug Use - Ever used methamphetamine (%)
Health Insurance - People covered by health insurance (%)
Kidney Conditions-Urology - Avg. # of times urinating at night
Medical Conditions - People with asthma (%)
Medical Conditions - People with anemia (%)
Medical Conditions - People with psoriasis (%)
Medical Conditions - People with overweight (%)
Medical Conditions - Elderly people having difficulties in thinking or remembering (%)
Medical Conditions - People who ever received blood transfusion (%)
Medical Conditions - People having trouble seeing even with glass/contacts (%)
Medical Conditions - People with arthritis (%)
Medical Conditions - People with gout (%)
Medical Conditions - People with congestive heart failure (%)
Medical Conditions - People with coronary heart disease (%)
Medical Conditions - People with angina pectoris (%)
Medical Conditions - People who ever had heart attack (%)
Medical Conditions - People who ever had stroke (%)
Medical Conditions - People with emphysema (%)
Medical Conditions - People with thyroid problem (%)
Medical Conditions - People with chronic bronchitis (%)
Medical Conditions - People with any liver condition (%)
Medical Conditions - People who ever had cancer or malignancy (%)
Mental Health - People who have little interest in doing things (%)
Mental Health - People feeling down, depressed, or hopeless (%)
Mental Health - People who have trouble sleeping or sleeping too much (%)
Mental Health - People feeling tired or having little energy (%)
Mental Health - People with poor appetite or overeating (%)
Mental Health - People feeling bad about themself (%)
Mental Health - People who have trouble concentrating on things (%)
Mental Health - People moving or speaking slowly or too fast (%)
Mental Health - People having thoughts they would be better off dead (%)
Oral Health - Average years since last visit a dentist
Oral Health - People embarrassed because of mouth (%)
Oral Health - People with gum disease (%)
Oral Health - General health of teeth and gums (%)
Oral Health - Average days a week using dental floss/device
Oral Health - Average days a week using mouthwash for dental problem
Oral Health - Average number of teeth
Pesticide Use - Households using pesticides to control insects (%)
Pesticide Use - Households using pesticides to kill weeds (%)
Physical Activity - People doing vigorous-intensity work activities (%)
Physical Activity - People doing moderate-intensity work activities (%)
Physical Activity - People walking or bicycling (%)
Physical Activity - People doing vigorous-intensity recreational activities (%)
Physical Activity - People doing moderate-intensity recreational activities (%)
Physical Activity - Average hours a day doing sedentary activities
Physical Activity - Average hours a day watching TV or videos
Physical Activity - Average hours a day using computer
Physical Functioning - People having limitations keeping them from working (%)
Physical Functioning - People limited in amount of work they can do (%)
Physical Functioning - People that need special equipment to walk (%)
Physical Functioning - People experiencing confusion/memory problems (%)
Physical Functioning - People requiring special healthcare equipment (%)
Prescription Medications - Average number of prescription medicines taking
Preventive Aspirin Use - Adults 40+ taking low-dose aspirin (%)
Reproductive Health - Vaginal deliveries (%)
Reproductive Health - Cesarean deliveries (%)
Reproductive Health - Deliveries resulted in a live birth (%)
Reproductive Health - Pregnancies resulted in a delivery (%)
Reproductive Health - Women breastfeeding newborns (%)
Reproductive Health - Women that had a hysterectomy (%)
Reproductive Health - Women that had both ovaries removed (%)
Reproductive Health - Women that have ever taken birth control pills (%)
Reproductive Health - Women taking birth control pills (%)
Reproductive Health - Women that have ever used Depo-Provera or injectables (%)
Reproductive Health - Women that have ever used female hormones (%)
Sexual Behavior - People 18+ that ever had sex (vaginal, anal, or oral) (%)
Sexual Behavior - Males 18+ that ever had vaginal sex with a woman (%)
Sexual Behavior - Males 18+ that ever performed oral sex on a woman (%)
Sexual Behavior - Males 18+ that ever had anal sex with a woman (%)
Sexual Behavior - Males 18+ that ever had any sex with a man (%)
Sexual Behavior - Females 18+ that ever had vaginal sex with a man (%)
Sexual Behavior - Females 18+ that ever performed oral sex on a man (%)
Sexual Behavior - Females 18+ that ever had anal sex with a man (%)
Sexual Behavior - Females 18+ that ever had any kind of sex with a woman (%)
Sexual Behavior - Average age people first had sex
Sexual Behavior - Average number of female sex partners in lifetime (males 18+)
Sexual Behavior - Average number of female vaginal sex partners in lifetime (males 18+)
Sexual Behavior - Average age people first performed oral sex on a woman (18+)
Sexual Behavior - Average number of woman performed oral sex on in lifetime (18+)
Sexual Behavior - Average number of male sex partners in lifetime (males 18+)
Sexual Behavior - Average number of male anal sex partners in lifetime (males 18+)
Sexual Behavior - Average age people first performed oral sex on a man (18+)
Sexual Behavior - Average number of male oral sex partners in lifetime (18+)
Sexual Behavior - People using protection when performing oral sex (%)
Sexual Behavior - Average number of times people have vaginal or anal sex a year
Sexual Behavior - People having sex without condom (%)
Sexual Behavior - Average number of male sex partners in lifetime (females 18+)
Sexual Behavior - Average number of male vaginal sex partners in lifetime (females 18+)
Sexual Behavior - Average number of female sex partners in lifetime (females 18+)
Sexual Behavior - Circumcised males 18+ (%)
Sleep Disorders - Average hours sleeping at night
Sleep Disorders - People that has trouble sleeping (%)
Smoking-Cigarette Use - People smoking cigarettes (%)
Taste & Smell - People 40+ having problems with smell (%)
Taste & Smell - People 40+ having problems with taste (%)
Taste & Smell - People 40+ that ever had wisdom teeth removed (%)
Taste & Smell - People 40+ that ever had tonsils teeth removed (%)
Taste & Smell - People 40+ that ever had a loss of consciousness because of a head injury (%)
Taste & Smell - People 40+ that ever had a broken nose or other serious injury to face or skull (%)
Taste & Smell - People 40+ that ever had two or more sinus infections (%)
Weight - Average height (inches)
Weight - Average weight (pounds)
Weight - Average BMI
Weight - People that are obese (%)
Weight - People that ever were obese (%)
Weight - People trying to lose weight (%)
100%
urban population.
Estimated median house/condo value in 2022: $94,483
38105:
$94,483Tennessee:
$284,800
Median resident age: This zip code:
43.4 yearsTennessee median age:
39.2 years
Average household size: This zip code:
1.5 peopleTennessee:
2.4 people
Averages for the 2020 tax year for zip code 38105, filed in 2021:
Average Adjusted Gross Income (AGI) in 2020: $29,073 (Individual Income Tax Returns) Here:
$29,073State:
$69,014
Salary/wage: $28,914 (reported on 88.0% of returns )Here:
$28,914State:
$55,872
(% of AGI for various income ranges: 1200.3% for AGIs below $25k , 3830.5% for AGIs $25k-50k , 8427.9% for AGIs $50k-75k , 9786.0% for AGIs $75k-100k , 22593.3% for AGIs $100k-200k ) Taxable interest for individuals: $176 (reported on 7.3% of returns )This zip code:
$176Tennessee:
$1,945
(% of AGI for various income ranges: 0.3% for AGIs below $25k , 1.7% for AGIs $25k-50k , 4.3% for AGIs $50k-75k , 36.7% for AGIs $100k-200k ) Ordinary dividends: $283 (reported on 2.6% of returns )(% of AGI for various income ranges: 1.5% for AGIs $25k-50k , 16.0% for AGIs $75k-100k ) Net capital gain/loss in AGI: +$3,750 (reported on 3.4% of returns )Here:
+$3,750State:
+$33,664
(% of AGI for various income ranges: 4.1% for AGIs $25k-50k , 552.0% for AGIs $75k-100k ) Profit/loss from business: +$2,210 (reported on 21.9% of returns )Here:
+$2,210State:
+$18,991
(% of AGI for various income ranges: 96.9% for AGIs below $25k , 460.0% for AGIs $75k-100k ) Total itemized deductions: $30,117 (reported on 2.6% of returns )Here:
$30,117State:
$40,136
(% of AGI for various income ranges: 143.4% for AGIs $25k-50k , 686.4% for AGIs $50k-75k ) Charity contributions: $9,833 (reported on 2.6% of returns )(% of AGI for various income ranges: 44.1% for AGIs $25k-50k , 235.7% for AGIs $50k-75k ) Taxes paid: $4,833 (reported on 2.6% of returns )(% of AGI for various income ranges: 19.5% for AGIs $25k-50k , 125.0% for AGIs $50k-75k ) Earned income credit: $2,644 (reported on 38.6% of returns )(% of AGI for various income ranges: 173.5% for AGIs below $25k , 80.0% for AGIs $25k-50k ) Percentage of individuals using paid preparers for their 2020 taxes: 91.0%(% for various income ranges: 91.4% for AGIs below $25k , 93.0% for AGIs $25k-50k , 85.7% for AGIs $50k-75k , 85.7% for AGIs $75k-100k , 83.3% for AGIs $100k-200k )
Averages for the 2012 tax year for zip code 38105, filed in 2013:
Average Adjusted Gross Income (AGI) in 2012: $23,470 (Individual Income Tax Returns) Here:
$23,470State:
$53,767
Salary/wage: $23,444 (reported on 88.9% of returns )Here:
$23,444State:
$45,421
(% of AGI for various income ranges: 83.3% for AGIs below $25k , 95.9% for AGIs $25k-50k , 94.2% for AGIs $50k-75k , 80.3% for AGIs $75k-100k , 75.9% for AGIs $100k-200k ) Taxable interest for individuals: $129 (reported on 5.4% of returns )This zip code:
$129Tennessee:
$1,732
(% of AGI for various income ranges: ) Ordinary dividends: $367 (reported on 1.1% of returns )Profit/loss from business: +$5,923 (reported on 19.9% of returns )Here:
+$5,923State:
+$15,240
(% of AGI for various income ranges: 11.3% for AGIs below $25k , 0.7% for AGIs $25k-50k , 2.7% for AGIs $50k-75k ) Taxable individual retirement arrangement distribution: $6,967 (reported on 1.1% of returns )38105:
$6,967Tennessee:
$15,505
Total itemized deductions: $16,714 (33% of AGI, reported on 8.0% of returns )Here:
$16,714State:
$21,976
Here:
32.7% of AGIState:
17.8% of AGI
(% of AGI for various income ranges: 2.0% for AGIs below $25k , 6.1% for AGIs $25k-50k , 8.2% for AGIs $50k-75k , 25.7% for AGIs $75k-100k ) Charity contributions: $4,967 (reported on 6.9% of returns )(% of AGI for various income ranges: 0.4% for AGIs below $25k , 1.7% for AGIs $25k-50k , 2.4% for AGIs $50k-75k , 6.0% for AGIs $75k-100k ) Taxes paid: $2,780 (reported on 7.7% of returns )(% of AGI for various income ranges: 0.2% for AGIs below $25k , 1.0% for AGIs $25k-50k , 1.6% for AGIs $50k-75k , 3.8% for AGIs $75k-100k ) Earned income credit: $2,897 (reported on 48.7% of returns )(% of AGI for various income ranges: 14.3% for AGIs below $25k , 1.3% for AGIs $25k-50k ) Percentage of individuals using paid preparers for their 2012 taxes: 48.3%(% for various income ranges: 51.7% for AGIs below $25k , 41.9% for AGIs $25k-50k , 37.5% for AGIs $50k-75k , 75.0% for AGIs $75k-100k )
Averages for the 2004 tax year for zip code 38105, filed in 2005:
Average Adjusted Gross Income (AGI) in 2004: $18,226 (Individual Income Tax Returns) Here:
$18,226State:
$44,088
Salary/wage: $18,527 (reported on 91.4% of returns )Here:
$18,527State:
$38,825
(% of AGI for various income ranges: 90.0% for AGIs below $10k , 92.7% for AGIs $10k-25k , 95.7% for AGIs $25k-50k , 92.9% for AGIs $50k-75k , 88.1% for AGIs $75k-100k , 76.3% for AGIs over 100k ) Taxable interest for individuals: $383 (reported on 5.7% of returns )This zip code:
$383Tennessee:
$1,802
(% of AGI for various income ranges: 0.1% for AGIs below $10k , 0.1% for AGIs $10k-25k , 0.2% for AGIs $25k-50k , 0.1% for AGIs $50k-75k ) Taxable dividends: $433 (reported on 1.2% of returns )Net capital gain/loss: +$1,520 (reported on 1.0% of returns )Here:
+$1,520State:
+$15,776
Profit/loss from business: +$4,522 (reported on 10.7% of returns )Here:
+$4,522State:
+$12,882
Total itemized deductions: $13,570 (34% of AGI, reported on 7.7% of returns )Here:
$13,570State:
$18,035
Here:
33.8% of AGIState:
19.9% of AGI
(% of AGI for various income ranges: 1.4% for AGIs below $10k , 2.3% for AGIs $10k-25k , 6.6% for AGIs $25k-50k , 12.3% for AGIs $50k-75k , 29.4% for AGIs $75k-100k ) Charity contributions deductions: $4,928 (11% of AGI, reported on 5.9% of returns )Here:
10.9% of AGIState:
5.3% of AGI
(% of AGI for various income ranges: 0.4% for AGIs $10k-25k , 2.1% for AGIs $25k-50k , 3.4% for AGIs $50k-75k , 8.5% for AGIs $75k-100k ) Total tax: $2,126 (reported on 46.5% of returns )(% of AGI for various income ranges: 2.7% for AGIs below $10k , 2.7% for AGIs $10k-25k , 6.3% for AGIs $25k-50k , 9.9% for AGIs $50k-75k , 12.2% for AGIs $75k-100k , 15.8% for AGIs over 100k ) Earned income credit: $2,197 (reported on 55.6% of returns )Percentage of individuals using paid preparers for their 2004 taxes: 60.5%(% for various income ranges: 58.4% for AGIs below $10k , 69.1% for AGIs $10k-25k , 47.2% for AGIs $25k-50k , 48.8% for AGIs $50k-75k , 76.2% for AGIs $75k-100k )
Estimated median household income in 2022: This zip code:
$26,750Tennessee:
$65,254
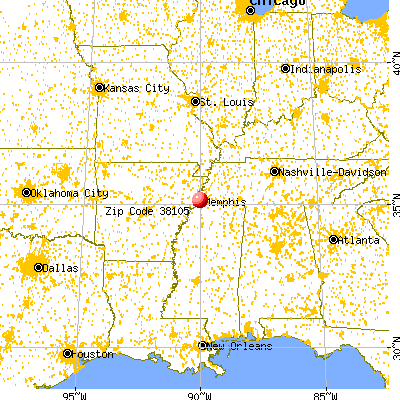
Nearest zip codes: 38103 ,
38107 ,
38126 ,
38104 ,
38112 ,
38108 .
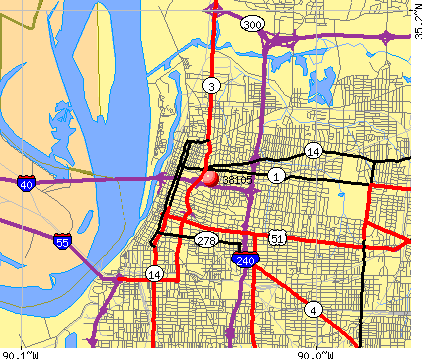
Memphis Zip Code Map
Percentage of family households: This zip code:
23.9%Tennessee:
46.2%
Percentage of households with unmarried partners: This zip code:
5.7%Tennessee:
47.1%
Likely homosexual households (counted as self-reported same-sex unmarried-partner households)
Lesbian couples: 0.9% of all households Gay men: 0.2% of all households
Household received Food Stamps/SNAP in the past 12 months: 960Household did not receive Food Stamps/SNAP in the past 12 months: 2,397
Women who had a birth in the past 12 months: 115 (10 now married , 101 unmarried) Women who did not have a birth in the past 12 months: 1,433 (179 now married , 1,253 unmarried)
Housing units in zip code 38105 with a mortgage: 221
Median monthly owner costs for units with a mortgage: $1,167
Median monthly owner costs for units without a mortgage: $456
Residents with income below the poverty level in 2022:
This zip code:
31.2%Whole state:
13.3%
Residents with income below 50% of the poverty level in 2022:
This zip code:
14.9%Whole state:
7.1%
Median number of rooms in houses and condos: Median number of rooms in apartments: Notable locations in this zip code not listed on our city pages
Click to draw/clear zip code borders Notable locations in zip code 38105: (A) , Memphis Humane Shelter (B) , Greenlaw Community Center (C) , City of Memphis Division of Fire Station 1 (D) . Display/hide their locations on the map
Shopping Center: (1) . Display/hide its location on the map
Churches in zip code 38105 include: (A) , Burning Bush Missionary Baptist Church (B) , Columbus Baptist Church (C) , Emmanuel Baptist Church (D) , First Baptist Church Chelsea (E) , First Presbyterian Church (F) , First United Methodist Church (G) , Friendship Church of the Nazarene (H) , Greater Calvary Baptist Church (I) . Display/hide their locations on the map
Streams, rivers, and creeks: (A) , Bayou Gayoso (B) . Display/hide their locations on the map
Parks in zip code 38105 include: (1) , Brinkley Park (2) , Morris Park (3) , Winchester Park (4) , Malone Park (5) . Display/hide their locations on the map
Tourist attractions (not listed on the city page) :
Year house built (houses)
18 2020 or later512 2010 to 2019485 2000 to 2009219 1990 to 1999222 1980 to 1989430 1970 to 1979677 1960 to 1969620 1950 to 1959187 1940 to 1949718 1939 or earlier
Zip code 38105 household income distribution in 2022 615 Less than $10,000350 $10,000 to $14,999343 $15,000 to $19,999323 $20,000 to $24,999111 $25,000 to $29,999135 $30,000 to $34,999148 $35,000 to $39,999136 $40,000 to $44,999132 $45,000 to $49,999242 $50,000 to $59,999262 $60,000 to $74,999335 $75,000 to $99,999107 $100,000 to $124,99935 $125,000 to $149,99916 $150,000 to $199,99933 $200,000 or moreEstimate of home value of owner-occupied houses/condos in 2022 in zip code 38105 5 Less than $10,00021 $40,000 to $49,99919 $50,000 to $59,99926 $60,000 to $69,999103 $70,000 to $79,99929 $80,000 to $89,9993 $90,000 to $99,99930 $100,000 to $124,9994 $125,000 to $149,9997 $150,000 to $174,9995 $200,000 to $249,99915 $250,000 to $299,9997 $300,000 to $399,99913 $2,000,000 or moreRent paid by renters in 2022 in zip code 38105 67 Less than $10071 $150 to $199108 $200 to $249103 $250 to $299101 $300 to $34910 $350 to $39988 $400 to $44990 $450 to $499194 $500 to $549116 $550 to $599209 $600 to $649104 $650 to $699162 $700 to $749118 $750 to $799397 $800 to $899280 $900 to $999462 $1,000 to $1,24951 $1,250 to $1,49997 $1,500 to $1,99935 No cash rent
Median gross rent in 2022: $931.
Median price asked for vacant for-sale houses and condos in 2022: $112,188.
Estimated median house (or condo) value in 2022 for: White Non-Hispanic householders: $120,269Black or African American householders: $87,555Asian householders: $312,699Two or more races householders: $43,296Estimated median house or condo value in 2022: $94,483
38105:
$94,483Tennessee:
$284,800
Lower value quartile - upper value quartile: $81,601 - $124,638
Mean price in 2022: Detached houses: $260,126Here:
$260,126State:
$374,382
Townhouses or other attached units: $293,298Here:
$293,298State:
$354,101
In 2-unit structures: $261,499Here:
$261,499State:
$247,693
In 3-to-4-unit structures: $101,791Here:
$101,791State:
$239,060
In 5-or-more-unit structures: $229,265Here:
$229,265State:
$317,434
Mobile homes: $169,958Here:
$169,958State:
$101,421
Occupied boats, RVs, vans, etc.: $194,150Here:
$194,150State:
$142,822
Housing units in structures:
One, detached: 751One, attached: 220Two: 1583 or 4: 3865 to 9: 73510 to 19: 28720 to 49: 37150 or more: 1,393Mobile homes: 8Boats, RVs, vans, etc.: 26Unemployment : 7.1%
Means of transportation to work in zip code 38105 65.4% 1,799 Drove a car alone10.3% 282 Carpooled5.7% 157 Bus or trolley bus9.9% 271 Walked5.4% 148 Worked at homeTravel time to work (commute) in zip code 38105 89 Less than 5 minutes314 5 to 9 minutes397 10 to 14 minutes371 15 to 19 minutes469 20 to 24 minutes205 25 to 29 minutes361 30 to 34 minutes97 35 to 39 minutes47 40 to 44 minutes87 45 to 59 minutes84 60 to 89 minutes10 90 or more minutes
Neighborhoods in zip code 38105: Percentage of zip code residents living and working in this county: 93.2%
Household type by relationship:
Households: 5,311
Male householders: 1,355 (1,045 living alone ), Female householders: 2,040 (1,153 living alone )375 spouses (367 opposite-sex spouses ), 142 unmarried partners , (83 opposite-sex unmarried partners ), 760 children (725 natural , 19 adopted , 17 stepchildren ), 207 grandchildren , 59 brothers or sisters , 6 parents , 0 foster children , 198 other relatives , 75 non-relatives In group quarters: 172 (-1 institutionalized population )
Size of family households: 727 2-persons , 181 3-persons , 53 4-persons , 36 5-persons , 10 6-persons , 10 7-or-more-persons
Size of nonfamily households: 2,197 1-person , 154 2-persons
33 married couples with children. single-parent households (373 women ).
93.1% of residents of 38105 zip code speak English at home. of residents speak Spanish at home (38% very well, 39% well, 22% not well ).of residents speak other Indo-European language at home (81% very well, 13% well, 6% not well ).of residents speak Asian or Pacific Island language at home (10% very well, 79% well, 10% not well ).of residents speak other language at home (45% very well, 55% well ).
Foreign born population: 369 (7.0%)
(14.3%
of them are naturalized citizens )
This zip code:
7.0%Whole state:
5.6%
17% Eritrea 13% Honduras 8% Afghanistan 8% Malaysia 8% Bolivia 7% Cabo Verde 3% Mexico 3% African 3% American 2% English 2% European 1% Irish 1% Scotch-Irish 1% German
Year of entry for the foreign-born population
219 2010 or later 74 2000 to 2009 72 1990 to 1999 21 Before 1990
There are
71 Pediatrics 238 Other Medical Specialists in Zip Code 38105.
Major facilities with environmental interests located in this zip code:
AUTO-CHLOR SYSTEM (745 POPLAR AVE in MEMPHIS, TN)
COMPLIANCE ACTIVITY (Tracking inspections of insecticide, fungicide, and rodenticide, and toxic substances) STATE MASTER (New Jersey environmental info) - NJEMS-002786, PESTICIDES - MANUFACTURE (Resource Conservation and Recovery Act (tracking hazardous waste)) Business NAICS classification: ALL OTHER MISCELLANEOUS FABRICATED METAL PRODUCT MANUFACTURING.Organizations: JOHNSON DIVERSEY INC, AUTO CHLOR SYSTEMAlternative names: AUTO-CHLOR SYTEM (MEMPHIS)
CARNES ELEMENTARY SCHOOL (943 J W WILLIAMS LA in MEMPHIS, TN)
(National Center for Education Statistics) - STATE ID-0075 Organizations: MEMPHIS CITY SCHOOL DISTRICT (SCHOOL DISTRICT)
AMERICAN LEBANESE SYRIAN ASSOC CHARITIES (581 AUCTION in MEMPHIS, TN)
Large Quantity Generators, more that 1000 kg of hazardous waste/month (Resource Conservation and Recovery Act (tracking hazardous waste)) Organizations: PHILIP DOWNING (CONTACT/OPERATOR)
Alternative names: SPIC N SPAN CLEANERS
A & L AGRICULTURAL LAGS OF MEMPHIS INC (411 N 3RD ST in MEMPHIS, TN)
(Resource Conservation and Recovery Act (tracking hazardous waste))
AARTAN PRINTING CO INC (625 POPLAR in MEMPHIS, TN)
(Resource Conservation and Recovery Act (tracking hazardous waste))
ALPHA THERAPEUTIC CORPORATION (623 JEFFERSON AVENUE in MEMPHIS, TN)
(Resource Conservation and Recovery Act (tracking hazardous waste))
AMOCO OIL SS# 767 (821 POPLAR AVE in MEMPHIS, TN)
(Resource Conservation and Recovery Act (tracking hazardous waste)) Business NAICS classification: OTHER FUEL DEALERS.; ALL OTHER AUTOMOTIVE REPAIR AND MAINTENANCE.
AUSTIN HENNON BINDERY INC. (570 LANE AVE in MEMPHIS, TN)
(Resource Conservation and Recovery Act (tracking hazardous waste)) Business NAICS classification: TRADEBINDING AND RELATED WORK.
BRUNNER, INC (567 N. PARKWAY in MEMPHIS, TN)
(Resource Conservation and Recovery Act (tracking hazardous waste)) Business NAICS classification: COMMERCIAL LITHOGRAPHIC PRINTING.
COX PRINTING CO (467 N WALDRAN BLVD in MEMPHIS, TN)
(Resource Conservation and Recovery Act (tracking hazardous waste))
CUSTOM CRAFT FURNITURE CO* (750 GALLOWAY in MEMPHIS, TN)
(Resource Conservation and Recovery Act (tracking hazardous waste)) Business NAICS classification: UPHOLSTERED HOUSEHOLD FURNITURE MANUFACTURING.
DRAKE CORPORATION (440 NORTH FRONT STREET in MEMPHIS, TN)
(Resource Conservation and Recovery Act (tracking hazardous waste)) Business NAICS classification: SAW BLADE AND HANDSAW MANUFACTURING.
CITY OF MEMPHIS/SIGNS AND MARKINGS (435 MANASSAS in MEMPHIS, TN)
Small Quantity Generators, between 100 kg and 1000 kg of hazardous waste/month (Resource Conservation and Recovery Act (tracking hazardous waste)) - notification Organizations: CITY OF MEMPHIS GOVERNMENT (CONTACT/OWNER)
Housing units lacking complete plumbing facilities: 6.1%
Housing units lacking complete kitchen facilities: 6.8%
73.7% Electricity 22.9% Utility gas 2.2% No fuel used 0.8% Bottled, tank, or LP gas
Population in 1990: 11,143.
Place of birth for U.S.-born residents:
This state: 3,429Northeast: 187Midwest: 388South: 825West: 84
47% of the 38105 zip code residents lived in the same house 5 years ago.
Out of people who lived in different houses, 72% lived in this county.
Out of people who lived in different counties, 50% lived in Tennessee.
87% of the 38105 zip code residents lived in the same house 1 year ago.
Out of people who lived in different houses, 57% moved from this county.
Out of people who lived in different houses, 22% moved from different county within same state.
Out of people who lived in different houses, 13% moved from different state.
Out of people who lived in different houses, 6% moved from abroad.
Private vs. public school enrollment:
Students in private schools in grades 1 to 8 (elementary and middle school): 1
Students in private schools in grades 9 to 12 (high school): 1
Students in private undergraduate colleges: 62
Here:
36.5%Tennessee:
23.5%
Occupation by median earnings in the past 12 months ($)
65,799 Life, physical, and social science occupations 59,067 Management occupations 55,117 Health diagnosing and treating practitioners and other technical occupations 54,628 Health technologists and technicians 47,862 Community and social service occupations 43,531 Construction and extraction occupations
Companies with federal contracts located in this zip code:
WYNDHAM INTERNATIONAL, INC (300 N 2ND ST in MEMPHIS, TN) in 2 contracts from 2005 to 2006
$15,954 with Drug Enforcement Administration for Training/Curriculum Development. Taking place in VA. Signed on 2005-06-16. Effective on 2005-08-07. Completion date: 2005-08-12.
with Army for Lodging - Hotel/Motel. Signed on 2006-06-12. Completion date: 2006-07-21.
Top industries in this zip code by the number of employees in 2005:
Health Care and Social Assistance: General Medical and Surgical Hospitals (over 1000 employees: 1 establishment)Health Care and Social Assistance: All Other Outpatient Care Centers (500-999: 1)Health Care and Social Assistance: Psychiatric and Substance Abuse Hospitals (250-499: 1, 50-99: 1)Other Services (except Public Administration): Voluntary Health Organizations (250-499: 1)Other Services (except Public Administration): Religious Organizations (20-49: 2, 10-19: 2, 5-9: 5, 1-4: 4)Accommodation and Food Services: Limited-Service Restaurants (20-49: 3, 10-19: 1, 5-9: 1, 1-4: 2)Accommodation and Food Services: Full-Service Restaurants (50-99: 1, 20-49: 1, 5-9: 2, 1-4: 1)Health Care and Social Assistance: Offices of Physicians (except Mental Health Specialists) (10-19: 4, 5-9: 2, 1-4: 6)Administrative and Support and Waste Management and Remediation Services: Security Guards and Patrol Services (50-99: 1)Wholesale Trade: Recyclable Material Merchant Wholesalers (50-99: 1)
People in group quarters in 2010:
269 people in other noninstitutional facilities
136 people in emergency and transitional shelters (with sleeping facilities) for people experiencing homelessness
28 people in residential treatment centers for adults
People in group quarters in 2000:
292 people in other noninstitutional group quarters
232 people in hospitals or wards for drug/alcohol abuse
168 people in college dormitories (includes college quarters off campus)
88 people in wards in general hospitals for patients who have no usual home elsewhere
75 people in mental (psychiatric) hospitals or wards
74 people in hospitals/wards and hospices for chronically ill
74 people in other hospitals or wards for chronically ill
33 people in homes or halfway houses for drug/alcohol abuse
32 people in nursing homes
21 people in homes for the mentally ill
10 people in other types of correctional institutions
10 people in training schools for juvenile delinquents
Fatal accident statistics in 2013:
Fatal accident count: 3Vehicles involved in fatal accidents: 4Fatal accidents caused by drunken drivers: 1Fatalities: 3Persons involved in fatal accidents: 4Pedestrians involved in fatal accidents: 0
Fatal accident statistics in 2010:
Fatal accident count: 2Vehicles involved in fatal accidents: 2Fatal accidents caused by drunken drivers: 1Fatalities: 2Persons involved in fatal accidents: 3Pedestrians involved in fatal accidents: 1
Home Mortgage Disclosure Act Aggregated Statistics For Year 2009(Based on 6 full and 6 partial tracts) A) FHA, FSA/RHS & VA B) Conventional C) Refinancings D) Home Improvement Loans E) Loans on Dwellings For 5+ Families F) Non-occupant Loans on Number Average Value Number Average Value Number Average Value Number Average Value Number Average Value Number Average Value
LOANS ORIGINATED 9 $134,717 10 $159,201 17 $126,100 1 $39,370 2 $38,220 6 $112,232 APPLICATIONS APPROVED, NOT ACCEPTED 0 $0 0 $0 2 $97,860 0 $0 0 $0 0 $0 APPLICATIONS DENIED 7 $104,526 8 $162,881 29 $77,701 11 $23,137 0 $0 7 $56,127 APPLICATIONS WITHDRAWN 1 $153,650 1 $136,900 7 $98,779 0 $0 0 $0 0 $0 FILES CLOSED FOR INCOMPLETENESS 0 $0 0 $0 0 $0 2 $24,405 0 $0 2 $24,405
Aggregated Statistics For Year 2008(Based on 6 full and 8 partial tracts) A) FHA, FSA/RHS & VA B) Conventional C) Refinancings D) Home Improvement Loans E) Loans on Dwellings For 5+ Families F) Non-occupant Loans on G) Loans On Manufactured Number Average Value Number Average Value Number Average Value Number Average Value Number Average Value Number Average Value Number Average Value
LOANS ORIGINATED 11 $80,476 35 $133,650 26 $90,000 3 $39,317 6 $136,345 31 $89,474 0 $0 APPLICATIONS APPROVED, NOT ACCEPTED 0 $0 5 $146,236 9 $71,519 0 $0 0 $0 3 $69,563 1 $88,920 APPLICATIONS DENIED 0 $0 12 $149,748 45 $85,099 15 $24,855 0 $0 18 $69,447 0 $0 APPLICATIONS WITHDRAWN 1 $118,640 7 $106,161 13 $95,413 2 $39,045 0 $0 8 $103,800 0 $0 FILES CLOSED FOR INCOMPLETENESS 0 $0 2 $380,000 4 $39,932 0 $0 0 $0 3 $36,880 0 $0
Aggregated Statistics For Year 2007(Based on 6 full and 6 partial tracts) A) FHA, FSA/RHS & VA B) Conventional C) Refinancings D) Home Improvement Loans E) Loans on Dwellings For 5+ Families F) Non-occupant Loans on G) Loans On Manufactured Number Average Value Number Average Value Number Average Value Number Average Value Number Average Value Number Average Value Number Average Value
LOANS ORIGINATED 11 $109,498 75 $94,021 37 $76,370 9 $44,096 2 $610,000 49 $79,431 0 $0 APPLICATIONS APPROVED, NOT ACCEPTED 2 $27,330 21 $87,687 13 $87,259 1 $9,260 2 $112,250 10 $56,406 2 $27,330 APPLICATIONS DENIED 1 $142,330 57 $88,200 97 $84,988 13 $64,131 2 $154,225 38 $67,416 1 $90,700 APPLICATIONS WITHDRAWN 0 $0 12 $101,663 29 $75,133 0 $0 0 $0 11 $70,212 0 $0 FILES CLOSED FOR INCOMPLETENESS 0 $0 3 $104,120 8 $91,780 0 $0 0 $0 1 $102,350 0 $0
Aggregated Statistics For Year 2006(Based on 6 full and 8 partial tracts) A) FHA, FSA/RHS & VA B) Conventional C) Refinancings D) Home Improvement Loans E) Loans on Dwellings For 5+ Families F) Non-occupant Loans on Number Average Value Number Average Value Number Average Value Number Average Value Number Average Value Number Average Value
LOANS ORIGINATED 30 $98,956 71 $86,750 65 $66,730 11 $52,277 3 $78,323 59 $64,755 APPLICATIONS APPROVED, NOT ACCEPTED 0 $0 23 $64,310 23 $63,151 0 $0 0 $0 27 $65,407 APPLICATIONS DENIED 0 $0 64 $67,811 114 $86,223 23 $33,192 2 $580,000 57 $73,231 APPLICATIONS WITHDRAWN 3 $75,797 25 $73,455 40 $98,251 2 $57,590 0 $0 16 $125,508 FILES CLOSED FOR INCOMPLETENESS 0 $0 19 $77,248 8 $91,180 0 $0 0 $0 14 $40,489
Aggregated Statistics For Year 2005(Based on 6 full and 8 partial tracts) A) FHA, FSA/RHS & VA B) Conventional C) Refinancings D) Home Improvement Loans E) Loans on Dwellings For 5+ Families F) Non-occupant Loans on G) Loans On Manufactured Number Average Value Number Average Value Number Average Value Number Average Value Number Average Value Number Average Value Number Average Value
LOANS ORIGINATED 19 $88,661 99 $79,581 72 $78,155 13 $52,840 11 $889,098 52 $68,624 0 $0 APPLICATIONS APPROVED, NOT ACCEPTED 0 $0 29 $73,002 23 $91,767 0 $0 0 $0 23 $64,301 2 $45,970 APPLICATIONS DENIED 5 $57,004 51 $69,321 110 $85,385 19 $71,984 2 $1,014,690 39 $66,971 0 $0 APPLICATIONS WITHDRAWN 7 $89,996 58 $90,953 49 $81,498 6 $81,052 0 $0 13 $82,232 0 $0 FILES CLOSED FOR INCOMPLETENESS 0 $0 5 $109,182 11 $81,372 0 $0 0 $0 1 $116,570 0 $0
Aggregated Statistics For Year 2004(Based on 6 full and 8 partial tracts) A) FHA, FSA/RHS & VA B) Conventional C) Refinancings D) Home Improvement Loans E) Loans on Dwellings For 5+ Families F) Non-occupant Loans on G) Loans On Manufactured Number Average Value Number Average Value Number Average Value Number Average Value Number Average Value Number Average Value Number Average Value
LOANS ORIGINATED 6 $61,263 56 $86,956 76 $76,010 8 $38,452 2 $449,825 52 $66,531 0 $0 APPLICATIONS APPROVED, NOT ACCEPTED 0 $0 18 $70,250 32 $69,915 0 $0 0 $0 15 $71,761 0 $0 APPLICATIONS DENIED 2 $59,540 34 $67,135 100 $69,354 14 $33,028 0 $0 27 $57,926 4 $31,078 APPLICATIONS WITHDRAWN 0 $0 16 $60,996 41 $80,565 2 $70,510 0 $0 8 $55,302 0 $0 FILES CLOSED FOR INCOMPLETENESS 0 $0 4 $81,455 16 $69,529 0 $0 0 $0 1 $69,090 0 $0
Aggregated Statistics For Year 2003(Based on 6 full and 8 partial tracts) A) FHA, FSA/RHS & VA B) Conventional C) Refinancings D) Home Improvement Loans E) Loans on Dwellings For 5+ Families F) Non-occupant Loans on Number Average Value Number Average Value Number Average Value Number Average Value Number Average Value Number Average Value
LOANS ORIGINATED 2 $60,520 37 $88,922 85 $75,309 4 $25,752 7 $109,733 33 $57,728 APPLICATIONS APPROVED, NOT ACCEPTED 1 $55,970 6 $65,265 35 $62,592 0 $0 0 $0 11 $61,799 APPLICATIONS DENIED 4 $61,830 29 $74,131 94 $53,411 7 $27,176 0 $0 12 $52,602 APPLICATIONS WITHDRAWN 0 $0 7 $111,461 30 $70,127 2 $3,920 0 $0 2 $69,715 FILES CLOSED FOR INCOMPLETENESS 0 $0 0 $0 12 $48,752 0 $0 0 $0 0 $0
Aggregated Statistics For Year 2002(Based on 6 full and 8 partial tracts) A) FHA, FSA/RHS & VA B) Conventional C) Refinancings D) Home Improvement Loans E) Loans on Dwellings For 5+ Families F) Non-occupant Loans on Number Average Value Number Average Value Number Average Value Number Average Value Number Average Value Number Average Value
LOANS ORIGINATED 10 $86,653 29 $80,647 70 $75,708 5 $23,710 5 $1,522,504 44 $49,050 APPLICATIONS APPROVED, NOT ACCEPTED 2 $89,000 12 $67,337 26 $59,022 1 $5,790 0 $0 9 $54,746 APPLICATIONS DENIED 4 $48,990 19 $57,648 107 $60,469 2 $5,850 1 $582,790 14 $54,989 APPLICATIONS WITHDRAWN 4 $39,855 11 $50,828 49 $77,490 0 $0 1 $627,620 6 $44,365 FILES CLOSED FOR INCOMPLETENESS 0 $0 0 $0 13 $71,664 0 $0 0 $0 1 $52,500
Aggregated Statistics For Year 2001(Based on 6 full and 8 partial tracts) A) FHA, FSA/RHS & VA B) Conventional C) Refinancings D) Home Improvement Loans E) Loans on Dwellings For 5+ Families F) Non-occupant Loans on Number Average Value Number Average Value Number Average Value Number Average Value Number Average Value Number Average Value
LOANS ORIGINATED 16 $70,876 36 $89,334 77 $71,392 19 $7,303 0 $0 39 $49,022 APPLICATIONS APPROVED, NOT ACCEPTED 0 $0 9 $120,083 24 $47,476 2 $36,935 1 $96,800 9 $49,954 APPLICATIONS DENIED 6 $66,893 24 $65,002 99 $45,317 25 $14,468 0 $0 17 $51,772 APPLICATIONS WITHDRAWN 1 $56,740 15 $60,413 42 $49,723 7 $36,040 0 $0 4 $33,762 FILES CLOSED FOR INCOMPLETENESS 0 $0 2 $77,570 7 $65,510 0 $0 0 $0 2 $51,735
Aggregated Statistics For Year 2000(Based on 6 full and 8 partial tracts) A) FHA, FSA/RHS & VA B) Conventional C) Refinancings D) Home Improvement Loans E) Loans on Dwellings For 5+ Families F) Non-occupant Loans on Number Average Value Number Average Value Number Average Value Number Average Value Number Average Value Number Average Value
LOANS ORIGINATED 16 $81,780 43 $77,068 68 $60,075 17 $14,285 0 $0 30 $41,420 APPLICATIONS APPROVED, NOT ACCEPTED 0 $0 12 $71,349 17 $59,174 9 $14,946 2 $126,895 9 $79,289 APPLICATIONS DENIED 1 $130,470 55 $54,208 101 $53,709 42 $20,068 3 $2,291,883 13 $44,633 APPLICATIONS WITHDRAWN 3 $51,450 9 $155,881 27 $42,675 5 $12,720 0 $0 2 $53,260 FILES CLOSED FOR INCOMPLETENESS 0 $0 7 $83,079 13 $51,753 2 $7,390 0 $0 0 $0
Aggregated Statistics For Year 1999(Based on 3 full and 4 partial tracts) A) FHA, FSA/RHS & VA B) Conventional C) Refinancings D) Home Improvement Loans E) Loans on Dwellings For 5+ Families F) Non-occupant Loans on Number Average Value Number Average Value Number Average Value Number Average Value Number Average Value Number Average Value
LOANS ORIGINATED 5 $69,032 26 $62,860 37 $54,954 12 $12,955 3 $370,130 18 $37,239 APPLICATIONS APPROVED, NOT ACCEPTED 0 $0 8 $62,419 10 $43,548 2 $22,390 0 $0 3 $64,950 APPLICATIONS DENIED 3 $33,943 21 $56,263 65 $46,688 15 $11,121 0 $0 12 $46,288 APPLICATIONS WITHDRAWN 0 $0 10 $71,195 25 $47,276 2 $21,425 0 $0 3 $54,947 FILES CLOSED FOR INCOMPLETENESS 0 $0 3 $48,207 18 $38,608 0 $0 1 $99,090 3 $33,680
Private Mortgage Insurance Companies Aggregated Statistics For Year 2009(Based on 2 full and 2 partial tracts) A) Conventional Number Average Value
LOANS ORIGINATED 2 $260,925 APPLICATIONS APPROVED, NOT ACCEPTED 2 $237,190 APPLICATIONS DENIED 0 $0 APPLICATIONS WITHDRAWN 0 $0 FILES CLOSED FOR INCOMPLETENESS 0 $0
Aggregated Statistics For Year 2008(Based on 2 full and 4 partial tracts) A) Conventional B) Refinancings C) Non-occupant Loans on Number Average Value Number Average Value Number Average Value
LOANS ORIGINATED 8 $112,294 2 $105,955 2 $141,685 APPLICATIONS APPROVED, NOT ACCEPTED 9 $82,149 0 $0 2 $60,410 APPLICATIONS DENIED 2 $237,190 0 $0 0 $0 APPLICATIONS WITHDRAWN 1 $64,850 0 $0 0 $0 FILES CLOSED FOR INCOMPLETENESS 0 $0 0 $0 0 $0
Aggregated Statistics For Year 2007(Based on 4 full and 6 partial tracts) A) Conventional B) Refinancings C) Non-occupant Loans on Number Average Value Number Average Value Number Average Value
LOANS ORIGINATED 31 $100,018 4 $88,360 7 $87,150 APPLICATIONS APPROVED, NOT ACCEPTED 8 $113,142 3 $76,313 3 $59,847 APPLICATIONS DENIED 0 $0 0 $0 0 $0 APPLICATIONS WITHDRAWN 4 $102,112 0 $0 0 $0 FILES CLOSED FOR INCOMPLETENESS 0 $0 0 $0 0 $0
Aggregated Statistics For Year 2006(Based on 4 full and 4 partial tracts) A) Conventional B) Refinancings C) Non-occupant Loans on Number Average Value Number Average Value Number Average Value
LOANS ORIGINATED 13 $106,991 4 $68,080 5 $63,736 APPLICATIONS APPROVED, NOT ACCEPTED 2 $78,780 0 $0 2 $52,920 APPLICATIONS DENIED 1 $74,880 0 $0 1 $74,880 APPLICATIONS WITHDRAWN 1 $175,240 0 $0 0 $0 FILES CLOSED FOR INCOMPLETENESS 0 $0 0 $0 0 $0
Aggregated Statistics For Year 2005(Based on 4 full and 4 partial tracts) A) Conventional B) Refinancings C) Non-occupant Loans on Number Average Value Number Average Value Number Average Value
LOANS ORIGINATED 7 $54,036 2 $72,180 3 $33,723 APPLICATIONS APPROVED, NOT ACCEPTED 0 $0 1 $93,410 0 $0 APPLICATIONS DENIED 0 $0 0 $0 0 $0 APPLICATIONS WITHDRAWN 1 $64,850 0 $0 0 $0 FILES CLOSED FOR INCOMPLETENESS 0 $0 0 $0 0 $0
Aggregated Statistics For Year 2004(Based on 4 full and 2 partial tracts) A) Conventional B) Refinancings C) Non-occupant Loans on Number Average Value Number Average Value Number Average Value
LOANS ORIGINATED 14 $74,194 1 $90,320 7 $63,011 APPLICATIONS APPROVED, NOT ACCEPTED 2 $61,800 1 $89,940 3 $65,260 APPLICATIONS DENIED 0 $0 0 $0 0 $0 APPLICATIONS WITHDRAWN 0 $0 1 $105,380 0 $0 FILES CLOSED FOR INCOMPLETENESS 2 $72,230 0 $0 2 $72,230
Aggregated Statistics For Year 2003(Based on 2 full and 6 partial tracts) A) Conventional B) Refinancings C) Non-occupant Loans on Number Average Value Number Average Value Number Average Value
LOANS ORIGINATED 7 $97,454 7 $132,594 2 $49,660 APPLICATIONS APPROVED, NOT ACCEPTED 3 $80,963 2 $87,620 3 $72,213 APPLICATIONS DENIED 0 $0 0 $0 0 $0 APPLICATIONS WITHDRAWN 0 $0 2 $54,660 0 $0 FILES CLOSED FOR INCOMPLETENESS 0 $0 0 $0 0 $0
Aggregated Statistics For Year 2002(Based on 2 full and 4 partial tracts) A) Conventional B) Refinancings C) Non-occupant Loans on Number Average Value Number Average Value Number Average Value
LOANS ORIGINATED 6 $118,393 9 $59,786 8 $50,015 APPLICATIONS APPROVED, NOT ACCEPTED 0 $0 2 $91,665 0 $0 APPLICATIONS DENIED 0 $0 0 $0 1 $59,440 APPLICATIONS WITHDRAWN 0 $0 0 $0 0 $0 FILES CLOSED FOR INCOMPLETENESS 0 $0 0 $0 1 $34,740
Aggregated Statistics For Year 2001(Based on 4 full and 4 partial tracts) A) Conventional B) Refinancings C) Non-occupant Loans on Number Average Value Number Average Value Number Average Value
LOANS ORIGINATED 9 $68,406 10 $98,759 10 $54,170 APPLICATIONS APPROVED, NOT ACCEPTED 0 $0 0 $0 0 $0 APPLICATIONS DENIED 0 $0 0 $0 0 $0 APPLICATIONS WITHDRAWN 0 $0 0 $0 0 $0 FILES CLOSED FOR INCOMPLETENESS 0 $0 0 $0 0 $0
Aggregated Statistics For Year 2000(Based on 2 full and 6 partial tracts) A) Conventional B) Refinancings C) Non-occupant Loans on Number Average Value Number Average Value Number Average Value
LOANS ORIGINATED 8 $91,450 6 $49,033 5 $45,956 APPLICATIONS APPROVED, NOT ACCEPTED 0 $0 0 $0 0 $0 APPLICATIONS DENIED 0 $0 0 $0 0 $0 APPLICATIONS WITHDRAWN 2 $48,805 1 $268,980 0 $0 FILES CLOSED FOR INCOMPLETENESS 0 $0 0 $0 0 $0
Aggregated Statistics For Year 1999(Based on 2 partial tracts) A) Conventional B) Refinancings Number Average Value Number Average Value
LOANS ORIGINATED 2 $140,255 1 $80,010 APPLICATIONS APPROVED, NOT ACCEPTED 0 $0 0 $0 APPLICATIONS DENIED 0 $0 0 $0 APPLICATIONS WITHDRAWN 0 $0 0 $0 FILES CLOSED FOR INCOMPLETENESS 0 $0 0 $0
2002 - 2018 National Fire Incident Reporting System (NFIRS) incidents See full 2006 National Fire Incident Reporting System statistics for zip code 38105, Tennessee
Most common first names in zip code 38105 among deceased individuals Name Count Lived (average)
Mary 128 75.2 years John 114 69.9 years Willie 110 72.5 years James 105 67.7 years Robert 90 70.2 years William 84 71.7 years Annie 69 77.5 years George 45 71.0 years Walter 36 69.0 years Charles 35 63.5 years
Most common last names in zip code 38105 among deceased individuals Last name Count Lived (average)
Williams 93 70.3 years Johnson 83 68.4 years Smith 79 73.7 years Jones 75 72.8 years Brown 60 72.4 years Davis 44 70.0 years Jackson 43 72.2 years Thomas 37 70.9 years Taylor 34 73.0 years Wilson 30 70.9 years
Businesses in zip code 38105
Name Count Name Count
Church's Chicken 1 KFC 1 FedEx 5 Starbucks 1 H&R Block 1 Subway 1 Holiday Inn 1 U-Haul 1


 Nearest zip codes: 38103, 38107, 38126, 38104, 38112, 38108.
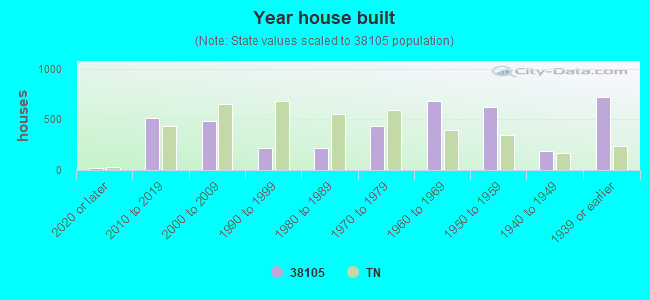

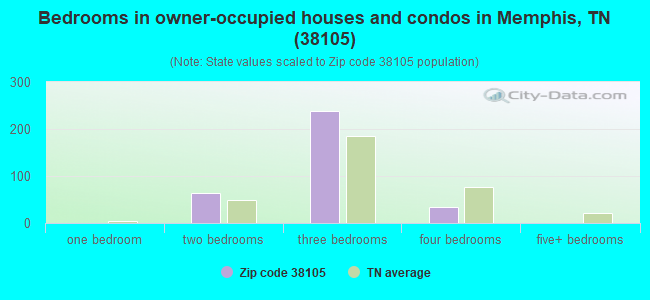
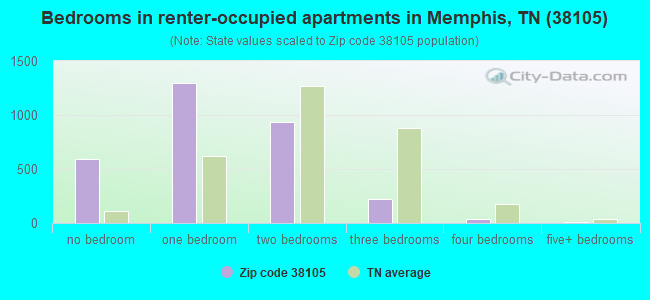
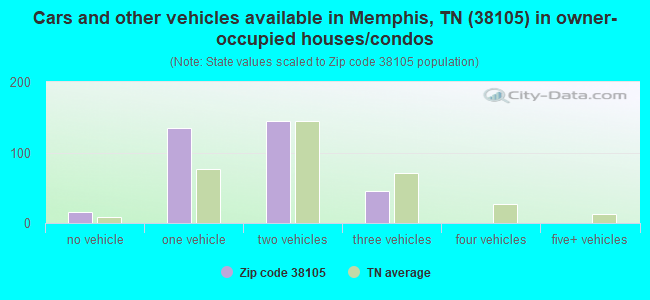
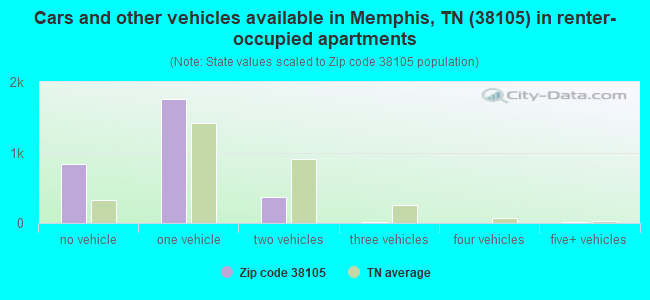


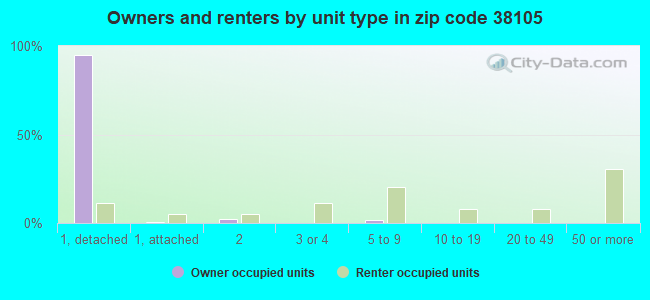


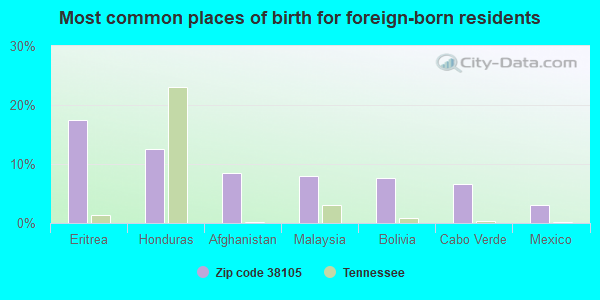
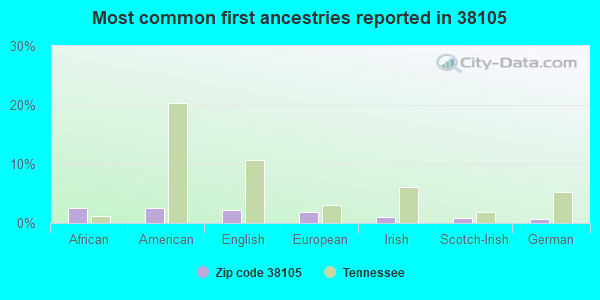
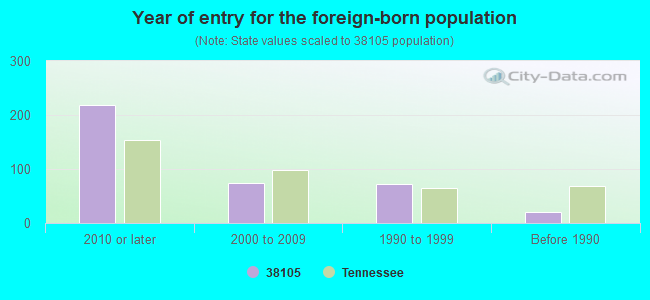


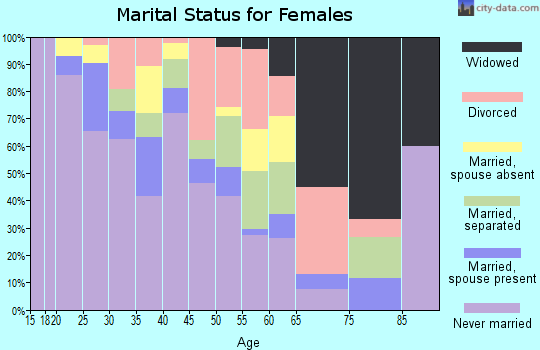
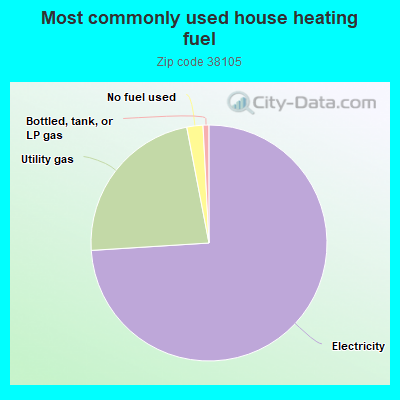
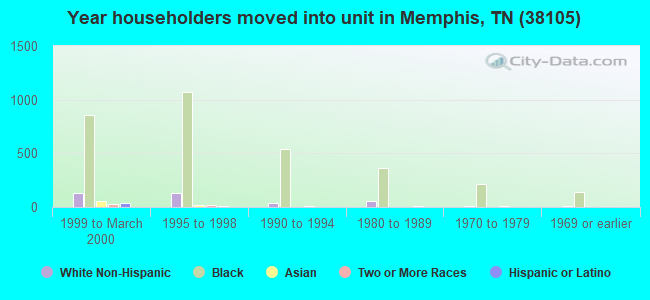
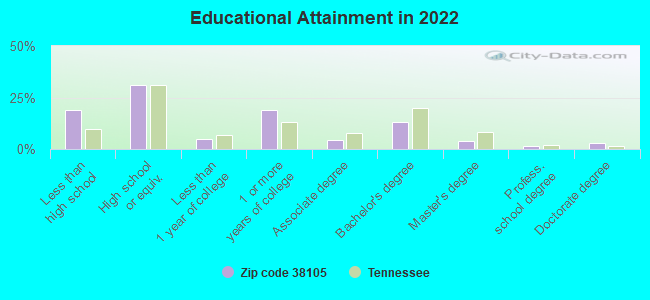
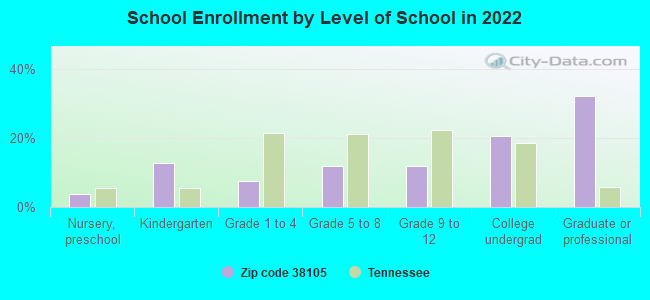
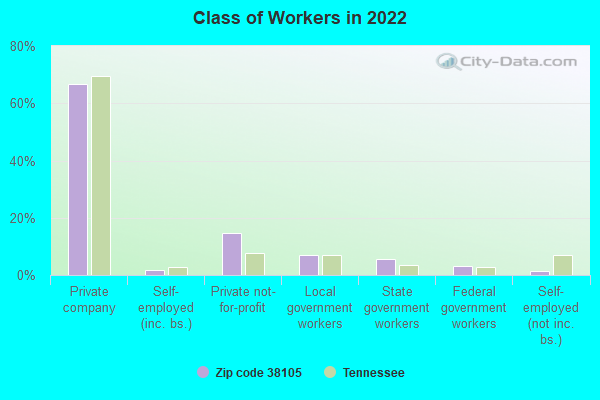
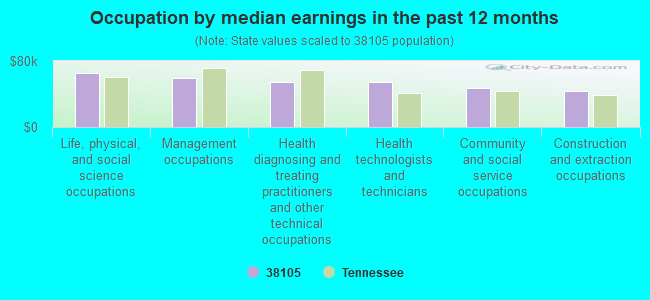
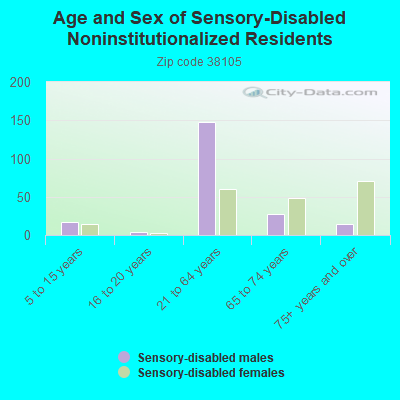
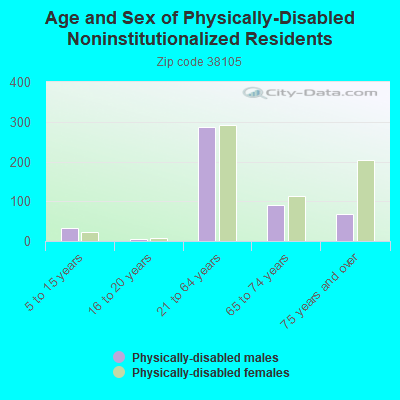
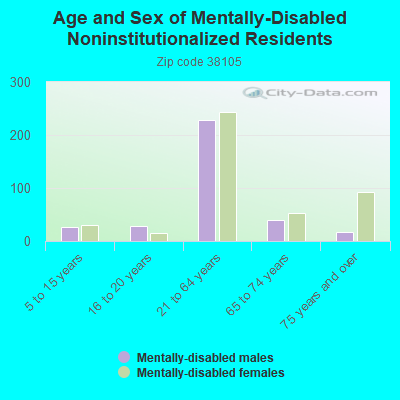
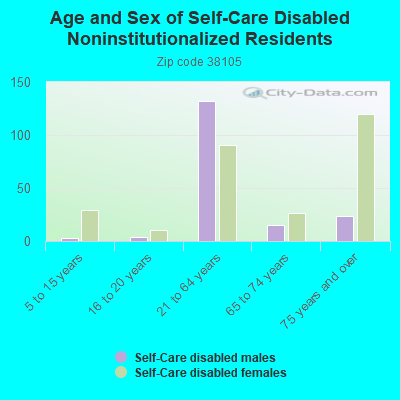
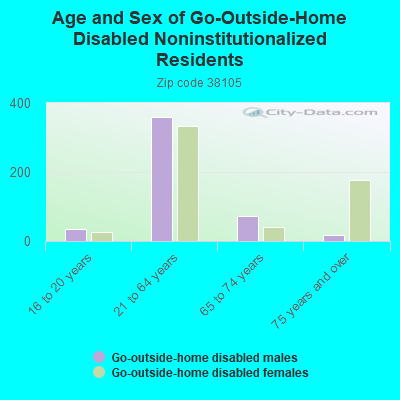
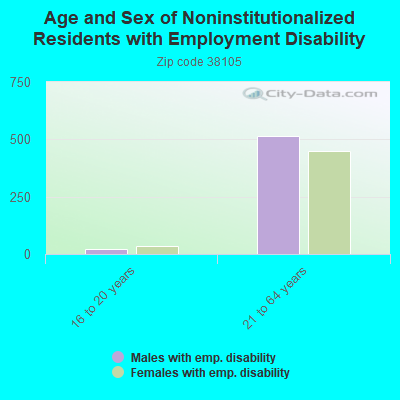
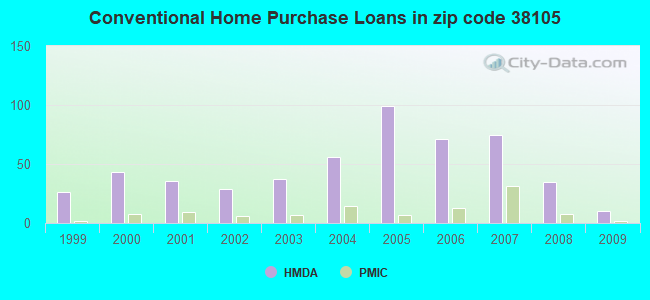
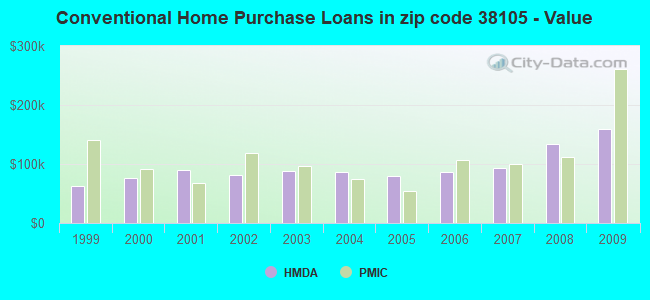
 Based on the data from the years 2002 - 2018 the average number of fires per year is 27. The highest number of fire incidents - 71 took place in 2016, and the least - 5 in 2013. The data has an increasing trend.
 When looking into fire subcategories, the most reports belonged to: Structure Fires (46.4%), and Outside Fires (25.2%).