Estimated zip code population in 2022: 4,824 Zip code population in 2010: 4,932 Zip code population in 2000: 3,924
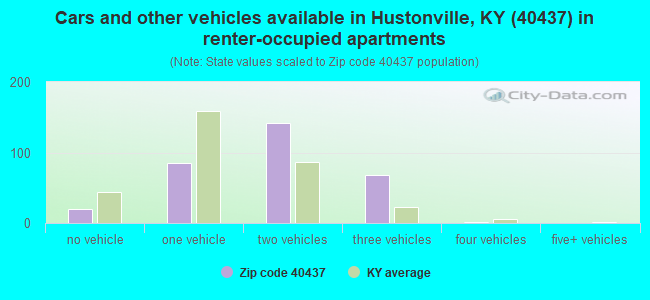
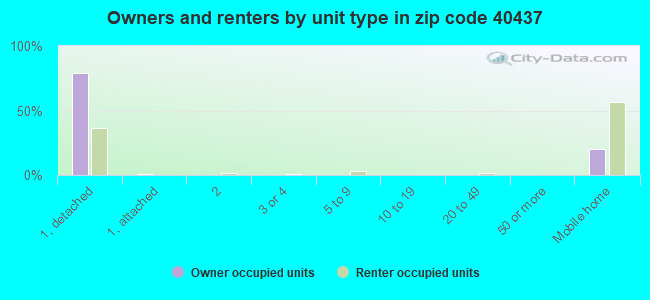
Houses and condos: 2,064 Renter-occupied apartments: 321
% of renters here:
16%
State:
31%
March 2022 cost of living index in zip code 40437: 80.9 (low, U.S. average is 100)
Land area: 121.1 sq. mi. Water area: 0.4 sq. mi.
Population density: 40 people per square mile
(very low).
OSM Map
General Map
Google Map
MSN Map
OSM Map
General Map
Google Map
MSN Map
OSM Map
General Map
Google Map
MSN Map
OSM Map
General Map
Google Map
MSN Map
Please wait while loading the map...
Real estate property taxes paid for housing units in 2022:
This zip code:
0.9% ($1,162)
Kentucky:
0.7% ($1,456)
Median real estate property taxes paid for housing units with mortgages in 2022: $1,133 (0.9%) Median real estate property taxes paid for housing units with no mortgage in 2022: $1,179 (0.9%)
Business Search- 14 Million verified businesses
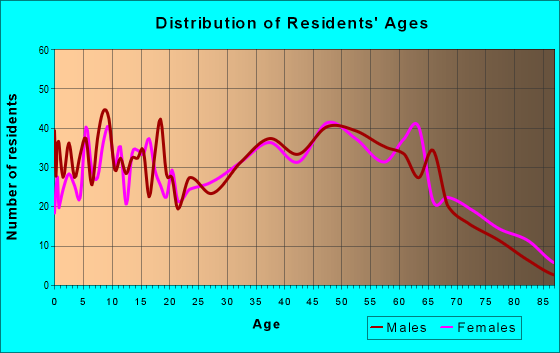
Males: 2,403
(49.8%)
Females: 2,420
(50.2%)
For population 25 years and over in 40437:
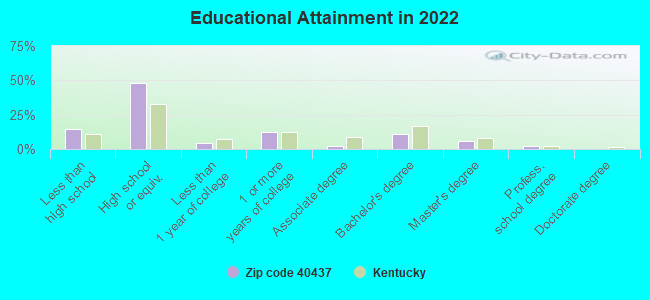
High school or higher: 84.3%
Bachelor's degree or higher: 18.4%
Graduate or professional degree: 7.5%
Unemployed: 8.8%
Mean travel time to work (commute): 30.3 minutes
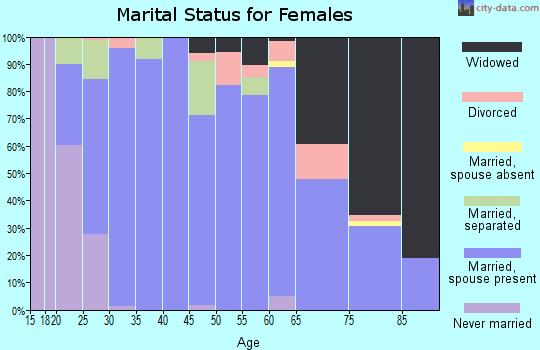
For population 15 years and over in 40437:
Never married: 23.0%
Now married: 54.4%
Separated: 1.0%
Widowed: 7.1%
Divorced: 14.5%
Zip code 40437 compared to state average:
Median house value below state average.
Unemployed percentage above state average.
Black race population percentage significantly below state average.
Hispanic race population percentage significantly below state average.
Median age above state average.
Foreign-born population percentage significantly below state average.
Renting percentage below state average.
Length of stay since moving in significantly above state average.
Percentage of population with a bachelor's degree or higher below state average.
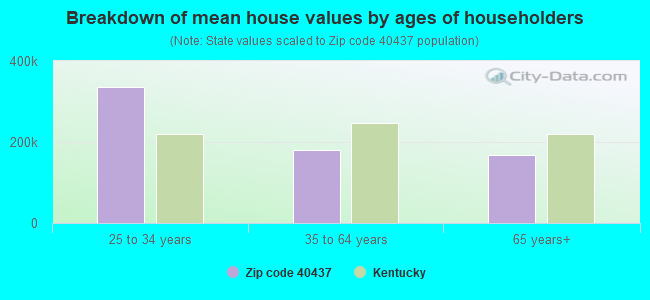
Estimated median house/condo value in 2022: $126,541
40437:
$126,541
Kentucky:
$196,300
According to our research of Kentucky and other state lists, there were 10 registered sex offenders living in 40437 zip code as of May 10, 2024. The ratio of all residents to sex offenders in zip code 40437 is 530 to 1. The ratio of registered sex offenders to all residents in this zip code is near the state average.
Median resident age:
This zip code:
44.5 years
Kentucky median age:
39.4 years
Average household size:
This zip code:
2.4 people
Kentucky:
2.4 people
Averages for the 2020 tax year for zip code 40437, filed in 2021:
Average Adjusted Gross Income (AGI) in 2020: $45,303 (Individual Income Tax Returns)
Here:
$45,303
State:
$61,342
Salary/wage: $41,308 (reported on 82.0% of returns)
Here:
$41,308
State:
$50,827
(% of AGI for various income ranges: 1179.0% for AGIs below $25k, 3634.7% for AGIs $25k-50k, 6195.0% for AGIs $50k-75k, 9539.1% for AGIs $75k-100k, 19426.7% for AGIs $100k-200k)
Taxable interest for individuals: $917 (reported on 16.9% of returns)
This zip code:
$917
Kentucky:
$1,441
(% of AGI for various income ranges: 6.5% for AGIs below $25k, 22.9% for AGIs $25k-50k, 13.5% for AGIs $50k-75k, 30.0% for AGIs $75k-100k, 104.4% for AGIs $100k-200k)
Ordinary dividends: $1,920 (reported on 5.6% of returns)
Here:
$1,920
State:
$7,388
(% of AGI for various income ranges: 9.2% for AGIs $25k-50k, 27.5% for AGIs $50k-75k, 113.3% for AGIs $100k-200k)
Net capital gain/loss in AGI: +$8,800 (reported on 6.7% of returns)
Here:
+$8,800
State:
+$19,475
(% of AGI for various income ranges: 33.2% for AGIs $25k-50k, 93.5% for AGIs $50k-75k, 825.6% for AGIs $100k-200k)
Profit/loss from business: +$9,484 (reported on 17.4% of returns)
Here:
+$9,484
State:
+$11,386
(% of AGI for various income ranges: 121.5% for AGIs below $25k, 174.5% for AGIs $25k-50k, 456.0% for AGIs $50k-75k, 271.8% for AGIs $75k-100k, 482.2% for AGIs $100k-200k)
Taxable individual retirement arrangement distribution: $12,060 (reported on 5.6% of returns)
40437:
$12,060
Kentucky:
$18,941
(% of AGI for various income ranges: 26.5% for AGIs below $25k, 104.7% for AGIs $25k-50k, 609.1% for AGIs $75k-100k)
Total itemized deductions: $33,533 (reported on 1.7% of returns)
Here:
$33,533
State:
$32,473
(% of AGI for various income ranges: 503.0% for AGIs $50k-75k)
Charity contributions: $12,067 (reported on 1.7% of returns)
Here:
$12,067
State:
$13,472
(% of AGI for various income ranges: 181.0% for AGIs $50k-75k)
Taxes paid: $8,400 (reported on 1.7% of returns)
40437:
$8,400
State:
$7,830
(% of AGI for various income ranges: 229.1% for AGIs $75k-100k)
Earned income credit: $2,318 (reported on 24.7% of returns)
Here:
$2,318
State:
$2,336
(% of AGI for various income ranges: 123.3% for AGIs below $25k, 99.7% for AGIs $25k-50k)
Percentage of individuals using paid preparers for their 2020 taxes: 97.2%
Here:
97%
State:
94%
(% for various income ranges: 97.2% for AGIs below $25k, 97.9% for AGIs $25k-50k, 96.3% for AGIs $50k-75k, 100.0% for AGIs $75k-100k, 92.9% for AGIs $100k-200k, 100.0% for AGIs over 200k)
Averages for the 2012 tax year for zip code 40437, filed in 2013:
Average Adjusted Gross Income (AGI) in 2012: $37,618 (Individual Income Tax Returns)
Here:
$37,618
State:
$50,814
Salary/wage: $34,050 (reported on 84.8% of returns)
Here:
$34,050
State:
$42,723
(% of AGI for various income ranges: 75.5% for AGIs below $25k, 80.9% for AGIs $25k-50k, 83.1% for AGIs $50k-75k, 79.5% for AGIs $75k-100k, 61.9% for AGIs $100k-200k)
Taxable interest for individuals: $963 (reported on 24.8% of returns)
This zip code:
$963
Kentucky:
$1,381
(% of AGI for various income ranges: 1.1% for AGIs below $25k, 0.5% for AGIs $25k-50k, 1.1% for AGIs $50k-75k, 0.3% for AGIs $75k-100k, 0.2% for AGIs $100k-200k)
Ordinary dividends: $1,662 (reported on 7.9% of returns)
Here:
$1,662
State:
$6,239
(% of AGI for various income ranges: 1.0% for AGIs below $25k, 0.3% for AGIs $25k-50k, 0.1% for AGIs $50k-75k, 0.6% for AGIs $75k-100k)
Net capital gain/loss in AGI: +$2,144 (reported on 10.9% of returns)
Here:
+$2,144
State:
+$11,336
(% of AGI for various income ranges: 0.5% for AGIs below $25k, 0.6% for AGIs $25k-50k, 0.8% for AGIs $50k-75k, 1.2% for AGIs $75k-100k)
Profit/loss from business: +$5,393 (reported on 16.4% of returns)
Here:
+$5,393
State:
+$10,862
(% of AGI for various income ranges: 8.5% for AGIs below $25k, 2.3% for AGIs $25k-50k, 1.3% for AGIs $50k-75k, 0.7% for AGIs $75k-100k)
Taxable individual retirement arrangement distribution: $10,842 (reported on 7.3% of returns)
40437:
$10,842
Kentucky:
$14,296
(% of AGI for various income ranges: 1.6% for AGIs below $25k, 1.6% for AGIs $25k-50k, 1.5% for AGIs $50k-75k, 6.8% for AGIs $75k-100k)
Total itemized deductions: $17,288 (24% of AGI, reported on 20.6% of returns)
Here:
$17,288
State:
$21,160
Here:
23.8% of AGI
State:
20.0% of AGI
(% of AGI for various income ranges: 5.1% for AGIs below $25k, 7.3% for AGIs $25k-50k, 9.6% for AGIs $50k-75k, 12.5% for AGIs $75k-100k, 13.3% for AGIs $100k-200k)
Charity contributions: $3,823 (reported on 13.3% of returns)
Here:
$3,823
State:
$4,303
(% of AGI for various income ranges: 0.3% for AGIs below $25k, 1.2% for AGIs $25k-50k, 1.4% for AGIs $50k-75k, 1.8% for AGIs $75k-100k, 2.1% for AGIs $100k-200k)
Taxes paid: $5,238 (reported on 20.6% of returns)
40437:
$5,238
State:
$8,496
(% of AGI for various income ranges: 0.7% for AGIs below $25k, 1.5% for AGIs $25k-50k, 2.8% for AGIs $50k-75k, 4.2% for AGIs $75k-100k, 5.5% for AGIs $100k-200k)
Earned income credit: $2,240 (reported on 29.1% of returns)
Here:
$2,240
State:
$2,273
(% of AGI for various income ranges: 8.2% for AGIs below $25k, 1.8% for AGIs $25k-50k)
Percentage of individuals using paid preparers for their 2012 taxes: 78.2%
Here:
78%
State:
60%
(% for various income ranges: 76.3% for AGIs below $25k, 80.0% for AGIs $25k-50k, 79.2% for AGIs $50k-75k, 75.0% for AGIs $75k-100k, 87.5% for AGIs $100k-200k)
Averages for the 2004 tax year for zip code 40437, filed in 2005:
Average Adjusted Gross Income (AGI) in 2004: $28,383 (Individual Income Tax Returns)
Here:
$28,383
State:
$41,540
Salary/wage: $27,284 (reported on 85.5% of returns)
Here:
$27,284
State:
$36,432
(% of AGI for various income ranges: 87.3% for AGIs below $10k, 80.5% for AGIs $10k-25k, 86.5% for AGIs $25k-50k, 82.7% for AGIs $50k-75k, 85.0% for AGIs $75k-100k, 56.7% for AGIs over 100k)
Taxable interest for individuals: $1,293 (reported on 31.4% of returns)
This zip code:
$1,293
Kentucky:
$1,571
(% of AGI for various income ranges: 5.6% for AGIs below $10k, 2.0% for AGIs $10k-25k, 1.1% for AGIs $25k-50k, 1.4% for AGIs $50k-75k, 0.2% for AGIs $75k-100k, 0.9% for AGIs over 100k)
Taxable dividends: $822 (reported on 7.7% of returns)
Here:
$822
State:
$3,453
(% of AGI for various income ranges: 0.3% for AGIs below $10k, 0.3% for AGIs $10k-25k, 0.2% for AGIs $25k-50k, 0.3% for AGIs $50k-75k, 0.1% for AGIs $75k-100k)
Net capital gain/loss: +$5,071 (reported on 9.2% of returns)
Here:
+$5,071
State:
+$9,663
(% of AGI for various income ranges: 2.0% for AGIs below $10k, 0.8% for AGIs $10k-25k, 1.1% for AGIs $25k-50k, 1.6% for AGIs $50k-75k, 0.9% for AGIs $75k-100k, 8.0% for AGIs over 100k)
Profit/loss from business: +$6,693 (reported on 17.8% of returns)
Here:
+$6,693
State:
+$9,233
(% of AGI for various income ranges: 21.8% for AGIs below $10k, 5.1% for AGIs $10k-25k, 4.0% for AGIs $25k-50k, 2.5% for AGIs $50k-75k, 4.0% for AGIs $75k-100k)
IRA payment deduction: $4,120 (reported on 1.5% of returns)
40437:
$4,120
Kentucky:
$2,955
Total itemized deductions: $13,493 (26% of AGI, reported on 20.4% of returns)
Here:
$13,493
State:
$17,474
Here:
25.5% of AGI
State:
21.0% of AGI
(% of AGI for various income ranges: 4.5% for AGIs $10k-25k, 9.9% for AGIs $25k-50k, 12.4% for AGIs $50k-75k, 13.5% for AGIs $75k-100k, 12.8% for AGIs over 100k)
Charity contributions deductions: $2,851 (5% of AGI, reported on 14.5% of returns)
Here:
$2,851
State:
$3,494
Here:
5.1% of AGI
State:
4.0% of AGI
(% of AGI for various income ranges: 0.5% for AGIs $10k-25k, 1.4% for AGIs $25k-50k, 1.7% for AGIs $50k-75k, 3.0% for AGIs $75k-100k, 2.2% for AGIs over 100k)
Total tax: $2,818 (reported on 70.3% of returns)
40437:
$2,818
State:
$6,162
(% of AGI for various income ranges: 4.2% for AGIs below $10k, 3.7% for AGIs $10k-25k, 5.8% for AGIs $25k-50k, 8.4% for AGIs $50k-75k, 9.8% for AGIs $75k-100k, 14.6% for AGIs over 100k)
Earned income credit: $1,761 (reported on 27.1% of returns)
Here:
$1,761
State:
$1,723
Percentage of individuals using paid preparers for their 2004 taxes: 81.4%
Here:
81%
State:
66%
(% for various income ranges: 73.8% for AGIs below $10k, 85.2% for AGIs $10k-25k, 82.2% for AGIs $25k-50k, 85.4% for AGIs $50k-75k, 79.6% for AGIs $75k-100k, 79.2% for AGIs over 100k)
Household received Food Stamps/SNAP in the past 12 months: 241 Household did not receive Food Stamps/SNAP in the past 12 months: 1,737
Women who had a birth in the past 12 months: 22 (20 now married, 2 unmarried) Women who did not have a birth in the past 12 months: 993 (450 now married, 543 unmarried)
Housing units in zip code 40437 with a mortgage: 719 (86 second mortgage, 81 both second mortgage and home equity loan) Houses without a mortgage: 6
Median monthly owner costs for units with a mortgage: $960 Median monthly owner costs for units without a mortgage: $369
Residents with income below the poverty level in 2022:
This zip code:
9.9%
Whole state:
16.5%
Residents with income below 50% of the poverty level in 2022:
This zip code:
8.3%
Whole state:
9.0%
Median number of rooms in houses and condos:
Here:
5.9
State:
6.4
Median number of rooms in apartments:
Here:
5.4
State:
4.4
Notable locations in this zip code not listed on our city pages
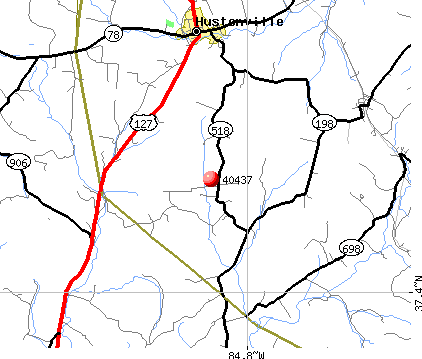
Notable locations in zip code 40437: Kidds Store (A), Hustonville Fire Department (B), Brush Creek Fire Department (C), Lincoln County Fire Department Station 4 (D), McKinney Area Rescue Squad (E). Display/hide their locations on the map
Churches in zip code 40437 include: Frey Creek Church (A), New Bethel Church of Christ (B), Pine Lick Church (C), Poplar Grove Baptist Church (D), Austin Chapel (E), Brush Creek Tabernacle (F), South Fork Church (G). Display/hide their locations on the map
Cemeteries: McCormick Cemetery (1), Pruitt Cemetery (2), Malone Cemetery (3), Brown Cemetery (4), Ellis Cemetery (5), Poplar Grove Cemetery (6), Drye Graveyard (7). Display/hide their locations on the map
Streams, rivers, and creeks: Baughman Creek (A), Big Moccasin Creek (B), Wolf Pen Branch (C), Cox Branch (D), Tunnel Creek (E), Coffman Branch (F), South Fork Green River (G), Sims Creek (H), Buck Branch (I). Display/hide their locations on the map
Size of family households: 585 2-persons, 517 3-persons, 161 4-persons, 252 5-persons, 6 6-persons
Size of nonfamily households: 411 1-person, 35 2-persons, 8 3-persons
486 married couples with children.
395 single-parent households (237 men, 158 women).
96.3% of residents of 40437 zip code speak English at home.
1.8% of residents speak Spanish at home (93% very well, 7% well).
2.1% of residents speak Asian or Pacific Island language at home (100% very well).
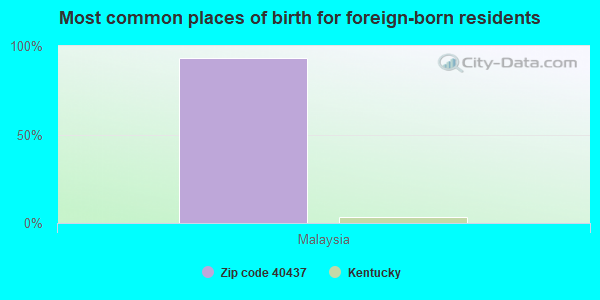
Foreign born population: 15 (0.3%) (100.0% of them are naturalized citizens)
This zip code:
0.3%
Whole state:
4.0%
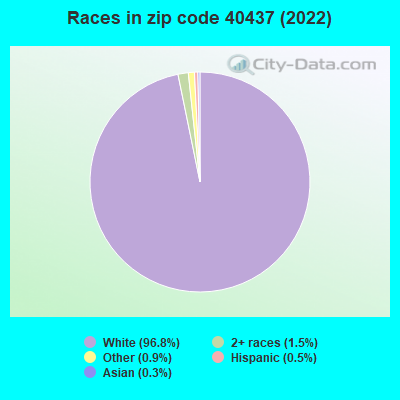
93%Malaysia
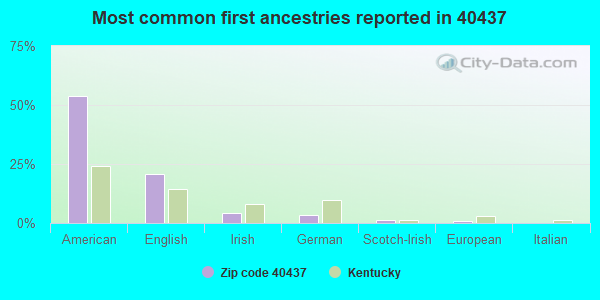
54%American
21%English
4%Irish
3%German
1%Scotch-Irish
1%European
0%Italian
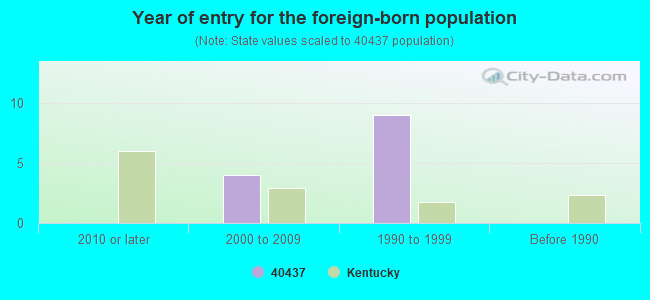
Year of entry for the foreign-born population
02010 or later
42000 to 2009
91990 to 1999
0Before 1990
Facilities with environmental interests located in this zip code:
COMBS AUTO SERVICE (7886 LIBERTY RD in HUSTONVILLE, KY)
PHILLIPS LUMBER CO INC (13475 LIBERTY RD in HUSTONVILLE, KY)
National Pollutant Discharge Elimination System NON-MAJOR (Tracking pollutant discharge elimination systems) - permit Business SIC classification: SAWMILLS AND PLANING MILLS, GENERAL
Housing units lacking complete plumbing facilities: 0.7% Housing units lacking complete kitchen facilities: 1.3%
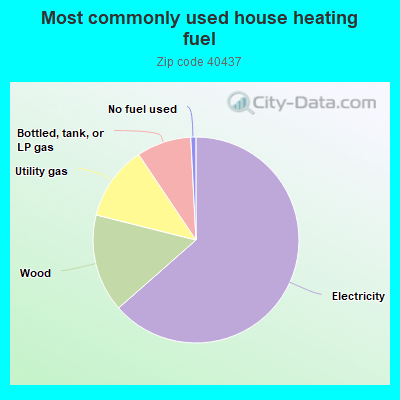
63.6%Electricity
15.4%Wood
11.7%Utility gas
8.6%Bottled, tank, or LP gas
0.8%No fuel used
Population in 1990: 2,965. Population change in the 1990s: +959 (+32.3%).
Place of birth for U.S.-born residents:
This state: 3,911
Northeast: 34
Midwest: 443
South: 372
West: 13
64% of the 40437 zip code residents lived in the same house 5 years ago. Out of people who lived in different houses, 47% lived in this county. Out of people who lived in different counties, 50% lived in Kentucky.
88% of the 40437 zip code residents lived in the same house 1 year ago. Out of people who lived in different houses, 49% moved from this county. Out of people who lived in different houses, 27% moved from different county within same state. Out of people who lived in different houses, 23% moved from different state.
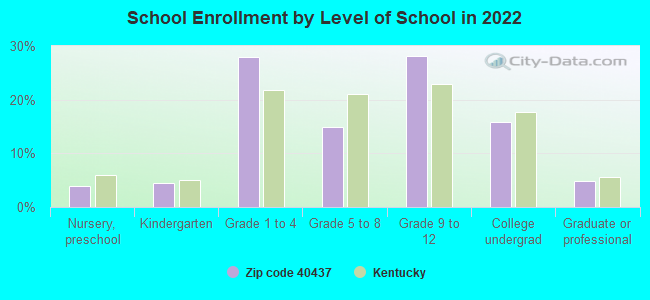
Private vs. public school enrollment:
Students in private schools in grades 1 to 8 (elementary and middle school): 16
Here:
4.2%
Kentucky:
17.2%
Students in private schools in grades 9 to 12 (high school): 46
Here:
17.5%
Kentucky:
15.2%
Students in private undergraduate colleges: 30
Here:
20.5%
Kentucky:
19.6%
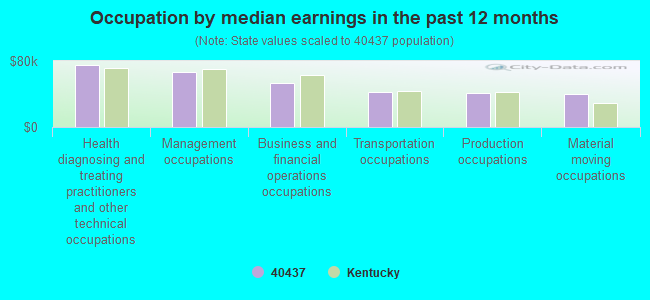
Occupation by median earnings in the past 12 months ($)
74,870Health diagnosing and treating practitioners and other technical occupations
66,343Management occupations
53,373Business and financial operations occupations
42,731Transportation occupations
41,486Production occupations
40,332Material moving occupations
Top industries in this zip code by the number of employees in 2005:
Wholesale Trade: Sporting and Recreational Goods and Supplies Merchant Wholesalers (20-49 employees: 1 establishment)
Other Services (except Public Administration): Religious Organizations (5-9: 1, 1-4: 7)
Finance and Insurance: Commercial Banking (10-19: 1, 1-4: 1)
Health Care and Social Assistance: Ambulance Services (10-19: 1)
Wholesale Trade: Other Miscellaneous Nondurable Goods Merchant Wholesalers (10-19: 1)
Wholesale Trade: Recyclable Material Merchant Wholesalers (5-9: 1, 1-4: 1)
Other Services (except Public Administration): Funeral Homes and Funeral Services (5-9: 1)
Fatal accident statistics in 2014:
Fatal accident count: 1
Vehicles involved in fatal accidents: 2
Fatal accidents caused by drunken drivers: 0
Fatalities: 1
Persons involved in fatal accidents: 2
Pedestrians involved in fatal accidents: 0
Fatal accident statistics in 2013:
Fatal accident count: 1
Vehicles involved in fatal accidents: 1
Fatal accidents caused by drunken drivers: 0
Fatalities: 1
Persons involved in fatal accidents: 1
Pedestrians involved in fatal accidents: 0
2004 - 2018 National Fire Incident Reporting System (NFIRS) incidents
Based on the data from the years 2004 - 2018 the average number of fire incidents per year is 33. The highest number of fires - 69 took place in 2015, and the least - 3 in 2004. The data has a rising trend.
When looking into fire subcategories, the most reports belonged to: Structure Fires (46.4%), and Outside Fires (32.6%).
Fire incident types reported to NFIRS in Zip Code 40437
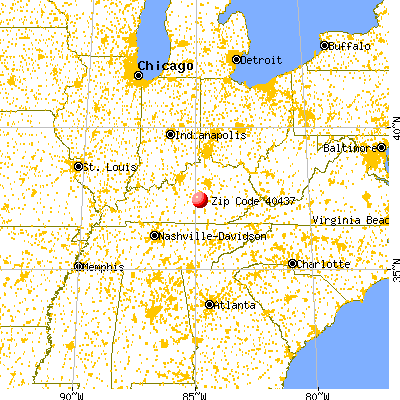


 Nearest zip codes: 42541, 40448, 40464, 42539, 40440, 40442.


 Based on the data from the years 2004 - 2018 the average number of fire incidents per year is 33. The highest number of fires - 69 took place in 2015, and the least - 3 in 2004. The data has a rising trend.
 When looking into fire subcategories, the most reports belonged to: Structure Fires (46.4%), and Outside Fires (32.6%).