Estimated zip code population in 2022: 57,653 Zip code population in 2010: 48,107 Zip code population in 2000: 36,625
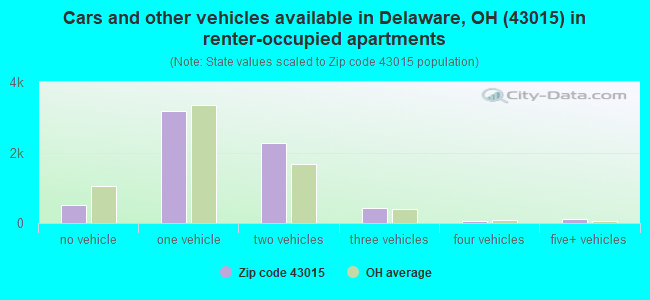
Houses and condos: 23,084 Renter-occupied apartments: 6,594
% of renters here:
30%
State:
33%
March 2022 cost of living index in zip code 43015: 95.5 (near average, U.S. average is 100)
Land area: 125.0 sq. mi. Water area: 3.9 sq. mi.
Population density: 461 people per square mile
(low).
OSM Map
General Map
Google Map
MSN Map
OSM Map
General Map
Google Map
MSN Map
OSM Map
General Map
Google Map
MSN Map
OSM Map
General Map
Google Map
MSN Map
Please wait while loading the map...
Real estate property taxes paid for housing units in 2022:
This zip code:
1.4% ($4,392)
Ohio:
1.3% ($2,639)
Median real estate property taxes paid for housing units with mortgages in 2022: $4,598 (1.4%) Median real estate property taxes paid for housing units with no mortgage in 2022: $3,959 (1.5%)
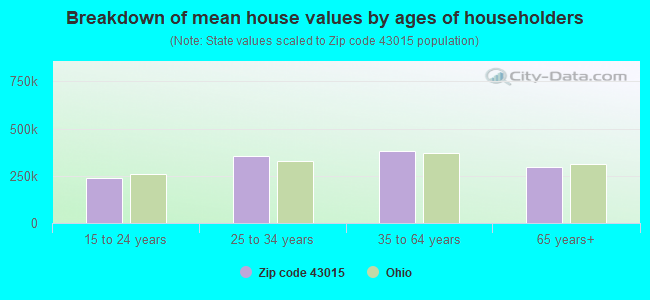
Estimated median house/condo value in 2022: $311,662
43015:
$311,662
Ohio:
$204,100
According to our research of Ohio and other state lists, there were 47 registered sex offenders living in 43015 zip code as of April 27, 2024. The ratio of all residents to sex offenders in zip code 43015 is 1,140 to 1. The ratio of registered sex offenders to all residents in this zip code is lower than the state average.
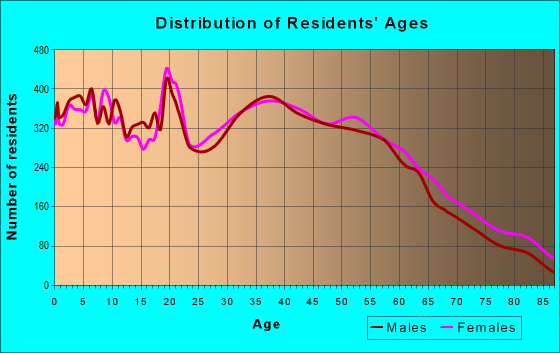
Median resident age:
This zip code:
39.2 years
Ohio median age:
39.9 years
Average household size:
This zip code:
2.5 people
Ohio:
2.4 people
Averages for the 2020 tax year for zip code 43015, filed in 2021:
Average Adjusted Gross Income (AGI) in 2020: $91,026 (Individual Income Tax Returns)
Here:
$91,026
State:
$67,288
Salary/wage: $75,392 (reported on 83.8% of returns)
Here:
$75,392
State:
$55,628
(% of AGI for various income ranges: 1111.7% for AGIs below $25k, 3605.9% for AGIs $25k-50k, 6438.4% for AGIs $50k-75k, 9626.5% for AGIs $75k-100k, 18670.7% for AGIs $100k-200k, 80972.0% for AGIs over 200k)
Taxable interest for individuals: $1,388 (reported on 31.1% of returns)
This zip code:
$1,388
Ohio:
$1,518
(% of AGI for various income ranges: 12.1% for AGIs below $25k, 14.9% for AGIs $25k-50k, 29.2% for AGIs $50k-75k, 40.3% for AGIs $75k-100k, 71.2% for AGIs $100k-200k, 1043.7% for AGIs over 200k)
Ordinary dividends: $5,679 (reported on 23.7% of returns)
Here:
$5,679
State:
$7,167
(% of AGI for various income ranges: 23.7% for AGIs below $25k, 39.7% for AGIs $25k-50k, 94.1% for AGIs $50k-75k, 141.2% for AGIs $75k-100k, 262.4% for AGIs $100k-200k, 3133.7% for AGIs over 200k)
Net capital gain/loss in AGI: +$30,531 (reported on 20.7% of returns)
Here:
+$30,531
State:
+$18,919
(% of AGI for various income ranges: 12.5% for AGIs below $25k, 32.8% for AGIs $25k-50k, 84.2% for AGIs $50k-75k, 173.8% for AGIs $75k-100k, 480.3% for AGIs $100k-200k, 23913.4% for AGIs over 200k)
Profit/loss from business: +$17,642 (reported on 15.5% of returns)
Here:
+$17,642
State:
+$13,744
(% of AGI for various income ranges: 98.9% for AGIs below $25k, 137.6% for AGIs $25k-50k, 193.3% for AGIs $50k-75k, 326.3% for AGIs $75k-100k, 519.9% for AGIs $100k-200k, 5484.5% for AGIs over 200k)
Taxable individual retirement arrangement distribution: $21,102 (reported on 10.7% of returns)
43015:
$21,102
Ohio:
$18,876
(% of AGI for various income ranges: 61.3% for AGIs below $25k, 142.2% for AGIs $25k-50k, 279.5% for AGIs $50k-75k, 425.4% for AGIs $75k-100k, 704.1% for AGIs $100k-200k, 1905.4% for AGIs over 200k)
Self-employed (Keogh) retirement plans: $20,865 (reported on 0.7% of returns)
43015:
$20,865
Ohio:
$24,898
(% of AGI for various income ranges: 9.6% for AGIs $50k-75k, 23.3% for AGIs $100k-200k, 471.2% for AGIs over 200k)
Total itemized deductions: $30,815 (reported on 10.0% of returns)
Here:
$30,815
State:
$33,869
(% of AGI for various income ranges: 55.3% for AGIs below $25k, 79.3% for AGIs $25k-50k, 298.6% for AGIs $50k-75k, 419.6% for AGIs $75k-100k, 778.8% for AGIs $100k-200k, 5624.3% for AGIs over 200k)
Charity contributions: $10,643 (reported on 7.9% of returns)
Here:
$10,643
State:
$14,577
(% of AGI for various income ranges: 3.3% for AGIs below $25k, 9.4% for AGIs $25k-50k, 41.3% for AGIs $50k-75k, 64.4% for AGIs $75k-100k, 184.9% for AGIs $100k-200k, 2202.8% for AGIs over 200k)
Taxes paid: $8,260 (reported on 10.0% of returns)
43015:
$8,260
State:
$7,681
(% of AGI for various income ranges: 7.9% for AGIs below $25k, 16.0% for AGIs $25k-50k, 88.6% for AGIs $50k-75k, 141.6% for AGIs $75k-100k, 250.5% for AGIs $100k-200k, 1212.5% for AGIs over 200k)
Earned income credit: $2,025 (reported on 9.5% of returns)
Here:
$2,025
State:
$2,304
(% of AGI for various income ranges: 62.4% for AGIs below $25k, 49.8% for AGIs $25k-50k, 0.9% for AGIs $50k-75k)
Percentage of individuals using paid preparers for their 2020 taxes: 93.8%
Here:
94%
State:
94%
(% for various income ranges: 91.8% for AGIs below $25k, 94.2% for AGIs $25k-50k, 93.6% for AGIs $50k-75k, 94.3% for AGIs $75k-100k, 95.5% for AGIs $100k-200k, 94.1% for AGIs over 200k)
Averages for the 2012 tax year for zip code 43015, filed in 2013:
Average Adjusted Gross Income (AGI) in 2012: $67,794 (Individual Income Tax Returns)
Here:
$67,794
State:
$54,926
Salary/wage: $57,025 (reported on 85.8% of returns)
Here:
$57,025
State:
$45,869
(% of AGI for various income ranges: 74.1% for AGIs below $25k, 79.7% for AGIs $25k-50k, 78.6% for AGIs $50k-75k, 79.9% for AGIs $75k-100k, 81.1% for AGIs $100k-200k, 49.0% for AGIs over 200k)
Taxable interest for individuals: $1,198 (reported on 32.6% of returns)
This zip code:
$1,198
Ohio:
$1,297
(% of AGI for various income ranges: 0.8% for AGIs below $25k, 0.4% for AGIs $25k-50k, 0.5% for AGIs $50k-75k, 0.4% for AGIs $75k-100k, 0.4% for AGIs $100k-200k, 1.0% for AGIs over 200k)
Ordinary dividends: $4,466 (reported on 21.6% of returns)
Here:
$4,466
State:
$5,821
(% of AGI for various income ranges: 1.4% for AGIs below $25k, 0.9% for AGIs $25k-50k, 0.9% for AGIs $50k-75k, 0.9% for AGIs $75k-100k, 1.0% for AGIs $100k-200k, 2.7% for AGIs over 200k)
Net capital gain/loss in AGI: +$14,837 (reported on 16.0% of returns)
Here:
+$14,837
State:
+$11,232
(% of AGI for various income ranges: 0.3% for AGIs $25k-50k, 0.4% for AGIs $50k-75k, 0.7% for AGIs $75k-100k, 1.3% for AGIs $100k-200k, 12.0% for AGIs over 200k)
Profit/loss from business: +$14,147 (reported on 15.9% of returns)
Here:
+$14,147
State:
+$12,773
(% of AGI for various income ranges: 7.2% for AGIs below $25k, 3.3% for AGIs $25k-50k, 2.5% for AGIs $50k-75k, 2.9% for AGIs $75k-100k, 3.3% for AGIs $100k-200k, 3.2% for AGIs over 200k)
Taxable individual retirement arrangement distribution: $15,152 (reported on 10.6% of returns)
43015:
$15,152
Ohio:
$14,511
(% of AGI for various income ranges: 3.5% for AGIs below $25k, 2.5% for AGIs $25k-50k, 2.7% for AGIs $50k-75k, 2.7% for AGIs $75k-100k, 2.4% for AGIs $100k-200k, 1.6% for AGIs over 200k)
Self-employment retirement plans: $15,761 (reported on 0.8% of returns)
43015:
$15,761
Ohio:
$20,257
(% of AGI for various income ranges: 0.1% for AGIs $25k-50k, 0.1% for AGIs $75k-100k, 0.2% for AGIs $100k-200k, 0.4% for AGIs over 200k)
Total itemized deductions: $22,038 (19% of AGI, reported on 42.6% of returns)
Here:
$22,038
State:
$21,278
Here:
18.9% of AGI
State:
18.8% of AGI
(% of AGI for various income ranges: 9.0% for AGIs below $25k, 10.2% for AGIs $25k-50k, 14.3% for AGIs $50k-75k, 15.7% for AGIs $75k-100k, 16.5% for AGIs $100k-200k, 12.4% for AGIs over 200k)
Charity contributions: $3,289 (reported on 33.3% of returns)
Here:
$3,289
State:
$3,943
(% of AGI for various income ranges: 0.7% for AGIs below $25k, 1.1% for AGIs $25k-50k, 1.4% for AGIs $50k-75k, 1.6% for AGIs $75k-100k, 1.9% for AGIs $100k-200k, 1.9% for AGIs over 200k)
Taxes paid: $10,379 (reported on 42.5% of returns)
43015:
$10,379
State:
$9,568
(% of AGI for various income ranges: 2.0% for AGIs below $25k, 3.3% for AGIs $25k-50k, 5.8% for AGIs $50k-75k, 6.9% for AGIs $75k-100k, 8.3% for AGIs $100k-200k, 7.3% for AGIs over 200k)
Earned income credit: $2,057 (reported on 12.7% of returns)
Here:
$2,057
State:
$2,285
(% of AGI for various income ranges: 5.1% for AGIs below $25k, 0.8% for AGIs $25k-50k)
Percentage of individuals using paid preparers for their 2012 taxes: 43.1%
Here:
43%
State:
51%
(% for various income ranges: 35.7% for AGIs below $25k, 42.4% for AGIs $25k-50k, 47.4% for AGIs $50k-75k, 47.2% for AGIs $75k-100k, 46.3% for AGIs $100k-200k, 70.3% for AGIs over 200k)
Averages for the 2004 tax year for zip code 43015, filed in 2005:
Average Adjusted Gross Income (AGI) in 2004: $53,178 (Individual Income Tax Returns)
Here:
$53,178
State:
$44,480
Salary/wage: $46,031 (reported on 88.5% of returns)
Here:
$46,031
State:
$39,198
(% of AGI for various income ranges: 125.2% for AGIs below $10k, 78.3% for AGIs $10k-25k, 83.8% for AGIs $25k-50k, 85.0% for AGIs $50k-75k, 87.1% for AGIs $75k-100k, 62.0% for AGIs over 100k)
Taxable interest for individuals: $1,357 (reported on 44.5% of returns)
This zip code:
$1,357
Ohio:
$1,532
(% of AGI for various income ranges: 5.6% for AGIs below $10k, 1.8% for AGIs $10k-25k, 1.0% for AGIs $25k-50k, 0.8% for AGIs $50k-75k, 0.6% for AGIs $75k-100k, 1.4% for AGIs over 100k)
Taxable dividends: $2,570 (reported on 24.8% of returns)
Here:
$2,570
State:
$3,496
(% of AGI for various income ranges: 4.0% for AGIs below $10k, 1.3% for AGIs $10k-25k, 0.7% for AGIs $25k-50k, 0.9% for AGIs $50k-75k, 0.7% for AGIs $75k-100k, 1.7% for AGIs over 100k)
Net capital gain/loss: +$11,847 (reported on 18.5% of returns)
Here:
+$11,847
State:
+$8,582
(% of AGI for various income ranges: -0.2% for AGIs below $10k, 0.5% for AGIs $10k-25k, 0.4% for AGIs $25k-50k, 0.7% for AGIs $50k-75k, 0.9% for AGIs $75k-100k, 10.0% for AGIs over 100k)
Profit/loss from business: +$11,673 (reported on 15.8% of returns)
Here:
+$11,673
State:
+$10,813
(% of AGI for various income ranges: -2.5% for AGIs below $10k, 5.0% for AGIs $10k-25k, 3.2% for AGIs $25k-50k, 2.5% for AGIs $50k-75k, 2.9% for AGIs $75k-100k, 4.3% for AGIs over 100k)
IRA payment deduction: $2,638 (reported on 2.1% of returns)
43015:
$2,638
Ohio:
$2,794
(% of AGI for various income ranges: 0.3% for AGIs below $10k, 0.2% for AGIs $10k-25k, 0.1% for AGIs $25k-50k, 0.1% for AGIs $50k-75k, 0.1% for AGIs $75k-100k, 0.1% for AGIs over 100k)
Self-employed pension: $13,845 (reported on 0.8% of returns)
Here:
$13,845
Ohio:
$13,981
(% of AGI for various income ranges: 0.0% for AGIs $25k-50k, 0.0% for AGIs $50k-75k, 0.2% for AGIs $75k-100k, 0.5% for AGIs over 100k)
Total itemized deductions: $18,547 (21% of AGI, reported on 45.2% of returns)
Here:
$18,547
State:
$17,503
Here:
21.1% of AGI
State:
20.8% of AGI
(% of AGI for various income ranges: 15.6% for AGIs below $10k, 8.9% for AGIs $10k-25k, 13.4% for AGIs $25k-50k, 17.6% for AGIs $50k-75k, 18.6% for AGIs $75k-100k, 15.7% for AGIs over 100k)
Charity contributions deductions: $3,263 (3% of AGI, reported on 36.7% of returns)
Here:
$3,263
State:
$3,087
Here:
3.4% of AGI
State:
3.4% of AGI
(% of AGI for various income ranges: 0.9% for AGIs below $10k, 0.8% for AGIs $10k-25k, 1.4% for AGIs $25k-50k, 1.8% for AGIs $50k-75k, 2.0% for AGIs $75k-100k, 3.3% for AGIs over 100k)
Total tax: $8,064 (reported on 81.0% of returns)
43015:
$8,064
State:
$6,781
(% of AGI for various income ranges: 3.4% for AGIs below $10k, 4.7% for AGIs $10k-25k, 7.6% for AGIs $25k-50k, 9.0% for AGIs $50k-75k, 10.2% for AGIs $75k-100k, 18.8% for AGIs over 100k)
Earned income credit: $1,597 (reported on 10.3% of returns)
Here:
$1,597
State:
$1,696
Percentage of individuals using paid preparers for their 2004 taxes: 48.2%
Here:
48%
State:
55%
(% for various income ranges: 37.3% for AGIs below $10k, 49.1% for AGIs $10k-25k, 50.8% for AGIs $25k-50k, 50.3% for AGIs $50k-75k, 47.3% for AGIs $75k-100k, 56.0% for AGIs over 100k)
Likely homosexual households (counted as self-reported same-sex unmarried-partner households)
Lesbian couples: 0.1% of all households
Gay men: 0.2% of all households
Household received Food Stamps/SNAP in the past 12 months: 1,634 Household did not receive Food Stamps/SNAP in the past 12 months: 20,588
Women who had a birth in the past 12 months: 628 (531 now married, 105 unmarried) Women who did not have a birth in the past 12 months: 12,832 (6,907 now married, 5,918 unmarried)
Housing units in zip code 43015 with a mortgage: 10,929 (1,264 second mortgage, 24 home equity loan, 1,101 both second mortgage and home equity loan) Houses without a mortgage: 535
Median monthly owner costs for units with a mortgage: $1,787 Median monthly owner costs for units without a mortgage: $695
Residents with income below the poverty level in 2022:
This zip code:
7.5%
Whole state:
13.4%
Residents with income below 50% of the poverty level in 2022:
This zip code:
3.7%
Whole state:
7.0%
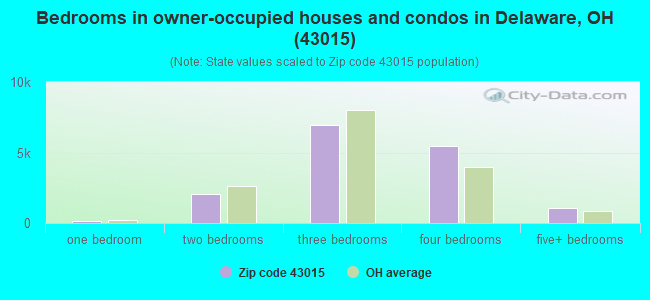
Median number of rooms in houses and condos:
Here:
7.2
State:
6.7
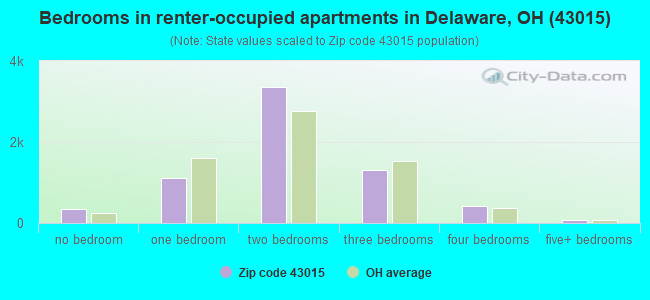
Median number of rooms in apartments:
Here:
4.2
State:
4.4
Notable locations in this zip code not listed on our city pages
10,162 married couples with children.
2,176 single-parent households (649 men, 1,527 women).
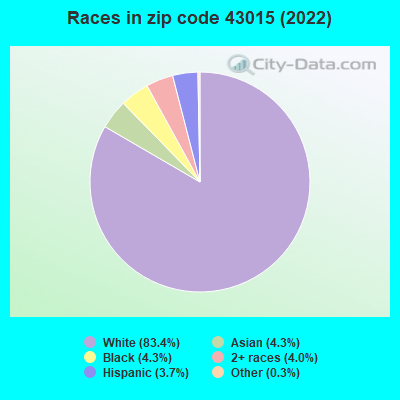
93.2% of residents of 43015 zip code speak English at home.
1.5% of residents speak Spanish at home (70% very well, 27% well, 4% not well).
2.1% of residents speak other Indo-European language at home (82% very well, 14% well, 4% not well).
2.0% of residents speak Asian or Pacific Island language at home (74% very well, 14% well, 12% not well).
0.9% of residents speak other language at home (79% very well, 6% well, 15% not well).
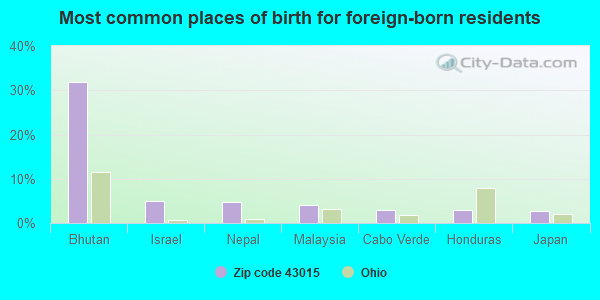
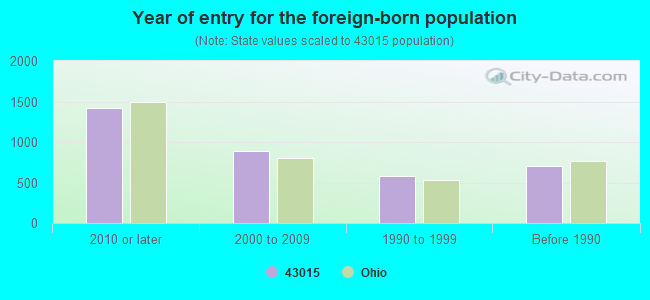
Foreign born population: 3,033 (5.3%) (51.1% of them are naturalized citizens)
Facilities with environmental interests located in this zip code:
BP AMOCO OIL CORP BULK PLANT DELAWARE (84 ROSS ST. in DELAWARE, OH)
(Integrated Compliance Information System) - ICIS-05-1996-0567, FORMAL ENFORCEMENT ACTION STATE MASTER (Ohio general info) - PCS-OH0121444, National Pollutant Discharge Elimination System Permit, RCRA-OHD000727404, HAZARDOUS WASTE PROGRAM, AIR MAJOR, EPCRA National Pollutant Discharge Elimination System NON-MAJOR (Tracking pollutant discharge elimination systems) - permit Conditionally Exempt Small Quantity Generators, less than 100 kg/month of hazardous waste (Resource Conservation and Recovery Act (tracking hazardous waste)) - notification Business SIC classification: PETROLEUM AND PETROLEUM PRODUCTS WHOLESALERS, EXCEPT BULK STATIONS AND TERMINALS Organizations: MCWHERTER PETROLEUM (CONTACT/OPERATOR)
, BP OIL COMPANY (CONTACT/OWNER)
, BP EXPLORATION & OIL INC (CONTACT/OWNER)
, BP OIL COMPANY (CONTACT/OWNER)
Alternative names: BP OIL CO, BP OIL CO BULK PLT
ALUM CREEK WWTP * (NW OF I-71 AND POWELL in DELAWARE, OH)
STATE MASTER (Ohio general info) - PCS-OH0121380, National Pollutant Discharge Elimination System Permit National Pollutant Discharge Elimination System MAJOR (Tracking pollutant discharge elimination systems) - permit Business SIC classification: SEWERAGE SYSTEMS Organizations: DELAWARE CO ALUM CREEK WWTP (CONTACT/OWNER)
Alternative names: DELAWARE CO ALUM CREEK WW FACILITIES, DELAWARE CO ALUM CREEK WWTP
ADVANCE AUTO PARTS DELAWARE DISTRIBUTION CENTER (1675 U.S. 42 SOUTH in DELAWARE, OH)
ENFORCEMENT/COMPLIANCE ACTIVITY (Integrated Compliance Information System) - ICIS-HQ-2004-6001, FORMAL ENFORCEMENT ACTION (Integrated Compliance Information System) - ICIS-HQ-2004-6001, FORMAL ENFORCEMENT ACTION
ADRIAN SUBDIVISION (EAST SIDE POLLUCK ROAD in DELAWARE TOWNSHIP, OH)
STATE MASTER (Ohio general info) - PCS-OH0106348, National Pollutant Discharge Elimination System Permit National Pollutant Discharge Elimination System NON-MAJOR (Tracking pollutant discharge elimination systems) - permit Business SIC classification: SEWERAGE SYSTEMS
BP OIL CO (17 E WILLIAM ST in DELAWARE, OH)
STATE MASTER (Ohio general info) - RCRA-OHD987013281, HAZARDOUS WASTE PROGRAM, -21-5541-168-1, EPCRA Conditionally Exempt Small Quantity Generators, less than 100 kg/month of hazardous waste (Resource Conservation and Recovery Act (tracking hazardous waste)) - notification Organizations: BP OIL COMPANY (CONTACT/OWNER)
BP OIL CO (216 S SANDUSKY in DELAWARE, OH)
STATE MASTER (Ohio general info) - RCRA-OHD987013299, HAZARDOUS WASTE PROGRAM, AIR MAJOR, -21-5541-168-3, EPCRA Conditionally Exempt Small Quantity Generators, less than 100 kg/month of hazardous waste (Resource Conservation and Recovery Act (tracking hazardous waste)) - notification Organizations: BP OIL COMPANY (CONTACT/OWNER)
APPLIANCE PRODUCTS INC (3555 CURTIS ST in DELAWARE, OH)
(Resource Conservation and Recovery Act (tracking hazardous waste))
BENCHMARK WOODWORKS (439 DUNLAP ST in DELAWARE, OH)
Conditionally Exempt Small Quantity Generators, less than 100 kg/month of hazardous waste (Resource Conservation and Recovery Act (tracking hazardous waste)) Organizations: DAN WITT (CONTACT/OWNER)
BLUES AUTO SERVICE INC (711 US HWY 42 N in DELAWARE, OH)
Conditionally Exempt Small Quantity Generators, less than 100 kg/month of hazardous waste (Resource Conservation and Recovery Act (tracking hazardous waste)) - notification Organizations: SHELBY SMITH (CONTACT/OWNER)
Housing units lacking complete plumbing facilities: 0.8% Housing units lacking complete kitchen facilities: 1.1%
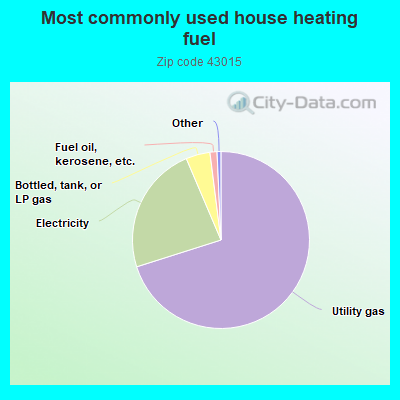
70.1%Utility gas
23.5%Electricity
4.4%Bottled, tank, or LP gas
1.3%Fuel oil, kerosene, etc.
Population in 1990: 29,384. Population change in the 1990s: +7,241 (+24.6%).
Place of birth for U.S.-born residents:
This state: 41,698
Northeast: 3,655
Midwest: 3,242
South: 4,099
West: 1,404
47% of the 43015 zip code residents lived in the same house 5 years ago. Out of people who lived in different houses, 43% lived in this county. Out of people who lived in different counties, 50% lived in Ohio.
88% of the 43015 zip code residents lived in the same house 1 year ago. Out of people who lived in different houses, 40% moved from this county. Out of people who lived in different houses, 42% moved from different county within same state. Out of people who lived in different houses, 13% moved from different state. Out of people who lived in different houses, 7% moved from abroad.
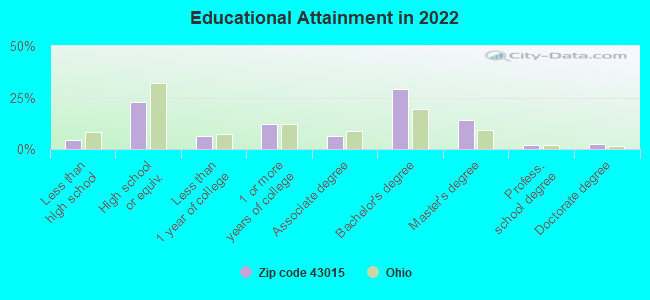
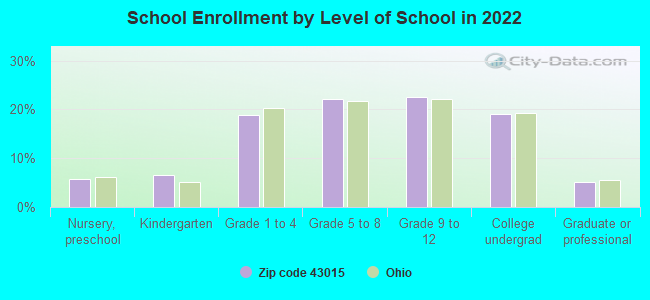
Private vs. public school enrollment:
Students in private schools in grades 1 to 8 (elementary and middle school): 713
Here:
12.2%
Ohio:
16.0%
Students in private schools in grades 9 to 12 (high school): 312
Here:
9.8%
Ohio:
13.1%
Students in private undergraduate colleges: 1,393
Here:
51.7%
Ohio:
22.3%
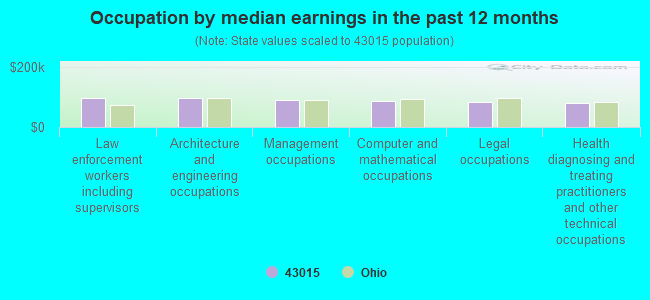
Occupation by median earnings in the past 12 months ($)
96,970Law enforcement workers including supervisors
94,501Architecture and engineering occupations
89,386Management occupations
85,324Computer and mathematical occupations
84,168Legal occupations
78,299Health diagnosing and treating practitioners and other technical occupations
Companies with biggest federal contracts located in this zip code (DELAWARE, OH):
VERNIE MAXINE TRAYLOR (132 COLUMBUS AVENUE; small business) : $143,520 in 64 contractsfrom 2001 to 2006
Contracts for Landscaping/Groundskeeping Services, Custodial Janitorial Services by U.S. Army Corps of Engineers - civil program financing only, Army Signed by year:2000: $0; 2001: $5,945; 2002: $33,100; 2003: $40,155; 2004: $26,540; 2005: $35,460; 2006: $2,320.
Biggest contracts:
$9,750 with U.S. Army Corps of Engineers - civil program financing only for Landscaping/Groundskeeping Services. Signed on 2005-09-21. Completion date: 2005-09-30.
$9,750 with Army for Landscaping/Groundskeeping Services. Signed on 2005-09-21. Completion date: 2005-09-30.
$7,980 with U.S. Army Corps of Engineers - civil program financing only for Custodial Janitorial Services. Signed on 2005-06-15. Completion date: 2005-03-17.
$7,980 with Army for Custodial Janitorial Services. Signed on 2005-06-15. Completion date: 2005-03-17.
OHIO WESLEYAN UNIVERSITY (61 S SANDUSKY ST) : $123,500 in 4 contractsfrom 2003 to 2005
$59,500 with Army for Educational Services. Signed on 2003-06-05. Completion date: 2003-06-05.
$30,000, same as above.Signed on 2005-08-11. Completion date: 2005-08-11.
$17,000, same as above.Signed on 2004-03-15. Completion date: 2004-03-15.
$17,000, same as above.Signed on 2004-07-12. Completion date: 2004-07-12.
BUCKEYE TRACTOR & IMPLEMENT IN (5565 STATE ROUTE 37 E; small business) : $53,384 in 4 contractsfrom 2004 to 2005
$13,584 with Army for Trucks and Truck Tractors, Wheeled. Signed on 2005-09-16. Completion date: 2005-09-30.
$13,584 with U.S. Army Corps of Engineers - civil program financing only for Trucks and Truck Tractors, Wheeled. Signed on 2005-09-16. Completion date: 2005-09-30.
$13,108 with Army for Trucks and Truck Tractors, Wheeled. Signed on 2004-09-07. Completion date: 2004-09-30.
$13,108 with U.S. Army Corps of Engineers - civil program financing only for Trucks and Truck Tractors, Wheeled. Signed on 2004-09-07. Completion date: 2004-09-30.
MICHAEL OLIVER CORPORATION (351 S SANDUSKY ST; small business) : $36,438 in 13 contractsin 2005
Contracts for Lodging - Hotel/Motel by Army Signed by year:2000: $0; 2001: $0; 2002: $0; 2003: $0; 2004: $0; 2005: $36,438; 2006: $0.
Biggest contracts:
$15,847 with Army for Lodging - Hotel/Motel. Signed on 2005-08-05. Completion date: 2005-08-24.
$8,905, same as above.Signed on 2005-07-21. Completion date: 2005-07-24.
$5,650, same as above.Signed on 2005-06-15. Completion date: 2005-06-11.
$4,225, same as above.Signed on 2005-08-02. Completion date: 2005-08-08.
EMPIRE WINDOW OF CENTRAL OHIO (6241 US HIGHWAY 23 NORTH) : $32,814 in 4 contractsfrom 2004 to 2005
$10,060 with Army for Miscellaneous Prefabricated Structures. Signed on 2004-01-07. Completion date: 2004-03-29.
$10,060 with U.S. Army Corps of Engineers - civil program financing only for Miscellaneous Prefabricated Structures. Signed on 2004-01-07. Completion date: 2004-03-29.
$6,347 with U.S. Army Corps of Engineers - civil program financing only for Construction of Structures and Facilities -- Miscellaneous Buildings. Signed on 2005-09-09. Completion date: 2005-08-11.
$6,347 with Army for Construction of Structures and Facilities -- Miscellaneous Buildings. Signed on 2005-09-09. Completion date: 2005-08-11.
IVES GROUP, INC, THE (149 JOHNSON DRIVE; small business)
$10,308 with Army for Office Furniture. Signed on 2006-06-23. Completion date: 2006-06-30.
DAN'S CARPET CARE (398 HEARTHSTONE; small business)
$6,256 with Army for Floor Coverings. Signed on 2005-09-22. Completion date: 2005-09-23.
A B C SEAMLESS OF DELAWARE, LL (3777 STATE RTE 37 W; small business)
$5,289 with Army for Construction of Structures and Facilities -- Other Non-Building Facilities. Signed on 2006-06-13. Completion date: 2006-06-30.
KCB CO (152 TROUTMAN RD; small business) : $4,410 in 2 contractsin 2003
$9,400 with U.S. Army Corps of Engineers - civil program financing only for Miscellaneous Items. Signed on 2003-07-08. Completion date: 2003-08-29.
-$4,990, same as above.Signed on 2003-09-29. Completion date: 2003-09-30.
APPLE MARINE INC (710 SUNBURY RD; small business)
$3,140 with Army for Construction of Structures and Facilities -- Ship Construction and Repair Facilities. Signed on 2004-03-23. Completion date: 2004-04-15.
Top industries in this zip code by the number of employees in 2005:
Educational Services: Colleges, Universities, and Professional Schools (over 1000 employees: 1 establishment, 100-249 employees: 1 establishment)
2002 - 2018 National Fire Incident Reporting System (NFIRS) incidents
According to the data from the years 2002 - 2018 the average number of fires per year is 236. The highest number of fires - 366 took place in 2009, and the least - 156 in 2006. The data has a constant trend.
When looking into fire subcategories, the most reports belonged to: Structure Fires (62.7%), and Outside Fires (23.3%).
Fire incident types reported to NFIRS in Zip Code 43015
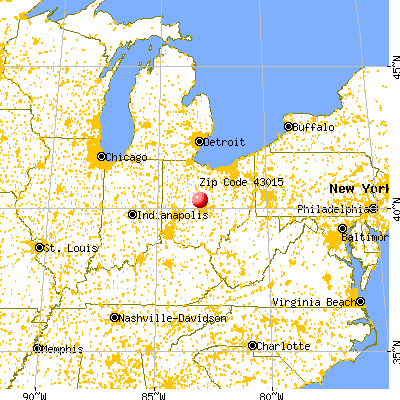


 Nearest zip codes: 43032, 43065, 43035, 43003, 43061, 43066.
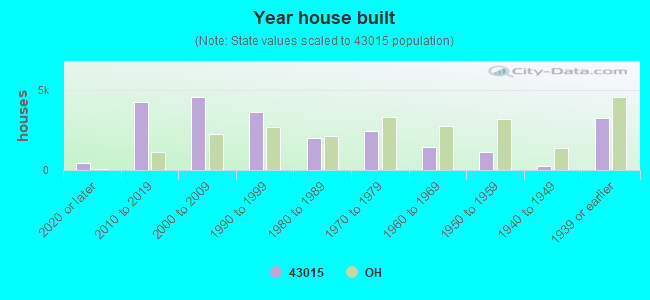


 According to the data from the years 2002 - 2018 the average number of fires per year is 236. The highest number of fires - 366 took place in 2009, and the least - 156 in 2006. The data has a constant trend.
 When looking into fire subcategories, the most reports belonged to: Structure Fires (62.7%), and Outside Fires (23.3%).