Estimated zip code population in 2022: 44,995 Zip code population in 2010: 38,821 Zip code population in 2000: 24,414
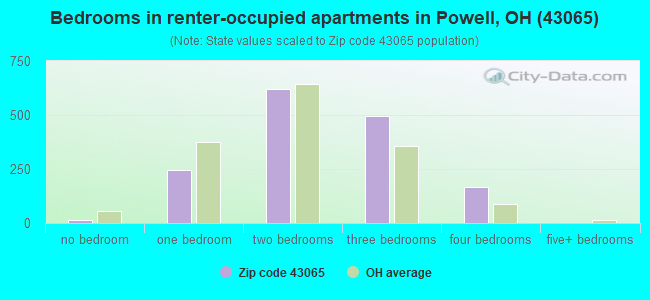
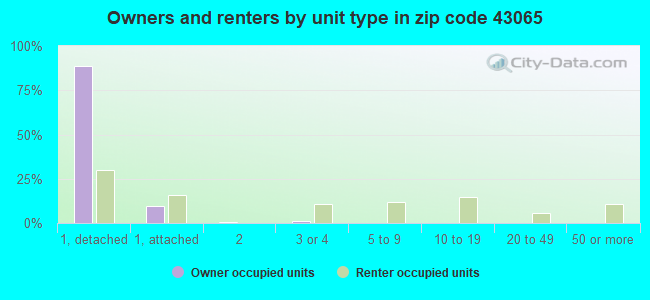
Houses and condos: 17,053 Renter-occupied apartments: 1,546
% of renters here:
9%
State:
33%
March 2022 cost of living index in zip code 43065: 96.7 (near average, U.S. average is 100)
Land area: 28.9 sq. mi. Water area: 0.7 sq. mi.
Population density: 1,558 people per square mile
(low).
OSM Map
General Map
Google Map
MSN Map
OSM Map
General Map
Google Map
MSN Map
OSM Map
General Map
Google Map
MSN Map
OSM Map
General Map
Google Map
MSN Map
Please wait while loading the map...
Real estate property taxes paid for housing units in 2022:
This zip code:
1.7% ($7,890)
Ohio:
1.3% ($2,639)
Median real estate property taxes paid for housing units with mortgages in 2022: $8,084 (1.7%) Median real estate property taxes paid for housing units with no mortgage in 2022: $7,420 (1.6%)
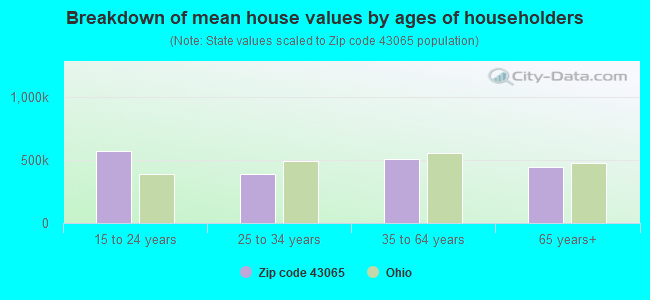
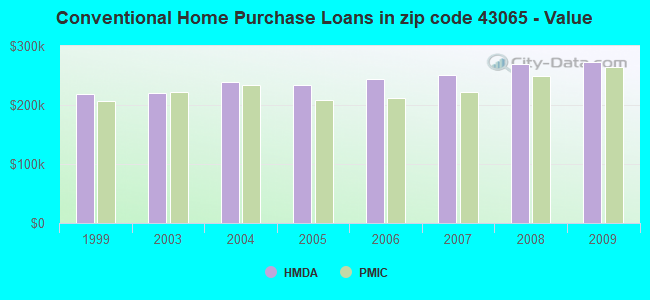
Estimated median house/condo value in 2022: $477,570
43065:
$477,570
Ohio:
$204,100
According to our research of Ohio and other state lists, there were 7 registered sex offenders living in 43065 zip code as of April 27, 2024. The ratio of all residents to sex offenders in zip code 43065 is 5,935 to 1. The ratio of registered sex offenders to all residents in this zip code is much lower than the state average.
Median resident age:
This zip code:
42.2 years
Ohio median age:
39.9 years
Average household size:
This zip code:
2.7 people
Ohio:
2.4 people
Averages for the 2020 tax year for zip code 43065, filed in 2021:
Average Adjusted Gross Income (AGI) in 2020: $144,362 (Individual Income Tax Returns)
Here:
$144,362
State:
$67,288
Salary/wage: $117,616 (reported on 82.6% of returns)
Here:
$117,616
State:
$55,628
(% of AGI for various income ranges: 1075.3% for AGIs below $25k, 3481.0% for AGIs $25k-50k, 6202.4% for AGIs $50k-75k, 9853.9% for AGIs $75k-100k, 20525.5% for AGIs $100k-200k, 95943.9% for AGIs over 200k)
Taxable interest for individuals: $2,094 (reported on 45.0% of returns)
This zip code:
$2,094
Ohio:
$1,518
(% of AGI for various income ranges: 18.1% for AGIs below $25k, 35.2% for AGIs $25k-50k, 81.0% for AGIs $50k-75k, 79.9% for AGIs $75k-100k, 142.3% for AGIs $100k-200k, 1045.2% for AGIs over 200k)
Ordinary dividends: $8,506 (reported on 41.0% of returns)
Here:
$8,506
State:
$7,167
(% of AGI for various income ranges: 58.0% for AGIs below $25k, 99.9% for AGIs $25k-50k, 157.8% for AGIs $50k-75k, 273.2% for AGIs $75k-100k, 484.3% for AGIs $100k-200k, 4261.7% for AGIs over 200k)
Net capital gain/loss in AGI: +$31,593 (reported on 36.9% of returns)
Here:
+$31,593
State:
+$18,919
(% of AGI for various income ranges: 39.8% for AGIs below $25k, 81.1% for AGIs $25k-50k, 184.7% for AGIs $50k-75k, 264.6% for AGIs $75k-100k, 727.3% for AGIs $100k-200k, 18478.4% for AGIs over 200k)
Profit/loss from business: +$26,404 (reported on 17.6% of returns)
Here:
+$26,404
State:
+$13,744
(% of AGI for various income ranges: 131.3% for AGIs below $25k, 250.9% for AGIs $25k-50k, 394.6% for AGIs $50k-75k, 404.2% for AGIs $75k-100k, 735.4% for AGIs $100k-200k, 4852.3% for AGIs over 200k)
Taxable individual retirement arrangement distribution: $29,454 (reported on 12.5% of returns)
43065:
$29,454
Ohio:
$18,876
(% of AGI for various income ranges: 83.4% for AGIs below $25k, 218.8% for AGIs $25k-50k, 392.7% for AGIs $50k-75k, 638.1% for AGIs $75k-100k, 927.4% for AGIs $100k-200k, 2490.7% for AGIs over 200k)
Self-employed (Keogh) retirement plans: $27,043 (reported on 2.2% of returns)
43065:
$27,043
Ohio:
$24,898
(% of AGI for various income ranges: 42.2% for AGIs $50k-75k, 66.8% for AGIs $100k-200k, 849.5% for AGIs over 200k)
Total itemized deductions: $32,571 (reported on 17.1% of returns)
Here:
$32,571
State:
$33,869
(% of AGI for various income ranges: 82.2% for AGIs below $25k, 179.5% for AGIs $25k-50k, 437.4% for AGIs $50k-75k, 665.1% for AGIs $75k-100k, 1093.7% for AGIs $100k-200k, 5496.7% for AGIs over 200k)
Charity contributions: $11,157 (reported on 14.1% of returns)
Here:
$11,157
State:
$14,577
(% of AGI for various income ranges: 6.5% for AGIs below $25k, 20.1% for AGIs $25k-50k, 48.7% for AGIs $50k-75k, 100.9% for AGIs $75k-100k, 212.7% for AGIs $100k-200k, 2076.9% for AGIs over 200k)
Taxes paid: $8,822 (reported on 17.1% of returns)
43065:
$8,822
State:
$7,681
(% of AGI for various income ranges: 17.4% for AGIs below $25k, 50.9% for AGIs $25k-50k, 132.9% for AGIs $50k-75k, 242.9% for AGIs $75k-100k, 346.8% for AGIs $100k-200k, 1263.9% for AGIs over 200k)
Earned income credit: $1,811 (reported on 4.4% of returns)
Here:
$1,811
State:
$2,304
(% of AGI for various income ranges: 32.2% for AGIs below $25k, 39.6% for AGIs $25k-50k, 0.8% for AGIs $50k-75k)
Percentage of individuals using paid preparers for their 2020 taxes: 93.3%
Here:
93%
State:
94%
(% for various income ranges: 90.9% for AGIs below $25k, 93.6% for AGIs $25k-50k, 92.9% for AGIs $50k-75k, 94.1% for AGIs $75k-100k, 94.0% for AGIs $100k-200k, 94.7% for AGIs over 200k)
Averages for the 2012 tax year for zip code 43065, filed in 2013:
Average Adjusted Gross Income (AGI) in 2012: $117,214 (Individual Income Tax Returns)
Here:
$117,214
State:
$54,926
Salary/wage: $96,676 (reported on 86.6% of returns)
Here:
$96,676
State:
$45,869
(% of AGI for various income ranges: 74.0% for AGIs below $25k, 74.8% for AGIs $25k-50k, 75.3% for AGIs $50k-75k, 78.9% for AGIs $75k-100k, 82.9% for AGIs $100k-200k, 62.3% for AGIs over 200k)
Taxable interest for individuals: $1,711 (reported on 47.9% of returns)
This zip code:
$1,711
Ohio:
$1,297
(% of AGI for various income ranges: 1.8% for AGIs below $25k, 0.8% for AGIs $25k-50k, 0.6% for AGIs $50k-75k, 0.6% for AGIs $75k-100k, 0.4% for AGIs $100k-200k, 0.9% for AGIs over 200k)
Ordinary dividends: $7,385 (reported on 38.4% of returns)
Here:
$7,385
State:
$5,821
(% of AGI for various income ranges: 3.4% for AGIs below $25k, 2.0% for AGIs $25k-50k, 1.4% for AGIs $50k-75k, 1.3% for AGIs $75k-100k, 1.4% for AGIs $100k-200k, 3.4% for AGIs over 200k)
Net capital gain/loss in AGI: +$13,287 (reported on 31.7% of returns)
Here:
+$13,287
State:
+$11,232
(% of AGI for various income ranges: 0.4% for AGIs below $25k, 0.2% for AGIs $25k-50k, 0.5% for AGIs $50k-75k, 0.8% for AGIs $75k-100k, 1.2% for AGIs $100k-200k, 6.4% for AGIs over 200k)
Profit/loss from business: +$28,130 (reported on 18.5% of returns)
Here:
+$28,130
State:
+$12,773
(% of AGI for various income ranges: 8.5% for AGIs below $25k, 5.4% for AGIs $25k-50k, 3.3% for AGIs $50k-75k, 3.0% for AGIs $75k-100k, 3.8% for AGIs $100k-200k, 5.0% for AGIs over 200k)
Taxable individual retirement arrangement distribution: $23,924 (reported on 11.9% of returns)
43065:
$23,924
Ohio:
$14,511
(% of AGI for various income ranges: 4.5% for AGIs below $25k, 4.0% for AGIs $25k-50k, 3.3% for AGIs $50k-75k, 3.1% for AGIs $75k-100k, 2.3% for AGIs $100k-200k, 2.1% for AGIs over 200k)
Self-employment retirement plans: $25,130 (reported on 2.3% of returns)
43065:
$25,130
Ohio:
$20,257
(% of AGI for various income ranges: 0.2% for AGIs below $25k, 0.2% for AGIs $50k-75k, 0.1% for AGIs $75k-100k, 0.3% for AGIs $100k-200k, 0.8% for AGIs over 200k)
Total itemized deductions: $30,060 (18% of AGI, reported on 63.0% of returns)
Here:
$30,060
State:
$21,278
Here:
17.8% of AGI
State:
18.8% of AGI
(% of AGI for various income ranges: 17.1% for AGIs below $25k, 15.9% for AGIs $25k-50k, 18.9% for AGIs $50k-75k, 19.0% for AGIs $75k-100k, 18.5% for AGIs $100k-200k, 13.8% for AGIs over 200k)
Charity contributions: $3,957 (reported on 54.0% of returns)
Here:
$3,957
State:
$3,943
(% of AGI for various income ranges: 0.9% for AGIs below $25k, 1.4% for AGIs $25k-50k, 1.8% for AGIs $50k-75k, 1.8% for AGIs $75k-100k, 1.8% for AGIs $100k-200k, 1.9% for AGIs over 200k)
Taxes paid: $16,340 (reported on 62.8% of returns)
43065:
$16,340
State:
$9,568
(% of AGI for various income ranges: 4.9% for AGIs below $25k, 6.2% for AGIs $25k-50k, 8.5% for AGIs $50k-75k, 9.2% for AGIs $75k-100k, 9.8% for AGIs $100k-200k, 8.5% for AGIs over 200k)
Earned income credit: $1,902 (reported on 4.9% of returns)
Here:
$1,902
State:
$2,285
(% of AGI for various income ranges: 2.9% for AGIs below $25k, 0.5% for AGIs $25k-50k)
Percentage of individuals using paid preparers for their 2012 taxes: 49.9%
Here:
50%
State:
51%
(% for various income ranges: 40.2% for AGIs below $25k, 44.8% for AGIs $25k-50k, 53.1% for AGIs $50k-75k, 52.2% for AGIs $75k-100k, 49.5% for AGIs $100k-200k, 69.6% for AGIs over 200k)
Averages for the 2004 tax year for zip code 43065, filed in 2005:
Average Adjusted Gross Income (AGI) in 2004: $93,169 (Individual Income Tax Returns)
Here:
$93,169
State:
$44,480
Salary/wage: $79,231 (reported on 87.9% of returns)
Here:
$79,231
State:
$39,198
(% of AGI for various income ranges: 283.8% for AGIs below $10k, 74.8% for AGIs $10k-25k, 80.3% for AGIs $25k-50k, 82.8% for AGIs $50k-75k, 86.2% for AGIs $75k-100k, 70.1% for AGIs over 100k)
Taxable interest for individuals: $1,866 (reported on 62.5% of returns)
This zip code:
$1,866
Ohio:
$1,532
(% of AGI for various income ranges: 17.1% for AGIs below $10k, 2.8% for AGIs $10k-25k, 1.3% for AGIs $25k-50k, 1.0% for AGIs $50k-75k, 0.9% for AGIs $75k-100k, 1.2% for AGIs over 100k)
Taxable dividends: $3,382 (reported on 42.4% of returns)
Here:
$3,382
State:
$3,496
(% of AGI for various income ranges: 19.4% for AGIs below $10k, 3.1% for AGIs $10k-25k, 1.4% for AGIs $25k-50k, 1.3% for AGIs $50k-75k, 0.9% for AGIs $75k-100k, 1.6% for AGIs over 100k)
Net capital gain/loss: +$12,039 (reported on 36.2% of returns)
Here:
+$12,039
State:
+$8,582
(% of AGI for various income ranges: -15.3% for AGIs below $10k, 0.7% for AGIs $10k-25k, 0.5% for AGIs $25k-50k, 1.3% for AGIs $50k-75k, 0.9% for AGIs $75k-100k, 6.5% for AGIs over 100k)
Profit/loss from business: +$21,904 (reported on 18.4% of returns)
Here:
+$21,904
State:
+$10,813
(% of AGI for various income ranges: 4.4% for AGIs below $10k, 6.9% for AGIs $10k-25k, 4.7% for AGIs $25k-50k, 3.4% for AGIs $50k-75k, 3.9% for AGIs $75k-100k, 4.4% for AGIs over 100k)
IRA payment deduction: $3,189 (reported on 2.6% of returns)
43065:
$3,189
Ohio:
$2,794
(% of AGI for various income ranges: 0.9% for AGIs below $10k, 0.2% for AGIs $10k-25k, 0.3% for AGIs $25k-50k, 0.1% for AGIs $50k-75k, 0.1% for AGIs $75k-100k, 0.1% for AGIs over 100k)
Self-employed pension: $16,369 (reported on 2.8% of returns)
Here:
$16,369
Ohio:
$13,981
(% of AGI for various income ranges: 0.2% for AGIs $25k-50k, 0.2% for AGIs $50k-75k, 0.3% for AGIs $75k-100k, 0.6% for AGIs over 100k)
Total itemized deductions: $25,396 (19% of AGI, reported on 65.8% of returns)
Here:
$25,396
State:
$17,503
Here:
19.5% of AGI
State:
20.8% of AGI
(% of AGI for various income ranges: 49.1% for AGIs below $10k, 19.8% for AGIs $10k-25k, 20.0% for AGIs $25k-50k, 22.0% for AGIs $50k-75k, 21.9% for AGIs $75k-100k, 16.2% for AGIs over 100k)
Charity contributions deductions: $3,522 (3% of AGI, reported on 59.0% of returns)
Here:
$3,522
State:
$3,087
Here:
2.6% of AGI
State:
3.4% of AGI
(% of AGI for various income ranges: 2.7% for AGIs below $10k, 1.5% for AGIs $10k-25k, 2.0% for AGIs $25k-50k, 2.2% for AGIs $50k-75k, 2.1% for AGIs $75k-100k, 2.3% for AGIs over 100k)
Total tax: $18,140 (reported on 85.2% of returns)
43065:
$18,140
State:
$6,781
(% of AGI for various income ranges: 7.5% for AGIs below $10k, 5.2% for AGIs $10k-25k, 8.0% for AGIs $25k-50k, 9.8% for AGIs $50k-75k, 10.3% for AGIs $75k-100k, 20.0% for AGIs over 100k)
Earned income credit: $1,429 (reported on 3.7% of returns)
Here:
$1,429
State:
$1,696
Percentage of individuals using paid preparers for their 2004 taxes: 49.1%
Here:
49%
State:
55%
(% for various income ranges: 38.2% for AGIs below $10k, 42.8% for AGIs $10k-25k, 50.3% for AGIs $25k-50k, 49.4% for AGIs $50k-75k, 47.8% for AGIs $75k-100k, 57.3% for AGIs over 100k)
Likely homosexual households (counted as self-reported same-sex unmarried-partner households)
Lesbian couples: 0.3% of all households
Gay men: 0.0% of all households
Household received Food Stamps/SNAP in the past 12 months: 180 Household did not receive Food Stamps/SNAP in the past 12 months: 16,269
Women who had a birth in the past 12 months: 573 (572 now married, 13 unmarried) Women who did not have a birth in the past 12 months: 9,039 (5,539 now married, 3,493 unmarried)
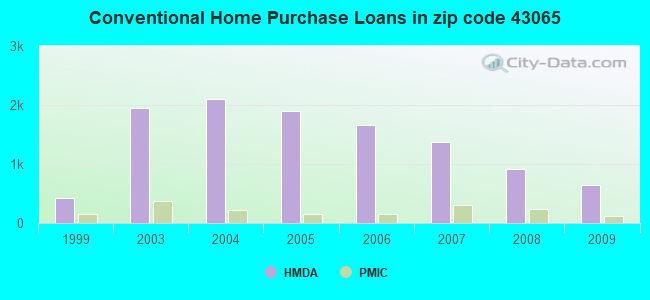
Housing units in zip code 43065 with a mortgage: 10,455 (1,557 second mortgage, 26 home equity loan, 1,529 both second mortgage and home equity loan) Houses without a mortgage: 367
Median monthly owner costs for units with a mortgage: $2,490 Median monthly owner costs for units without a mortgage: $1,036
Residents with income below the poverty level in 2022:
This zip code:
2.6%
Whole state:
13.4%
Residents with income below 50% of the poverty level in 2022:
This zip code:
1.7%
Whole state:
7.0%
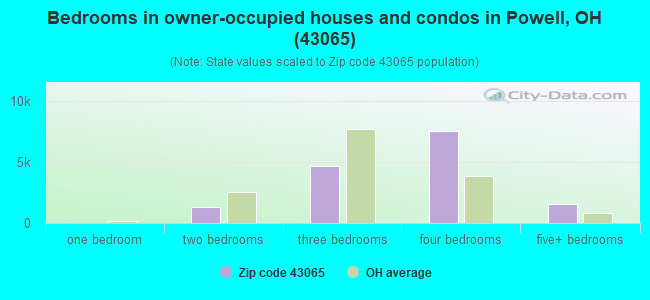
Median number of rooms in houses and condos:
Here:
8.4
State:
6.7
Median number of rooms in apartments:
Here:
5.0
State:
4.4
Notable locations in this zip code not listed on our city pages
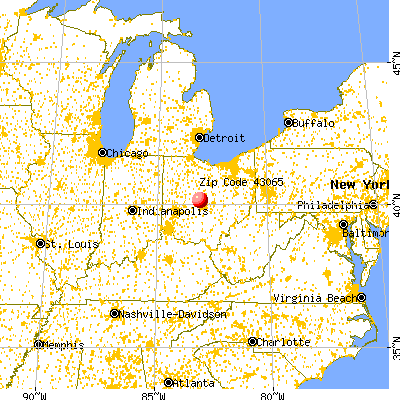
Notable locations in zip code 43065: Big Meadows Picnic Area (A), Double Duros Country Club (B), Huffman Industrial Park (C), Liberty Township Fire Department Station 2 (D), Liberty Township Fire Department Station 1 (E), Shawnee Hills Village Hall (F), Powell Village Hall (G), Liberty Township Community Building (H). Display/hide their locations on the map
In group quarters: 19 (-1 institutionalized population)
Size of family households: 5,400 2-persons, 2,868 3-persons, 3,311 4-persons, 1,141 5-persons, 263 6-persons, 134 7-or-more-persons
Size of nonfamily households: 2,866 1-person, 359 2-persons, 12 3-persons
10,560 married couples with children.
1,013 single-parent households (386 men, 627 women).
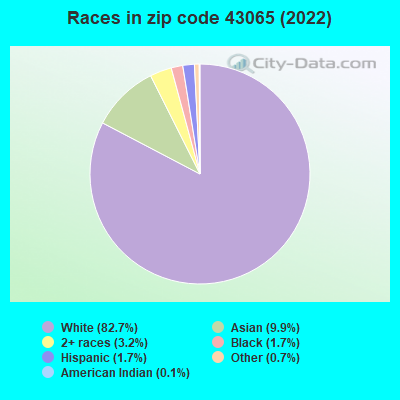
87.7% of residents of 43065 zip code speak English at home.
1.3% of residents speak Spanish at home (76% very well, 22% well, 2% not well).
5.2% of residents speak other Indo-European language at home (76% very well, 20% well, 1% not well, 3% not at all).
5.1% of residents speak Asian or Pacific Island language at home (81% very well, 12% well, 7% not well).
0.6% of residents speak other language at home (100% very well).
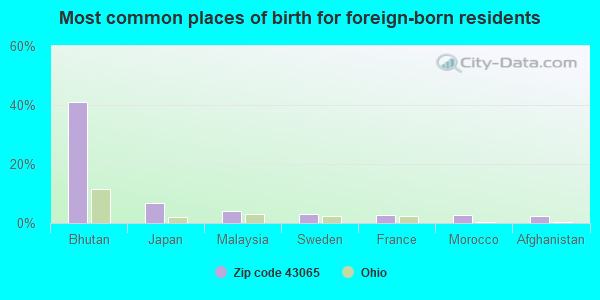
Foreign born population: 4,460 (9.9%) (58.7% of them are naturalized citizens)
This zip code:
9.9%
Whole state:
5.0%
41%Bhutan
7%Japan
4%Malaysia
3%Sweden
3%France
3%Morocco
2%Afghanistan
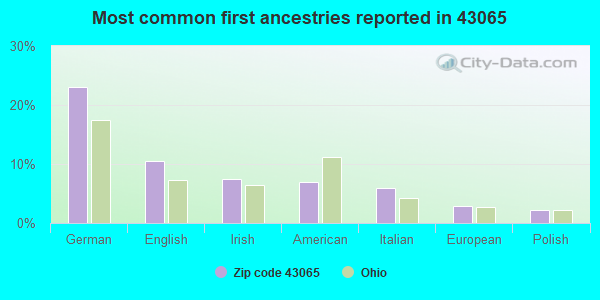
23%German
11%English
7%Irish
7%American
6%Italian
3%European
2%Polish
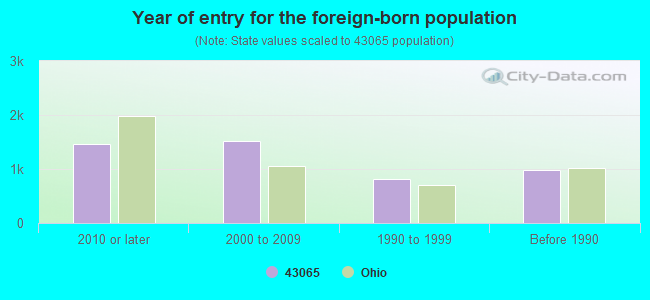
Year of entry for the foreign-born population
1,4632010 or later
1,5152000 to 2009
8081990 to 1999
973Before 1990
Facilities with environmental interests located in this zip code:
ADVANTAGE PAINTING INC (380 NO 3 OLENTANGY ST in POWELL, OH)
STATE MASTER (Ohio general info) - RCRA-OHR000023176, HAZARDOUS WASTE PROGRAM Conditionally Exempt Small Quantity Generators, less than 100 kg/month of hazardous waste (Resource Conservation and Recovery Act (tracking hazardous waste)) - notification Organizations: CHRIS KATONA (CONTACT/OWNER)
AUTO ASSETS INC (378 W OLENTANGY ST in POWELL, OH)
STATE MASTER (Ohio general info) - RCRA-OHR000001172, HAZARDOUS WASTE PROGRAM Small Quantity Generators, between 100 kg and 1000 kg of hazardous waste/month (Resource Conservation and Recovery Act (tracking hazardous waste)) - notification Organizations: STEVE SOUTHARD (CONTACT/OWNER)
CHAPIN S AUTO SERVICE (8454 LIBERTY RD in POWELL, OH)
STATE MASTER (Ohio general info) - RCRA-OHD987044310, HAZARDOUS WASTE PROGRAM Conditionally Exempt Small Quantity Generators, less than 100 kg/month of hazardous waste (Resource Conservation and Recovery Act (tracking hazardous waste)) - notification Organizations: CHAPIN RON (CONTACT/OWNER)
, RON CHAPIN (CONTACT/OWNER)
Alternative names: CHAPIN'S AUTO SERVICE
ALBERT CHAPMAN ELEMENTARY SCH (8450 SAWMILL RD in POWELL, OH)
(National Center for Education Statistics) - STATE ID-099580 Organizations: DUBLIN CITY SD (SCHOOL DISTRICT)
BP FACILITY #22343 (9760 SAWMILL PKWY in POWELL, OH)
Small Quantity Generators, between 100 kg and 1000 kg of hazardous waste/month (Resource Conservation and Recovery Act (tracking hazardous waste)) Organizations: BP PRODUCTS NORTH AMERICA INC (CONTACT/OPERATOR)
Housing units lacking complete plumbing facilities: 0.8% Housing units lacking complete kitchen facilities: 0.5%
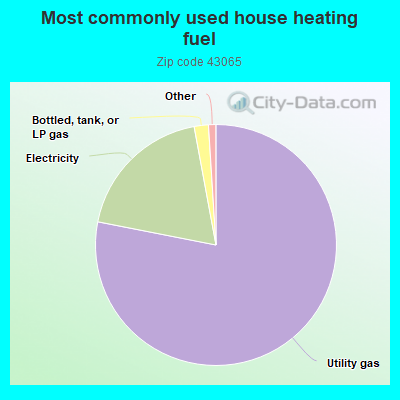
78.1%Utility gas
19.0%Electricity
1.9%Bottled, tank, or LP gas
Population in 1990: 14,955. Population change in the 1990s: +9,459 (+63.2%).
Place of birth for U.S.-born residents:
This state: 28,965
Northeast: 3,509
Midwest: 3,205
South: 3,503
West: 1,055
50% of the 43065 zip code residents lived in the same house 5 years ago. Out of people who lived in different houses, 28% lived in this county. Out of people who lived in different counties, 50% lived in Ohio.
93% of the 43065 zip code residents lived in the same house 1 year ago. Out of people who lived in different houses, 30% moved from this county. Out of people who lived in different houses, 45% moved from different county within same state. Out of people who lived in different houses, 30% moved from different state. Out of people who lived in different houses, 2% moved from abroad.
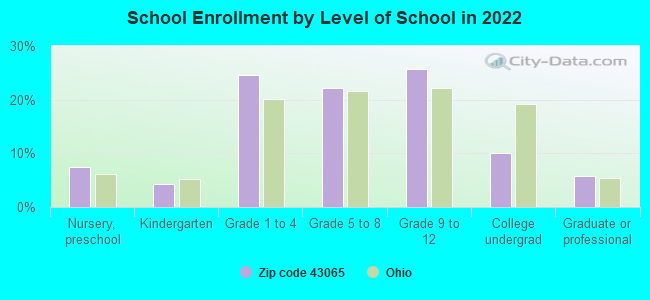
Private vs. public school enrollment:
Students in private schools in grades 1 to 8 (elementary and middle school): 248
Here:
4.5%
Ohio:
16.0%
Students in private schools in grades 9 to 12 (high school): 264
Here:
8.6%
Ohio:
13.1%
Students in private undergraduate colleges: 264
Here:
22.1%
Ohio:
22.3%
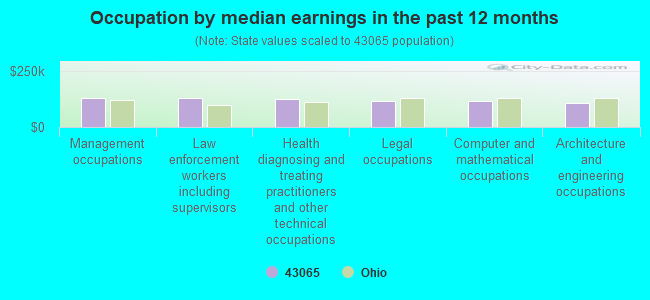
Occupation by median earnings in the past 12 months ($)
131,095Management occupations
128,505Law enforcement workers including supervisors
124,103Health diagnosing and treating practitioners and other technical occupations
115,447Legal occupations
115,047Computer and mathematical occupations
108,095Architecture and engineering occupations
Companies with federal contracts located in this zip code (POWELL, OH):
AEROFLEX POWELL INC (383 N LIBERTY ST) : $4,704,700 in 11 contractsfrom 1999 to 2005
Contracts for Radar Equipment, Except Airborne, Navigational Instruments, Electrical and Electronic Properties Measuring and Testing Instruments, Operation of Government-Owned Facilities -- Radar and Navigational Facilities, and moreby Air Force, Navy, Army Signed by year:2000: $0; 2001: $0; 2002: $1,477,000; 2003: $1,541,800; 2004: $993,700; 2005: $732,200; 2006: $0.
Biggest contracts:
$1,477,000 with Air Force for Radar Equipment, Except Airborne. Signed on 2003-03-31. Completion date: 2004-03-26.
$1,477,000, same as above.Signed on 2002-09-27. Completion date: 2003-09-30.
$475,000 with Navy for Navigational Instruments. Signed on 2004-04-01. Completion date: 2004-12-23.
$441,900, same as above.Signed on 2005-09-30. Completion date: 2005-12-31.
RAEVERN INDUSTRIES, INC (191 W OLENTANGY STREET BL; small business) : $1,843,006 in 42 contractsfrom 1999 to 2002
Contracts for Miscellaneous Vehicular Components, Centrifugals, Separators, and Pressure and Vacuum Filters, Miscellaneous Engine Accessories, Nonaircraft, Vehicular Power Transmission Components, and moreby Defense Logistics Agency Signed by year:2000: $574,688; 2001: $603,611; 2002: $450,959; 2003: $0; 2004: $0; 2005: $0; 2006: $0.
Biggest contracts:
$136,375 with Defense Logistics Agency for Miscellaneous Vehicular Components. Signed on 2000-06-21. Completion date: 2000-09-19.
$116,921, same as above.Signed on 2002-01-03. Completion date: 2003-09-23.
$83,070 with Defense Logistics Agency for Centrifugals, Separators, and Pressure and Vacuum Filters. Taking place in TN. Signed on 2000-03-27. Completion date: 2000-06-05.
$78,350 with Defense Logistics Agency for Miscellaneous Engine Accessories, Nonaircraft. Signed on 2001-09-21. Completion date: 2001-12-27.
COLUMBUS ADVANCED MANUFACTURIN (495 VILLAGE PARK DR; small business) : $848,430 in 2 contractsfrom 2003 to 2004
$749,200 with Air Force for Defense Aircraft -- Basic Research (R&D). Signed on 2004-08-30. Completion date: 2007-01-31.
$99,230, same as above.Signed on 2003-07-14. Completion date: 2004-03-30.
WU, HUASHYR (554 GLENSIDE LN; small business) : $178,230 in 4 contractsfrom 2004 to 2005
$107,810 with Air Force for Programming Services. Signed on 2005-09-27. Completion date: 2006-09-30.
$33,540 with Federal Technology Service for ADP Systems Analysis Services. Taking place in TX. Signed on 2005-04-01. Completion date: 2005-09-30.
$20,110, same as above.Signed on 2004-09-22. Completion date: 2004-12-30.
$16,770, same as above.Signed on 2005-01-28. Completion date: 2005-03-27.
QUAL-X INC (3039 HOME RD; small business) : $146,749 in 11 contractsfrom 2000 to 2006
Contracts for Hazardous Substance Removal, Cleanup, and Disposal Services and Operational Support by Air Force Signed by year:2000: $30,612; 2001: $7,748; 2002: $30,397; 2003: $30,278; 2004: $38,521; 2005: $2,333; 2006: $6,860.
Biggest contracts:
$38,521 with Air Force for Hazardous Substance Removal, Cleanup, and Disposal Services and Operational Support. Signed on 2004-03-01. Completion date: 2006-03-31.
$38,360, same as above.Signed on 2001-03-28. Completion date: 2002-03-31.
$30,612, same as above.Signed on 2000-10-18. Completion date: 2001-03-31.
$30,397, same as above.Signed on 2002-03-18. Completion date: 2003-03-31.
GFS CHEMICALS, INC (3041 HOME RD; small business) : $133,412 in 28 contractsfrom 2003 to 2006
Contracts for Laboratory Equipment and Supplies, Chemicals, Combination and Miscellaneous Instruments, Geophysical Instruments, and moreby National Institute of Standards and Technology, Centers for Disease Control and Prevention, Army, Navy, and others Signed by year:2000: $0; 2001: $0; 2002: $0; 2003: $37,819; 2004: $29,950; 2005: $56,470; 2006: $9,173.
Biggest contracts:
$34,000 with National Institute of Standards and Technology for Laboratory Equipment and Supplies. Taking place in MD. Signed on 2003-08-15. Completion date: 2004-09-15.
$32,776 with Centers for Disease Control and Prevention for Chemicals. Signed on 2005-08-10. Completion date: 2005-08-31.
$16,460, same as above.Signed on 2004-11-08. Completion date: 2005-01-05.
$7,500 with Army for Chemicals. Signed on 2005-07-12. Completion date: 2005-09-30.
HYDROPURE TECHNOLOGIES, LLC (537 WINDRIDGE CT; small business) 2 employees, $200000 revenue. : $100,000 in 2 contractsfrom 2002 to 2003
$100,000 with EPA for Pollution Control and Abatement -- Basic Research (R&D). Signed on 2002-09-15. Completion date: 2003-07-15.
$0, same as above.Signed on 2003-06-16. Completion date: 2003-07-31.
INTECH R & D INTERNATIONAL (1950 ABBOTSFORD GREEN DR; small business)
$7,700 with Army for Bridges, Fixed and Floating. Signed on 2004-04-21. Completion date: 2004-07-30.
cOLUMBUS POWER CLEANING (P.O. BOX 994; small business)
$1,000 with Public Buildings Service for Custodial Janitorial Services. Signed on 2005-09-28. Completion date: 2005-10-28.
Top industries in this zip code by the number of employees in 2005:
2002 - 2018 National Fire Incident Reporting System (NFIRS) incidents
According to the data from the years 2002 - 2018 the average number of fire incidents per year is 76. The highest number of fire incidents - 119 took place in 2003, and the least - 47 in 2015. The data has a declining trend.
When looking into fire subcategories, the most reports belonged to: Structure Fires (52.1%), and Outside Fires (33.3%).
Fire incident types reported to NFIRS in Zip Code 43065


 Nearest zip codes: 43017, 43235, 43016, 43035, 43085, 43240.
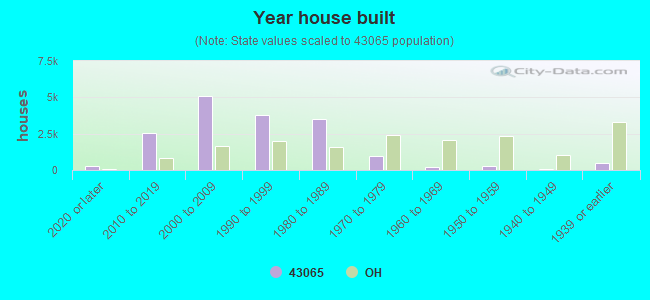


 According to the data from the years 2002 - 2018 the average number of fire incidents per year is 76. The highest number of fire incidents - 119 took place in 2003, and the least - 47 in 2015. The data has a declining trend.
 When looking into fire subcategories, the most reports belonged to: Structure Fires (52.1%), and Outside Fires (33.3%).