Estimated zip code population in 2022: 44,022 Zip code population in 2010: 31,306 Zip code population in 2000: 18,908
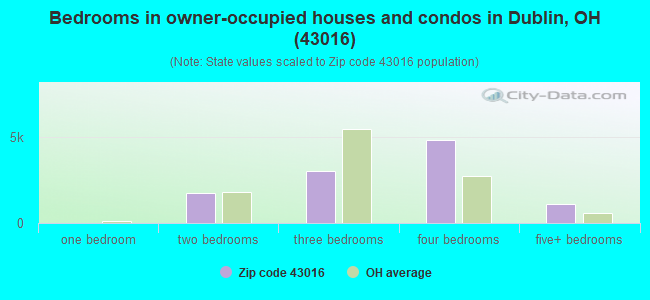
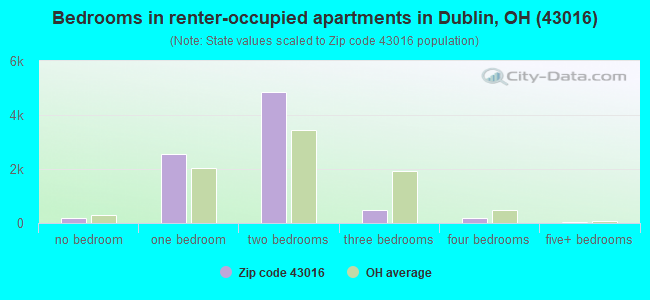
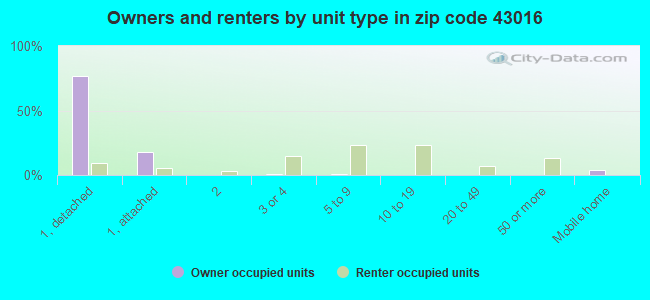
Houses and condos: 19,973 Renter-occupied apartments: 8,194
% of renters here:
44%
State:
33%
March 2022 cost of living index in zip code 43016: 97.2 (near average, U.S. average is 100)
Land area: 18.1 sq. mi. Water area: 0.2 sq. mi.
Population density: 2,432 people per square mile
(low).
OSM Map
General Map
Google Map
MSN Map
OSM Map
General Map
Google Map
MSN Map
OSM Map
General Map
Google Map
MSN Map
OSM Map
General Map
Google Map
MSN Map
Please wait while loading the map...
Real estate property taxes paid for housing units in 2022:
This zip code:
1.7% ($7,402)
Ohio:
1.3% ($2,639)
Median real estate property taxes paid for housing units with mortgages in 2022: $7,898 (1.8%) Median real estate property taxes paid for housing units with no mortgage in 2022: $6,795 (1.7%)
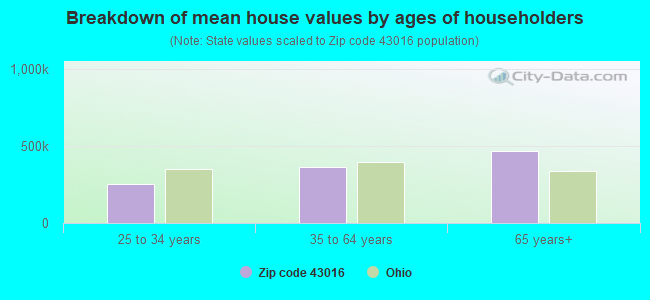
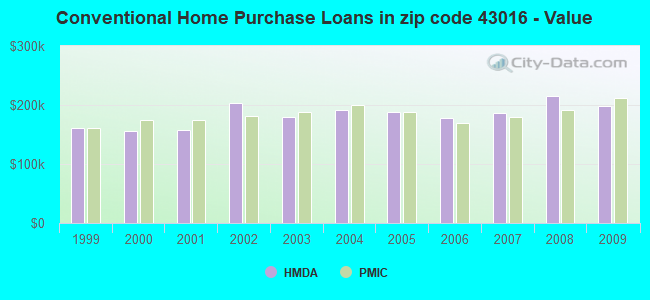
Estimated median house/condo value in 2022: $429,467
43016:
$429,467
Ohio:
$204,100
According to our research of Ohio and other state lists, there were 10 registered sex offenders living in 43016 zip code as of April 27, 2024. The ratio of all residents to sex offenders in zip code 43016 is 3,525 to 1. The ratio of registered sex offenders to all residents in this zip code is much lower than the state average.
Median resident age:
This zip code:
38.8 years
Ohio median age:
39.9 years
Average household size:
This zip code:
2.3 people
Ohio:
2.4 people
Averages for the 2020 tax year for zip code 43016, filed in 2021:
Average Adjusted Gross Income (AGI) in 2020: $110,313 (Individual Income Tax Returns)
Here:
$110,313
State:
$67,288
Salary/wage: $91,240 (reported on 86.3% of returns)
Here:
$91,240
State:
$55,628
(% of AGI for various income ranges: 1186.0% for AGIs below $25k, 3871.2% for AGIs $25k-50k, 6885.1% for AGIs $50k-75k, 10386.3% for AGIs $75k-100k, 19620.7% for AGIs $100k-200k, 87433.2% for AGIs over 200k)
Taxable interest for individuals: $1,664 (reported on 36.3% of returns)
This zip code:
$1,664
Ohio:
$1,518
(% of AGI for various income ranges: 12.0% for AGIs below $25k, 18.4% for AGIs $25k-50k, 34.8% for AGIs $50k-75k, 55.3% for AGIs $75k-100k, 98.2% for AGIs $100k-200k, 988.8% for AGIs over 200k)
Ordinary dividends: $5,576 (reported on 32.1% of returns)
Here:
$5,576
State:
$7,167
(% of AGI for various income ranges: 34.5% for AGIs below $25k, 53.8% for AGIs $25k-50k, 120.2% for AGIs $50k-75k, 133.4% for AGIs $75k-100k, 376.7% for AGIs $100k-200k, 2663.3% for AGIs over 200k)
Net capital gain/loss in AGI: +$27,106 (reported on 29.3% of returns)
Here:
+$27,106
State:
+$18,919
(% of AGI for various income ranges: 22.6% for AGIs below $25k, 47.6% for AGIs $25k-50k, 92.7% for AGIs $50k-75k, 178.8% for AGIs $75k-100k, 570.9% for AGIs $100k-200k, 19065.7% for AGIs over 200k)
Profit/loss from business: +$19,113 (reported on 15.8% of returns)
Here:
+$19,113
State:
+$13,744
(% of AGI for various income ranges: 137.8% for AGIs below $25k, 178.1% for AGIs $25k-50k, 199.5% for AGIs $50k-75k, 283.5% for AGIs $75k-100k, 677.5% for AGIs $100k-200k, 3592.0% for AGIs over 200k)
Taxable individual retirement arrangement distribution: $24,887 (reported on 8.8% of returns)
43016:
$24,887
Ohio:
$18,876
(% of AGI for various income ranges: 60.2% for AGIs below $25k, 108.7% for AGIs $25k-50k, 176.4% for AGIs $50k-75k, 304.0% for AGIs $75k-100k, 676.6% for AGIs $100k-200k, 1905.0% for AGIs over 200k)
Self-employed (Keogh) retirement plans: $24,377 (reported on 1.1% of returns)
43016:
$24,377
Ohio:
$24,898
(% of AGI for various income ranges: 16.1% for AGIs $50k-75k, 52.3% for AGIs $100k-200k, 530.2% for AGIs over 200k)
Total itemized deductions: $30,857 (reported on 11.8% of returns)
Here:
$30,857
State:
$33,869
(% of AGI for various income ranges: 68.7% for AGIs below $25k, 81.1% for AGIs $25k-50k, 260.4% for AGIs $50k-75k, 436.8% for AGIs $75k-100k, 856.8% for AGIs $100k-200k, 4841.8% for AGIs over 200k)
Charity contributions: $10,921 (reported on 9.5% of returns)
Here:
$10,921
State:
$14,577
(% of AGI for various income ranges: 5.1% for AGIs below $25k, 10.4% for AGIs $25k-50k, 31.5% for AGIs $50k-75k, 58.0% for AGIs $75k-100k, 188.1% for AGIs $100k-200k, 1965.2% for AGIs over 200k)
Taxes paid: $8,755 (reported on 11.8% of returns)
43016:
$8,755
State:
$7,681
(% of AGI for various income ranges: 14.0% for AGIs below $25k, 20.0% for AGIs $25k-50k, 90.0% for AGIs $50k-75k, 171.3% for AGIs $75k-100k, 289.6% for AGIs $100k-200k, 1097.7% for AGIs over 200k)
Earned income credit: $1,919 (reported on 6.0% of returns)
Here:
$1,919
State:
$2,304
(% of AGI for various income ranges: 44.9% for AGIs below $25k, 34.9% for AGIs $25k-50k)
Percentage of individuals using paid preparers for their 2020 taxes: 93.8%
Here:
94%
State:
94%
(% for various income ranges: 91.4% for AGIs below $25k, 94.7% for AGIs $25k-50k, 94.8% for AGIs $50k-75k, 94.5% for AGIs $75k-100k, 93.9% for AGIs $100k-200k, 94.6% for AGIs over 200k)
Averages for the 2012 tax year for zip code 43016, filed in 2013:
Average Adjusted Gross Income (AGI) in 2012: $90,831 (Individual Income Tax Returns)
Here:
$90,831
State:
$54,926
Salary/wage: $80,424 (reported on 90.5% of returns)
Here:
$80,424
State:
$45,869
(% of AGI for various income ranges: 82.4% for AGIs below $25k, 86.0% for AGIs $25k-50k, 86.4% for AGIs $50k-75k, 86.5% for AGIs $75k-100k, 85.9% for AGIs $100k-200k, 69.4% for AGIs over 200k)
Taxable interest for individuals: $947 (reported on 40.6% of returns)
This zip code:
$947
Ohio:
$1,297
(% of AGI for various income ranges: 1.1% for AGIs below $25k, 0.4% for AGIs $25k-50k, 0.3% for AGIs $50k-75k, 0.4% for AGIs $75k-100k, 0.4% for AGIs $100k-200k, 0.5% for AGIs over 200k)
Ordinary dividends: $5,000 (reported on 29.8% of returns)
Here:
$5,000
State:
$5,821
(% of AGI for various income ranges: 2.1% for AGIs below $25k, 0.9% for AGIs $25k-50k, 0.9% for AGIs $50k-75k, 1.0% for AGIs $75k-100k, 1.2% for AGIs $100k-200k, 2.6% for AGIs over 200k)
Net capital gain/loss in AGI: +$12,084 (reported on 24.3% of returns)
Here:
+$12,084
State:
+$11,232
(% of AGI for various income ranges: 0.1% for AGIs $25k-50k, 0.1% for AGIs $50k-75k, 0.4% for AGIs $75k-100k, 0.9% for AGIs $100k-200k, 8.2% for AGIs over 200k)
Profit/loss from business: +$20,005 (reported on 14.2% of returns)
Here:
+$20,005
State:
+$12,773
(% of AGI for various income ranges: 6.2% for AGIs below $25k, 2.9% for AGIs $25k-50k, 2.4% for AGIs $50k-75k, 2.5% for AGIs $75k-100k, 2.7% for AGIs $100k-200k, 3.7% for AGIs over 200k)
Taxable individual retirement arrangement distribution: $18,391 (reported on 8.3% of returns)
43016:
$18,391
Ohio:
$14,511
(% of AGI for various income ranges: 2.6% for AGIs below $25k, 1.9% for AGIs $25k-50k, 1.9% for AGIs $50k-75k, 2.0% for AGIs $75k-100k, 1.8% for AGIs $100k-200k, 1.2% for AGIs over 200k)
Self-employment retirement plans: $20,458 (reported on 1.4% of returns)
43016:
$20,458
Ohio:
$20,257
(% of AGI for various income ranges: 0.3% for AGIs $50k-75k, 0.3% for AGIs $100k-200k, 0.6% for AGIs over 200k)
Total itemized deductions: $26,446 (18% of AGI, reported on 49.4% of returns)
Here:
$26,446
State:
$21,278
Here:
18.3% of AGI
State:
18.8% of AGI
(% of AGI for various income ranges: 9.9% for AGIs below $25k, 9.0% for AGIs $25k-50k, 12.9% for AGIs $50k-75k, 15.5% for AGIs $75k-100k, 17.1% for AGIs $100k-200k, 13.8% for AGIs over 200k)
Charity contributions: $3,351 (reported on 40.9% of returns)
Here:
$3,351
State:
$3,943
(% of AGI for various income ranges: 0.7% for AGIs below $25k, 0.8% for AGIs $25k-50k, 1.1% for AGIs $50k-75k, 1.4% for AGIs $75k-100k, 1.7% for AGIs $100k-200k, 1.8% for AGIs over 200k)
Taxes paid: $14,528 (reported on 49.4% of returns)
43016:
$14,528
State:
$9,568
(% of AGI for various income ranges: 3.7% for AGIs below $25k, 3.2% for AGIs $25k-50k, 5.7% for AGIs $50k-75k, 7.6% for AGIs $75k-100k, 9.4% for AGIs $100k-200k, 8.9% for AGIs over 200k)
Earned income credit: $1,763 (reported on 5.5% of returns)
Here:
$1,763
State:
$2,285
(% of AGI for various income ranges: 2.8% for AGIs below $25k, 0.3% for AGIs $25k-50k)
Percentage of individuals using paid preparers for their 2012 taxes: 44.8%
Here:
45%
State:
51%
(% for various income ranges: 38.1% for AGIs below $25k, 37.7% for AGIs $25k-50k, 46.8% for AGIs $50k-75k, 47.9% for AGIs $75k-100k, 46.4% for AGIs $100k-200k, 68.9% for AGIs over 200k)
Averages for the 2004 tax year for zip code 43016, filed in 2005:
Average Adjusted Gross Income (AGI) in 2004: $66,477 (Individual Income Tax Returns)
Here:
$66,477
State:
$44,480
Salary/wage: $61,759 (reported on 90.5% of returns)
Here:
$61,759
State:
$39,198
(% of AGI for various income ranges: 135.4% for AGIs below $10k, 85.1% for AGIs $10k-25k, 87.5% for AGIs $25k-50k, 88.2% for AGIs $50k-75k, 91.0% for AGIs $75k-100k, 79.1% for AGIs over 100k)
Taxable interest for individuals: $1,134 (reported on 53.5% of returns)
This zip code:
$1,134
Ohio:
$1,532
(% of AGI for various income ranges: 5.1% for AGIs below $10k, 1.9% for AGIs $10k-25k, 1.1% for AGIs $25k-50k, 0.8% for AGIs $50k-75k, 0.6% for AGIs $75k-100k, 0.9% for AGIs over 100k)
Taxable dividends: $3,093 (reported on 33.4% of returns)
Here:
$3,093
State:
$3,496
(% of AGI for various income ranges: 4.9% for AGIs below $10k, 1.8% for AGIs $10k-25k, 0.9% for AGIs $25k-50k, 0.8% for AGIs $50k-75k, 0.8% for AGIs $75k-100k, 2.1% for AGIs over 100k)
Net capital gain/loss: +$6,055 (reported on 28.1% of returns)
Here:
+$6,055
State:
+$8,582
(% of AGI for various income ranges: -3.3% for AGIs below $10k, 0.4% for AGIs $10k-25k, 0.5% for AGIs $25k-50k, 0.7% for AGIs $50k-75k, 0.5% for AGIs $75k-100k, 4.5% for AGIs over 100k)
Profit/loss from business: +$16,586 (reported on 14.2% of returns)
Here:
+$16,586
State:
+$10,813
(% of AGI for various income ranges: 1.0% for AGIs below $10k, 4.4% for AGIs $10k-25k, 2.9% for AGIs $25k-50k, 2.7% for AGIs $50k-75k, 2.6% for AGIs $75k-100k, 4.2% for AGIs over 100k)
IRA payment deduction: $2,983 (reported on 2.3% of returns)
43016:
$2,983
Ohio:
$2,794
(% of AGI for various income ranges: 0.4% for AGIs below $10k, 0.2% for AGIs $10k-25k, 0.2% for AGIs $25k-50k, 0.1% for AGIs $50k-75k, 0.1% for AGIs $75k-100k, 0.1% for AGIs over 100k)
Self-employed pension: $14,240 (reported on 1.5% of returns)
Here:
$14,240
Ohio:
$13,981
(% of AGI for various income ranges: 0.1% for AGIs $25k-50k, 0.1% for AGIs $50k-75k, 0.2% for AGIs $75k-100k, 0.5% for AGIs over 100k)
Total itemized deductions: $21,639 (21% of AGI, reported on 50.5% of returns)
Here:
$21,639
State:
$17,503
Here:
20.6% of AGI
State:
20.8% of AGI
(% of AGI for various income ranges: 12.9% for AGIs below $10k, 11.1% for AGIs $10k-25k, 10.6% for AGIs $25k-50k, 16.9% for AGIs $50k-75k, 19.8% for AGIs $75k-100k, 17.2% for AGIs over 100k)
Charity contributions deductions: $2,611 (2% of AGI, reported on 44.1% of returns)
Here:
$2,611
State:
$3,087
Here:
2.4% of AGI
State:
3.4% of AGI
(% of AGI for various income ranges: 0.7% for AGIs below $10k, 0.9% for AGIs $10k-25k, 1.0% for AGIs $25k-50k, 1.6% for AGIs $50k-75k, 1.9% for AGIs $75k-100k, 2.0% for AGIs over 100k)
Total tax: $10,676 (reported on 85.9% of returns)
43016:
$10,676
State:
$6,781
(% of AGI for various income ranges: 3.2% for AGIs below $10k, 5.3% for AGIs $10k-25k, 9.1% for AGIs $25k-50k, 10.6% for AGIs $50k-75k, 10.7% for AGIs $75k-100k, 17.6% for AGIs over 100k)
Earned income credit: $1,380 (reported on 4.6% of returns)
Here:
$1,380
State:
$1,696
Percentage of individuals using paid preparers for their 2004 taxes: 43.6%
Here:
44%
State:
55%
(% for various income ranges: 35.8% for AGIs below $10k, 38.4% for AGIs $10k-25k, 42.0% for AGIs $25k-50k, 46.3% for AGIs $50k-75k, 45.6% for AGIs $75k-100k, 51.8% for AGIs over 100k)
Likely homosexual households (counted as self-reported same-sex unmarried-partner households)
Lesbian couples: 0.1% of all households
Gay men: 0.0% of all households
Household received Food Stamps/SNAP in the past 12 months: 502 Household did not receive Food Stamps/SNAP in the past 12 months: 18,310
Women who had a birth in the past 12 months: 629 (566 now married, 72 unmarried) Women who did not have a birth in the past 12 months: 9,828 (5,334 now married, 4,489 unmarried)
Housing units in zip code 43016 with a mortgage: 7,060 (1,233 second mortgage, 18 home equity loan, 1,058 both second mortgage and home equity loan) Houses without a mortgage: 189
Median monthly owner costs for units with a mortgage: $2,330 Median monthly owner costs for units without a mortgage: $992
Residents with income below the poverty level in 2022:
This zip code:
6.0%
Whole state:
13.4%
Residents with income below 50% of the poverty level in 2022:
This zip code:
5.1%
Whole state:
7.0%
Median number of rooms in houses and condos:
Here:
7.9
State:
6.7
Median number of rooms in apartments:
Here:
3.6
State:
4.4
Notable locations in this zip code not listed on our city pages
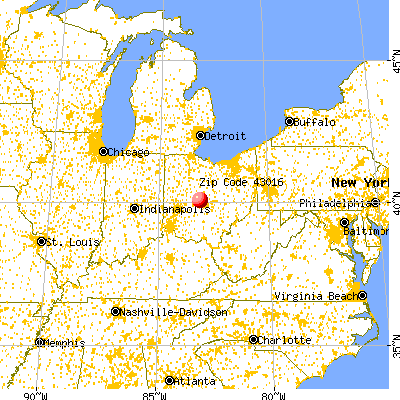
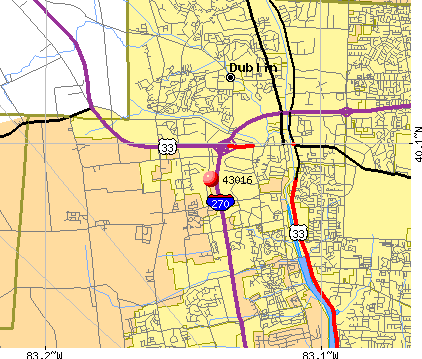
Notable locations in zip code 43016: Rivieria Country Club (A), Corporate Park of Dublin (B), Fishel Industrial Park (C), Dublin Technical Center (D), Dublin Industrial Park (E), Washington Township Fire Department and Emergency Medical Services Station 91 (F). Display/hide their locations on the map
7,875 married couples with children.
2,240 single-parent households (334 men, 1,906 women).
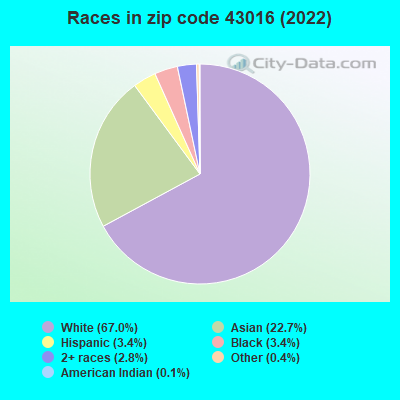
76.2% of residents of 43016 zip code speak English at home.
1.5% of residents speak Spanish at home (74% very well, 20% well, 6% not well).
9.7% of residents speak other Indo-European language at home (80% very well, 17% well, 3% not well).
10.3% of residents speak Asian or Pacific Island language at home (64% very well, 19% well, 10% not well, 7% not at all).
1.9% of residents speak other language at home (79% very well, 11% well, 10% not well, 1% not at all).
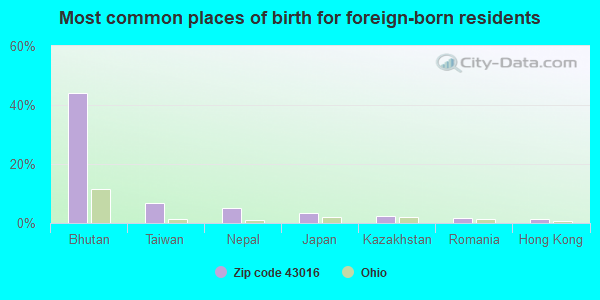
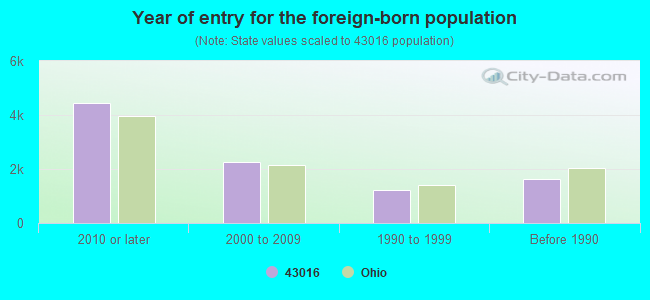
Foreign born population: 8,825 (20.0%) (49.8% of them are naturalized citizens)
Facilities with environmental interests located in this zip code:
ASHLAND CHEMICAL CO * (6211 AVERY ROAD in DUBLIN, OH)
STATE MASTER (Ohio general info) - RCRA-OHD980899587, HAZARDOUS WASTE PROGRAM STATE MASTER (Ohio general info) - AIR MAJOR (Resource Conservation and Recovery Act (tracking hazardous waste)) Business SIC classification: TESTING LABORATORIES Organizations: ASHLAND CHEMICAL INCORPORATED (CONTACT/OWNER)
, ASHLAND CHEMICAL INC (CONTACT/OWNER)
ANN SIMPSON DAVIS MIDDLE SCHO (2400 SUTTER PKWY in DUBLIN, OH)
(National Center for Education Statistics) - STATE ID-098475 Organizations: DUBLIN CITY SD (SCHOOL DISTRICT)
Housing units lacking complete plumbing facilities: 0.6% Housing units lacking complete kitchen facilities: 0.8%
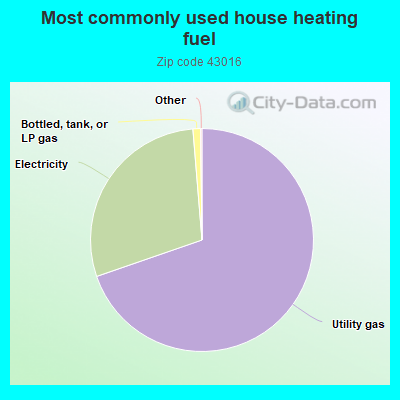
69.7%Utility gas
29.0%Electricity
1.1%Bottled, tank, or LP gas
Place of birth for U.S.-born residents:
This state: 23,997
Northeast: 2,998
Midwest: 2,795
South: 3,661
West: 1,342
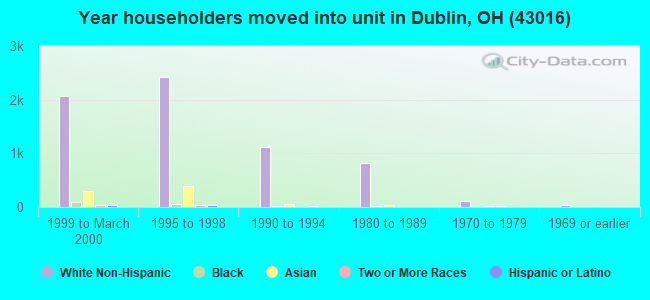
40% of the 43016 zip code residents lived in the same house 5 years ago. Out of people who lived in different houses, 54% lived in this county. Out of people who lived in different counties, 50% lived in Ohio.
86% of the 43016 zip code residents lived in the same house 1 year ago. Out of people who lived in different houses, 51% moved from this county. Out of people who lived in different houses, 15% moved from different county within same state. Out of people who lived in different houses, 19% moved from different state. Out of people who lived in different houses, 16% moved from abroad.
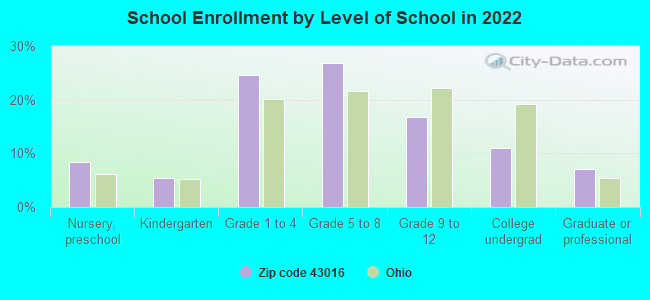
Private vs. public school enrollment:
Students in private schools in grades 1 to 8 (elementary and middle school): 1,019
Here:
19.4%
Ohio:
16.0%
Students in private schools in grades 9 to 12 (high school): 69
Here:
4.0%
Ohio:
13.1%
Students in private undergraduate colleges: 191
Here:
17.0%
Ohio:
22.3%
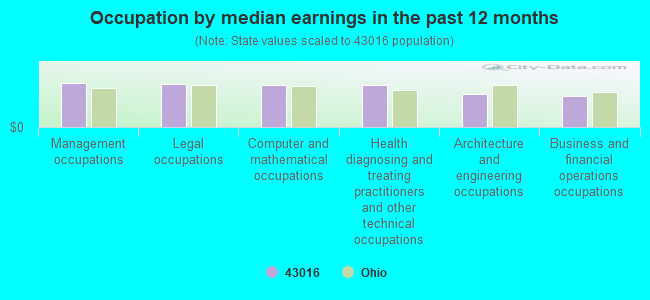
Occupation by median earnings in the past 12 months ($)
105,787Management occupations
103,166Legal occupations
102,109Computer and mathematical occupations
101,196Health diagnosing and treating practitioners and other technical occupations
80,476Architecture and engineering occupations
74,664Business and financial operations occupations
Companies with biggest federal contracts located in this zip code (DUBLIN, OH):
GUILD ASSOCIATES INC (5750 SHIER-RINGS RD; small business) : $108,069,452 in 165 contractsfrom 1999 to 2006
Contracts for Laundry and Dry Cleaning Equipment, Miscellaneous Items, Memorials: Cemeterial and Mortuary Equipment and Supplies, Other Defense -- Applied Research and Exploratory Development (R&D), and moreby Army, Air Force, Defense Threat Reduction Agency, Department of Defense, and others Signed by year:2000: $2,358,653; 2001: $6,160,843; 2002: $35,073,335; 2003: $40,732,588; 2004: $13,590,756; 2005: $6,555,008; 2006: $3,123,269.
Biggest contracts:
$20,917,703 with Army for Laundry and Dry Cleaning Equipment. Signed on 2003-03-04. Completion date: 2005-12-30.
$11,287,212, same as above.Signed on 2002-01-31. Completion date: 2002-08-03.
$8,767,468, same as above.Signed on 2002-06-27. Completion date: 2002-08-03.
$6,837,100 with Army for Miscellaneous Items. Signed on 2002-03-14. Completion date: 2003-04-30.
LSP TECHNOLOGIES, INC (6145 SCHERERS PL STE B; small business) : $13,115,114 in 36 contractsfrom 1999 to 2006
Contracts for Manufacturing Technology -- Operational Systems Development (R&D), Defense Aircraft -- Operational Systems Development (R&D), Manufacturing Technology -- Management and Support (R&D), Defense Electronics and Communication Equipment -- Basic Research (R&D), and moreby Air Force, Army, Navy Signed by year:2000: $2,847,409; 2001: $1,293,000; 2002: $2,562,705; 2003: $2,203,000; 2004: $439,000; 2005: $2,645,000; 2006: $375,000.
Biggest contracts:
$1,733,000 with Air Force for Manufacturing Technology -- Operational Systems Development (R&D). Signed on 2003-04-02. Completion date: 2004-10-30.
$1,153,000 with Air Force for Defense Aircraft -- Operational Systems Development (R&D). Signed on 2002-06-07. Completion date: 2003-06-30.
$870,000 with Air Force for Manufacturing Technology -- Operational Systems Development (R&D). Signed on 2005-01-27. Completion date: 2006-12-31.
$750,000, same as above.Signed on 2000-01-11. Completion date: 2002-06-30.
AMERICAN APEX CORPORATION (5995 SHIER RINGS ROAD; small business) : $3,284,353 in 24 contractsfrom 1999 to 2005
Contracts for Guns, through 30 mm, Miscellaneous Weapons, Armament Training Devices, Training Aids, and moreby Army, Defense Logistics Agency Signed by year:2000: $622,100; 2001: $290,715; 2002: $617,120; 2003: $683,366; 2004: $30,052; 2005: $891,000; 2006: $0.
Biggest contracts:
$787,000 with Army for Guns, through 30 mm. Signed on 2005-01-18. Completion date: 2005-04-08.
$533,966 with Army for Miscellaneous Weapons. Signed on 2003-07-21. Completion date: 2004-12-31.
$226,200 with Army for Armament Training Devices. Taking place in CO. Signed on 2002-09-29. Completion date: 2002-10-31.
$200,000 with Defense Logistics Agency for Guns, through 30 mm. Signed on 2000-07-06. Completion date: 2000-07-27.
HERMAN ADVANCED ENGINEERING, I (4337 WYANDOTTE WOODS BLVD; small business) : $669,817 in 4 contractsfrom 2004 to 2005
$500,000 with Navy for Defense Electronics and Communication Equipment -- Applied Research and Exploratory Development (R&D). Signed on 2005-04-01. Completion date: 2007-04-05.
$69,999 with Army for Defense Aircraft -- Applied Research and Exploratory Development (R&D). Signed on 2005-11-08. Completion date: 2006-05-31.
$69,818 with Navy for Defense Electronics and Communication Equipment -- Basic Research (R&D). Signed on 2004-03-11. Completion date: 2004-09-11.
$30,000, same as above.Signed on 2005-01-19. Completion date: 2004-09-11.
KENT S KNAEBEL & ASSOCIATES, I (6175 D SHAMROCK CT; small business) : $385,019 in 10 contractsfrom 2002 to 2006
Contracts for Services -- Engineering Development (R&D), Other Defense -- Applied Research and Exploratory Development (R&D) by Army Signed by year:2000: $0; 2001: $0; 2002: $79,000; 2003: $10,000; 2004: $131,019; 2005: $90,000; 2006: $75,000.
Biggest contracts:
$75,000 with Army for Services -- Engineering Development (R&D). Signed on 2006-05-01. Completion date: 2007-09-10.
$61,019 with Army for Other Defense -- Applied Research and Exploratory Development (R&D). Signed on 2004-04-14. Completion date: 2004-09-10.
$60,000 with Army for Services -- Engineering Development (R&D). Signed on 2005-01-27. Completion date: 2007-09-10.
$54,000 with Army for Other Defense -- Applied Research and Exploratory Development (R&D). Signed on 2002-04-17. Completion date: 2004-09-10.
HOMEWOOD HEALTH CARE (6100 AVERY ROAD; small business) : $271,390 in 5 contractsfrom 2001 to 2005
Contracts for Office Furniture, Cabinets, Lockers, Bins, and Shelving, Hospital Furniture, Equipment, Utensils, and Supplies by Air Force, Navy, Army Signed by year:2000: $0; 2001: $54,889; 2002: $94,385; 2003: $0; 2004: $98,535; 2005: $23,581; 2006: $0.
Biggest contracts:
$98,535 with Air Force for Office Furniture. Taking place in AK. Signed on 2004-02-12. Completion date: 2004-04-05.
$94,385 with Navy for Cabinets, Lockers, Bins, and Shelving. Signed on 2002-09-21. Completion date: 2003-01-13.
$54,889 with Army for Hospital Furniture, Equipment, Utensils, and Supplies. Taking place in CO. Signed on 2001-09-17. Completion date: 2001-10-01.
$19,546 with Navy for Hospital Furniture, Equipment, Utensils, and Supplies. Signed on 2005-01-18. Completion date: 2005-05-02.
STERLING COMMERCE, INC (4600 LAKEHURST CT; small business) : $253,664 in 7 contractsfrom 1999 to 2006
Contracts for ADP Software, Other ADP and Telecommunications Services (includes data storage on tapes, compact disks, etc.), , Maintenance, Repair and Rebuilding of Equipment -- Automatic Data Processing Equipment (Including Firmware), Software, Supplies and Support Equipment by Department of Veterans Affairs, National Institutes of Health, Army Signed by year:2000: $0; 2001: $0; 2002: $203,360; 2003: $0; 2004: $0; 2005: $6,480; 2006: $6,824.
Biggest contracts:
$117,020 with Department of Veterans Affairs for ADP Software. Taking place in TX. Signed on 2002-10-15. Completion date: 2002-12-15.
$43,340 with Department of Veterans Affairs for Other ADP and Telecommunications Services (includes data storage on tapes, compact disks, etc.). Taking place in TX. Signed on 2002-10-15. Completion date: 2003-09-15.
$43,000, same as above.Signed on 2002-09-15. Completion date: 2002-09-15.
$37,000, same as above.Signed on 1999-10-15. Completion date: 2000-09-15.
APPLIED INNOVATION INC (5800 INNOVATION DR; small business) : $211,348 in 11 contractsfrom 2003 to 2005
Contracts for ADP Software, Telephone and Telegraph Equipment, Miscellaneous Communication Equipment, Maintenance, Repair and Rebuilding of Equipment -- Alarm, Signal, and Security Detection Systems by Army Signed by year:2000: $0; 2001: $0; 2002: $0; 2003: $136,614; 2004: $34,770; 2005: $39,964; 2006: $0.
Biggest contracts:
$67,850 with Army for ADP Software. Signed on 2003-02-24. Completion date: 2003-05-13.
$39,237, same as above.Signed on 2003-03-06. Completion date: 2006-04-30.
$33,000 with Army for Telephone and Telegraph Equipment. Taking place in NM. Signed on 2005-06-13. Completion date: 2006-05-31.
$28,560 with Army for Miscellaneous Communication Equipment. Taking place in NM. Signed on 2004-03-31. Completion date: 2004-04-14.
AIR FORCE ONE, INC (5810 SHIER-RINGS ROAD) : $98,531 in 4 contractsfrom 2000 to 2002
$71,140 with Defense Logistics Agency for Maintenance, Repair or Alteration of Real Property -- Other Non-Building Facilities. Signed on 2000-04-24. Completion date: 2000-08-22.
$14,291 with Army for Waste Disposal Equipment. Signed on 2002-10-30. Completion date: 2002-11-24.
$11,610 with Defense Logistics Agency for Maintenance, Repair or Alteration of Real Property -- Other Non-Building Facilities. Signed on 2000-08-22. Completion date: 2000-11-30.
$1,490, same as above.Signed on 2000-09-29. Completion date: 2000-09-30.
RESOLUTION TECHNOLOGY INC (5990 WILCOX PLACE; small business) : $45,916 in 4 contractsfrom 2001 to 2006
$28,000 with NASA for Laboratory Equipment and Supplies. Signed on 2001-09-15. Completion date: 2001-11-15.
$7,921 with NASA for . Signed on 2006-07-14. Effective on 2006-07-12. Completion date: 2006-08-12.
$5,000 with Geological Survey for ADP Software. Taking place in MO. Signed on 2004-09-03. Completion date: 2004-10-01.
$4,995 with Air Force for Cameras, Still Picture. Signed on 2006-03-17. Completion date: 2006-04-28.
Top industries in this zip code by the number of employees in 2005:
Finance and Insurance: Direct Life Insurance Carriers (over 1000 employees: 1 establishment, 500-999 employees: 1 establishment, 50-99 employees: 1 establishment)
2002 - 2018 National Fire Incident Reporting System (NFIRS) incidents
Based on the data from the years 2002 - 2018 the average number of fires per year is 82. The highest number of reported fires - 169 took place in 2004, and the least - 38 in 2013. The data has a declining trend.
When looking into fire subcategories, the most incidents belonged to: Outside Fires (47.8%), and Structure Fires (33.9%).
Fire incident types reported to NFIRS in Zip Code 43016


 Nearest zip codes: 43017, 43002, 43026, 43220, 43065, 43221.


 Based on the data from the years 2002 - 2018 the average number of fires per year is 82. The highest number of reported fires - 169 took place in 2004, and the least - 38 in 2013. The data has a declining trend.
 When looking into fire subcategories, the most incidents belonged to: Outside Fires (47.8%), and Structure Fires (33.9%).