Powell, Ohio Submit your own pictures of this village and show them to the world
OSM Map
General Map
Google Map
MSN Map
OSM Map
General Map
Google Map
MSN Map
OSM Map
General Map
Google Map
MSN Map
OSM Map
General Map
Google Map
MSN Map
Please wait while loading the map...
Population in 2022: 14,390 (100% urban, 0% rural). Population change since 2000: +130.4%Males: 7,329 Females: 7,061
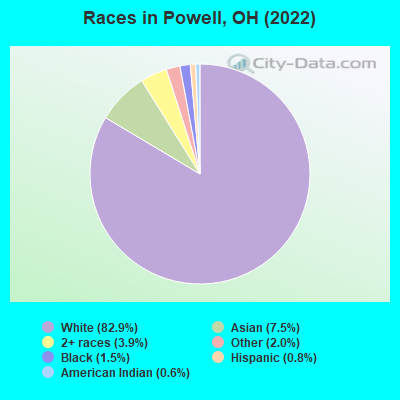
March 2022 cost of living index in Powell: 98.0 (near average, U.S. average is 100) Percentage of residents living in poverty in 2022: 1.4%for White Non-Hispanic residents , 5.7% for Black residents , 28.2% for Hispanic or Latino residents , 8.6% for other race residents , 1.0% for two or more races residents )
Profiles of local businesses
Business Search - 14 Million verified businesses
Data:
Median household income ($)
Median household income (% change since 2000)
Household income diversity
Ratio of average income to average house value (%)
Ratio of average income to average rent
Median household income ($) - White
Median household income ($) - Black or African American
Median household income ($) - Asian
Median household income ($) - Hispanic or Latino
Median household income ($) - American Indian and Alaska Native
Median household income ($) - Multirace
Median household income ($) - Other Race
Median household income for houses/condos with a mortgage ($)
Median household income for apartments without a mortgage ($)
Races - White alone (%)
Races - White alone (% change since 2000)
Races - Black alone (%)
Races - Black alone (% change since 2000)
Races - American Indian alone (%)
Races - American Indian alone (% change since 2000)
Races - Asian alone (%)
Races - Asian alone (% change since 2000)
Races - Hispanic (%)
Races - Hispanic (% change since 2000)
Races - Native Hawaiian and Other Pacific Islander alone (%)
Races - Native Hawaiian and Other Pacific Islander alone (% change since 2000)
Races - Two or more races (%)
Races - Two or more races (% change since 2000)
Races - Other race alone (%)
Races - Other race alone (% change since 2000)
Racial diversity
Unemployment (%)
Unemployment (% change since 2000)
Unemployment (%) - White
Unemployment (%) - Black or African American
Unemployment (%) - Asian
Unemployment (%) - Hispanic or Latino
Unemployment (%) - American Indian and Alaska Native
Unemployment (%) - Multirace
Unemployment (%) - Other Race
Population density (people per square mile)
Population - Males (%)
Population - Females (%)
Population - Males (%) - White
Population - Males (%) - Black or African American
Population - Males (%) - Asian
Population - Males (%) - Hispanic or Latino
Population - Males (%) - American Indian and Alaska Native
Population - Males (%) - Multirace
Population - Males (%) - Other Race
Population - Females (%) - White
Population - Females (%) - Black or African American
Population - Females (%) - Asian
Population - Females (%) - Hispanic or Latino
Population - Females (%) - American Indian and Alaska Native
Population - Females (%) - Multirace
Population - Females (%) - Other Race
Coronavirus confirmed cases (Apr 27, 2024)
Deaths caused by coronavirus (Apr 27, 2024)
Coronavirus confirmed cases (per 100k population) (Apr 27, 2024)
Deaths caused by coronavirus (per 100k population) (Apr 27, 2024)
Daily increase in number of cases (Apr 27, 2024)
Weekly increase in number of cases (Apr 27, 2024)
Cases doubled (in days) (Apr 27, 2024)
Hospitalized patients (Apr 18, 2022)
Negative test results (Apr 18, 2022)
Total test results (Apr 18, 2022)
COVID Vaccine doses distributed (per 100k population) (Sep 19, 2023)
COVID Vaccine doses administered (per 100k population) (Sep 19, 2023)
COVID Vaccine doses distributed (Sep 19, 2023)
COVID Vaccine doses administered (Sep 19, 2023)
Likely homosexual households (%)
Likely homosexual households (% change since 2000)
Likely homosexual households - Lesbian couples (%)
Likely homosexual households - Lesbian couples (% change since 2000)
Likely homosexual households - Gay men (%)
Likely homosexual households - Gay men (% change since 2000)
Cost of living index
Median gross rent ($)
Median contract rent ($)
Median monthly housing costs ($)
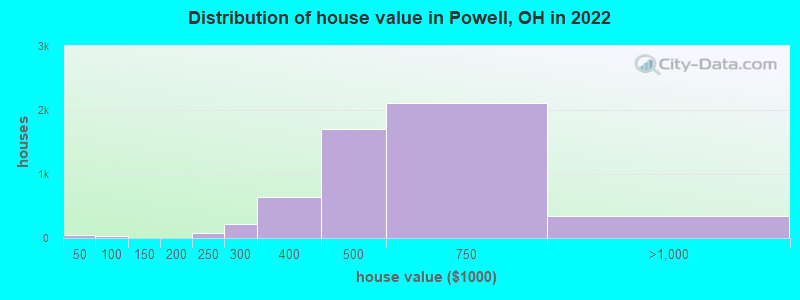
Median house or condo value ($)
Median house or condo value ($ change since 2000)
Mean house or condo value by units in structure - 1, detached ($)
Mean house or condo value by units in structure - 1, attached ($)
Mean house or condo value by units in structure - 2 ($)
Mean house or condo value by units in structure by units in structure - 3 or 4 ($)
Mean house or condo value by units in structure - 5 or more ($)
Mean house or condo value by units in structure - Boat, RV, van, etc. ($)
Mean house or condo value by units in structure - Mobile home ($)
Median house or condo value ($) - White
Median house or condo value ($) - Black or African American
Median house or condo value ($) - Asian
Median house or condo value ($) - Hispanic or Latino
Median house or condo value ($) - American Indian and Alaska Native
Median house or condo value ($) - Multirace
Median house or condo value ($) - Other Race
Median resident age
Resident age diversity
Median resident age - Males
Median resident age - Females
Median resident age - White
Median resident age - Black or African American
Median resident age - Asian
Median resident age - Hispanic or Latino
Median resident age - American Indian and Alaska Native
Median resident age - Multirace
Median resident age - Other Race
Median resident age - Males - White
Median resident age - Males - Black or African American
Median resident age - Males - Asian
Median resident age - Males - Hispanic or Latino
Median resident age - Males - American Indian and Alaska Native
Median resident age - Males - Multirace
Median resident age - Males - Other Race
Median resident age - Females - White
Median resident age - Females - Black or African American
Median resident age - Females - Asian
Median resident age - Females - Hispanic or Latino
Median resident age - Females - American Indian and Alaska Native
Median resident age - Females - Multirace
Median resident age - Females - Other Race
Commute - mean travel time to work (minutes)
Travel time to work - Less than 5 minutes (%)
Travel time to work - Less than 5 minutes (% change since 2000)
Travel time to work - 5 to 9 minutes (%)
Travel time to work - 5 to 9 minutes (% change since 2000)
Travel time to work - 10 to 19 minutes (%)
Travel time to work - 10 to 19 minutes (% change since 2000)
Travel time to work - 20 to 29 minutes (%)
Travel time to work - 20 to 29 minutes (% change since 2000)
Travel time to work - 30 to 39 minutes (%)
Travel time to work - 30 to 39 minutes (% change since 2000)
Travel time to work - 40 to 59 minutes (%)
Travel time to work - 40 to 59 minutes (% change since 2000)
Travel time to work - 60 to 89 minutes (%)
Travel time to work - 60 to 89 minutes (% change since 2000)
Travel time to work - 90 or more minutes (%)
Travel time to work - 90 or more minutes (% change since 2000)
Marital status - Never married (%)
Marital status - Now married (%)
Marital status - Separated (%)
Marital status - Widowed (%)
Marital status - Divorced (%)
Median family income ($)
Median family income (% change since 2000)
Median non-family income ($)
Median non-family income (% change since 2000)
Median per capita income ($)
Median per capita income (% change since 2000)
Median family income ($) - White
Median family income ($) - Black or African American
Median family income ($) - Asian
Median family income ($) - Hispanic or Latino
Median family income ($) - American Indian and Alaska Native
Median family income ($) - Multirace
Median family income ($) - Other Race
Median year house/condo built
Median year apartment built
Year house built - Built 2005 or later (%)
Year house built - Built 2000 to 2004 (%)
Year house built - Built 1990 to 1999 (%)
Year house built - Built 1980 to 1989 (%)
Year house built - Built 1970 to 1979 (%)
Year house built - Built 1960 to 1969 (%)
Year house built - Built 1950 to 1959 (%)
Year house built - Built 1940 to 1949 (%)
Year house built - Built 1939 or earlier (%)
Average household size
Household density (households per square mile)
Average household size - White
Average household size - Black or African American
Average household size - Asian
Average household size - Hispanic or Latino
Average household size - American Indian and Alaska Native
Average household size - Multirace
Average household size - Other Race
Occupied housing units (%)
Vacant housing units (%)
Owner occupied housing units (%)
Renter occupied housing units (%)
Vacancy status - For rent (%)
Vacancy status - For sale only (%)
Vacancy status - Rented or sold, not occupied (%)
Vacancy status - For seasonal, recreational, or occasional use (%)
Vacancy status - For migrant workers (%)
Vacancy status - Other vacant (%)
Residents with income below the poverty level (%)
Residents with income below 50% of the poverty level (%)
Children below poverty level (%)
Poor families by family type - Married-couple family (%)
Poor families by family type - Male, no wife present (%)
Poor families by family type - Female, no husband present (%)
Poverty status for native-born residents (%)
Poverty status for foreign-born residents (%)
Poverty among high school graduates not in families (%)
Poverty among people who did not graduate high school not in families (%)
Residents with income below the poverty level (%) - White
Residents with income below the poverty level (%) - Black or African American
Residents with income below the poverty level (%) - Asian
Residents with income below the poverty level (%) - Hispanic or Latino
Residents with income below the poverty level (%) - American Indian and Alaska Native
Residents with income below the poverty level (%) - Multirace
Residents with income below the poverty level (%) - Other Race
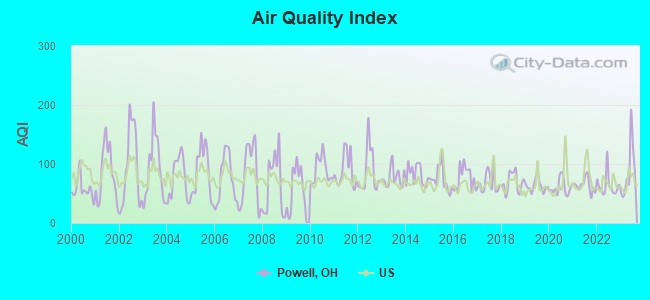
Air pollution - Air Quality Index (AQI)
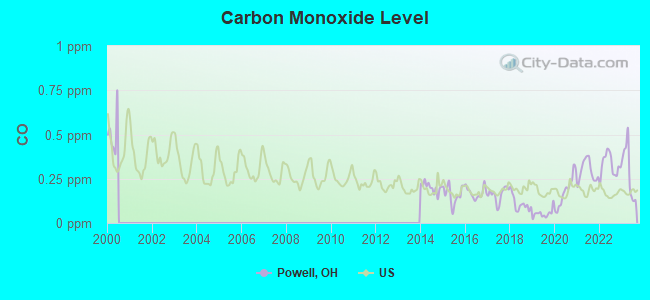
Air pollution - CO
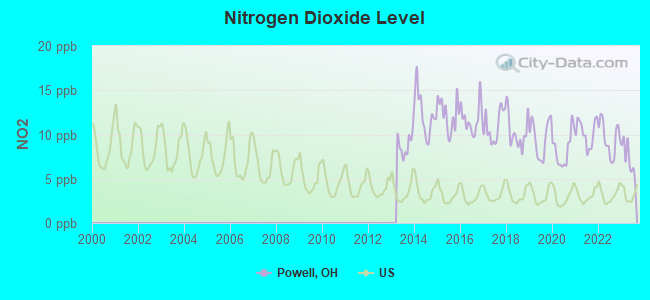
Air pollution - NO2
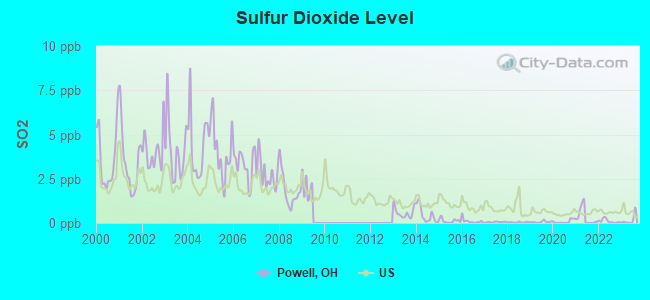
Air pollution - SO2
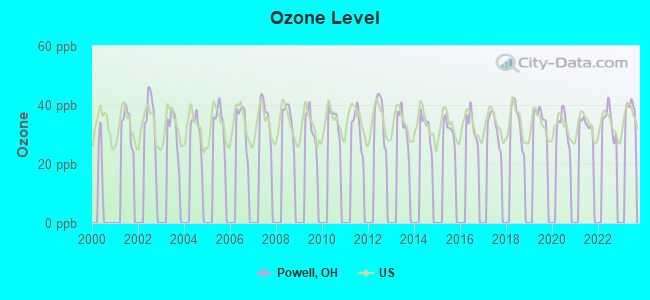
Air pollution - Ozone
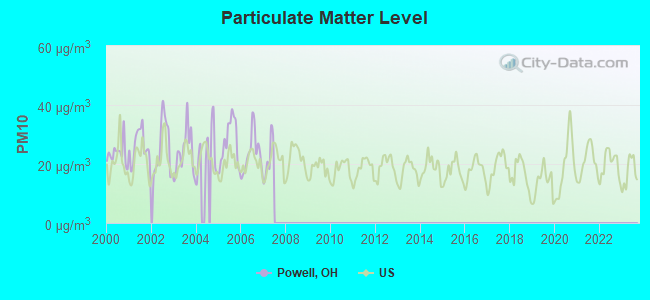
Air pollution - PM10
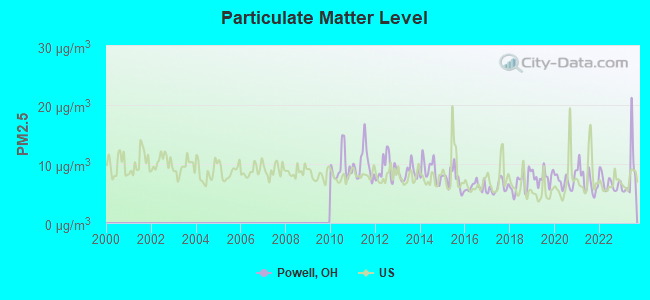
Air pollution - PM25
Air pollution - Pb
Crime - Murders per 100,000 population
Crime - Rapes per 100,000 population
Crime - Robberies per 100,000 population
Crime - Assaults per 100,000 population
Crime - Burglaries per 100,000 population
Crime - Thefts per 100,000 population
Crime - Auto thefts per 100,000 population
Crime - Arson per 100,000 population
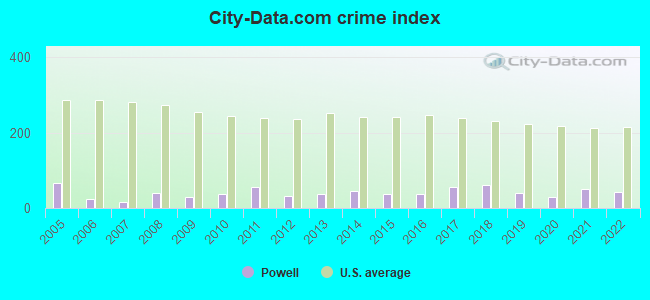
Crime - City-data.com crime index
Crime - Violent crime index
Crime - Property crime index
Crime - Murders per 100,000 population (5 year average)
Crime - Rapes per 100,000 population (5 year average)
Crime - Robberies per 100,000 population (5 year average)
Crime - Assaults per 100,000 population (5 year average)
Crime - Burglaries per 100,000 population (5 year average)
Crime - Thefts per 100,000 population (5 year average)
Crime - Auto thefts per 100,000 population (5 year average)
Crime - Arson per 100,000 population (5 year average)
Crime - City-data.com crime index (5 year average)
Crime - Violent crime index (5 year average)
Crime - Property crime index (5 year average)
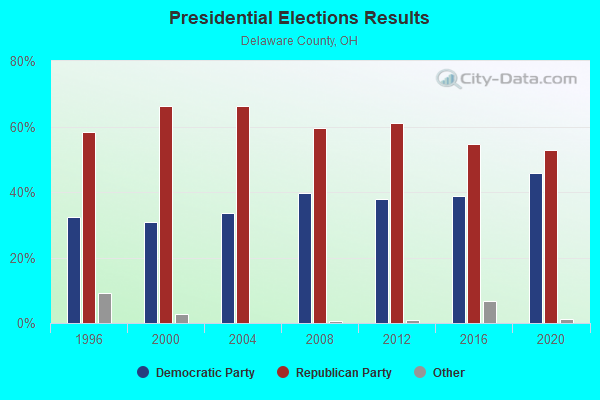
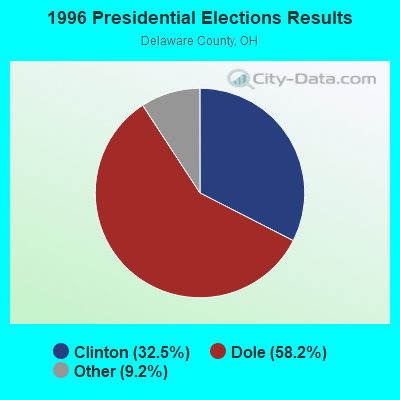
1996 Presidential Elections Results (%) - Democratic Party (Clinton)
1996 Presidential Elections Results (%) - Republican Party (Dole)
1996 Presidential Elections Results (%) - Other
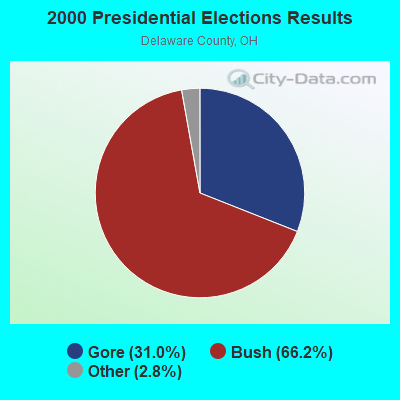
2000 Presidential Elections Results (%) - Democratic Party (Gore)
2000 Presidential Elections Results (%) - Republican Party (Bush)
2000 Presidential Elections Results (%) - Other
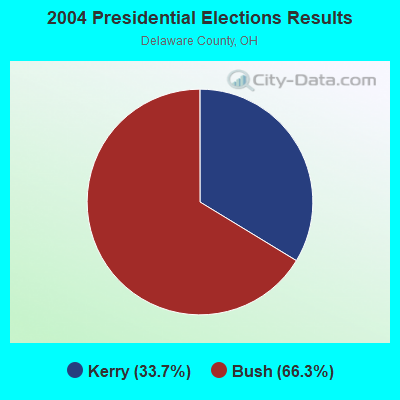
2004 Presidential Elections Results (%) - Democratic Party (Kerry)
2004 Presidential Elections Results (%) - Republican Party (Bush)
2004 Presidential Elections Results (%) - Other
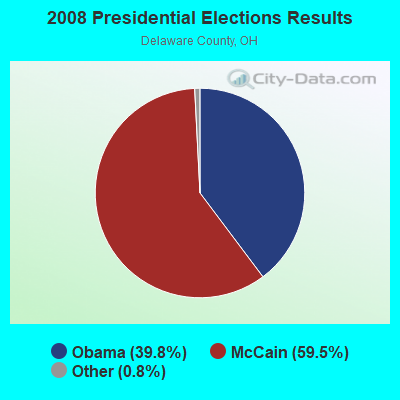
2008 Presidential Elections Results (%) - Democratic Party (Obama)
2008 Presidential Elections Results (%) - Republican Party (McCain)
2008 Presidential Elections Results (%) - Other
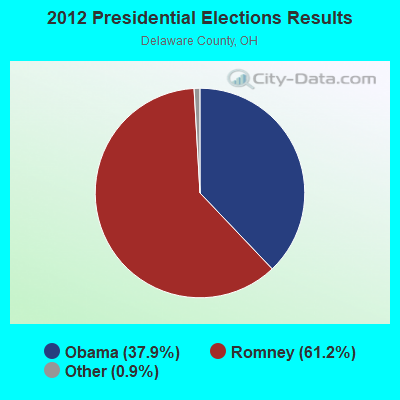
2012 Presidential Elections Results (%) - Democratic Party (Obama)
2012 Presidential Elections Results (%) - Republican Party (Romney)
2012 Presidential Elections Results (%) - Other
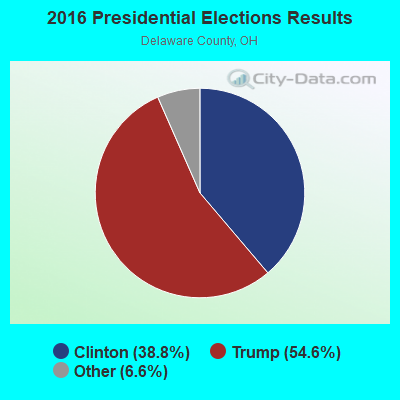
2016 Presidential Elections Results (%) - Democratic Party (Clinton)
2016 Presidential Elections Results (%) - Republican Party (Trump)
2016 Presidential Elections Results (%) - Other
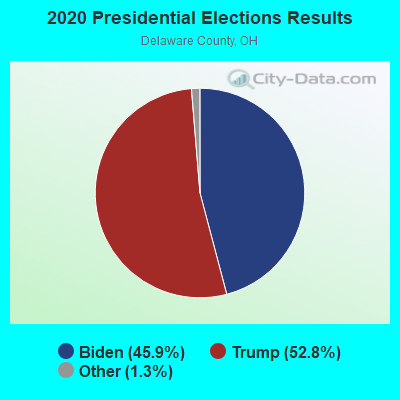
2020 Presidential Elections Results (%) - Democratic Party (Biden)
2020 Presidential Elections Results (%) - Republican Party (Trump)
2020 Presidential Elections Results (%) - Other
Ancestries Reported - Arab (%)
Ancestries Reported - Czech (%)
Ancestries Reported - Danish (%)
Ancestries Reported - Dutch (%)
Ancestries Reported - English (%)
Ancestries Reported - French (%)
Ancestries Reported - French Canadian (%)
Ancestries Reported - German (%)
Ancestries Reported - Greek (%)
Ancestries Reported - Hungarian (%)
Ancestries Reported - Irish (%)
Ancestries Reported - Italian (%)
Ancestries Reported - Lithuanian (%)
Ancestries Reported - Norwegian (%)
Ancestries Reported - Polish (%)
Ancestries Reported - Portuguese (%)
Ancestries Reported - Russian (%)
Ancestries Reported - Scotch-Irish (%)
Ancestries Reported - Scottish (%)
Ancestries Reported - Slovak (%)
Ancestries Reported - Subsaharan African (%)
Ancestries Reported - Swedish (%)
Ancestries Reported - Swiss (%)
Ancestries Reported - Ukrainian (%)
Ancestries Reported - United States (%)
Ancestries Reported - Welsh (%)
Ancestries Reported - West Indian (%)
Ancestries Reported - Other (%)
Educational Attainment - No schooling completed (%)
Educational Attainment - Less than high school (%)
Educational Attainment - High school or equivalent (%)
Educational Attainment - Less than 1 year of college (%)
Educational Attainment - 1 or more years of college (%)
Educational Attainment - Associate degree (%)
Educational Attainment - Bachelor's degree (%)
Educational Attainment - Master's degree (%)
Educational Attainment - Professional school degree (%)
Educational Attainment - Doctorate degree (%)
School Enrollment - Nursery, preschool (%)
School Enrollment - Kindergarten (%)
School Enrollment - Grade 1 to 4 (%)
School Enrollment - Grade 5 to 8 (%)
School Enrollment - Grade 9 to 12 (%)
School Enrollment - College undergrad (%)
School Enrollment - Graduate or professional (%)
School Enrollment - Not enrolled in school (%)
School enrollment - Public schools (%)
School enrollment - Private schools (%)
School enrollment - Not enrolled (%)
Median number of rooms in houses and condos
Median number of rooms in apartments
Housing units lacking complete plumbing facilities (%)
Housing units lacking complete kitchen facilities (%)
Density of houses
Urban houses (%)
Rural houses (%)
Households with people 60 years and over (%)
Households with people 65 years and over (%)
Households with people 75 years and over (%)
Households with one or more nonrelatives (%)
Households with no nonrelatives (%)
Population in households (%)
Family households (%)
Nonfamily households (%)
Population in families (%)
Family households with own children (%)
Median number of bedrooms in owner occupied houses
Mean number of bedrooms in owner occupied houses
Median number of bedrooms in renter occupied houses
Mean number of bedrooms in renter occupied houses
Median number of vehichles in owner occupied houses
Mean number of vehichles in owner occupied houses
Median number of vehichles in renter occupied houses
Mean number of vehichles in renter occupied houses
Mortgage status - with mortgage (%)
Mortgage status - with second mortgage (%)
Mortgage status - with home equity loan (%)
Mortgage status - with both second mortgage and home equity loan (%)
Mortgage status - without a mortgage (%)
Average family size
Average family size - White
Average family size - Black or African American
Average family size - Asian
Average family size - Hispanic or Latino
Average family size - American Indian and Alaska Native
Average family size - Multirace
Average family size - Other Race
Geographical mobility - Same house 1 year ago (%)
Geographical mobility - Moved within same county (%)
Geographical mobility - Moved from different county within same state (%)
Geographical mobility - Moved from different state (%)
Geographical mobility - Moved from abroad (%)
Place of birth - Born in state of residence (%)
Place of birth - Born in other state (%)
Place of birth - Native, outside of US (%)
Place of birth - Foreign born (%)
Housing units in structures - 1, detached (%)
Housing units in structures - 1, attached (%)
Housing units in structures - 2 (%)
Housing units in structures - 3 or 4 (%)
Housing units in structures - 5 to 9 (%)
Housing units in structures - 10 to 19 (%)
Housing units in structures - 20 to 49 (%)
Housing units in structures - 50 or more (%)
Housing units in structures - Mobile home (%)
Housing units in structures - Boat, RV, van, etc. (%)
House/condo owner moved in on average (years ago)
Renter moved in on average (years ago)
Year householder moved into unit - Moved in 1999 to March 2000 (%)
Year householder moved into unit - Moved in 1995 to 1998 (%)
Year householder moved into unit - Moved in 1990 to 1994 (%)
Year householder moved into unit - Moved in 1980 to 1989 (%)
Year householder moved into unit - Moved in 1970 to 1979 (%)
Year householder moved into unit - Moved in 1969 or earlier (%)
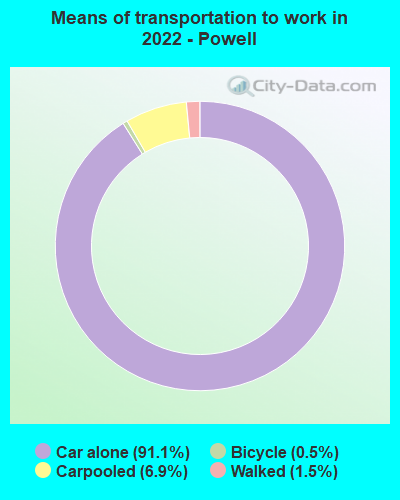
Means of transportation to work - Drove car alone (%)
Means of transportation to work - Carpooled (%)
Means of transportation to work - Public transportation (%)
Means of transportation to work - Bus or trolley bus (%)
Means of transportation to work - Streetcar or trolley car (%)
Means of transportation to work - Subway or elevated (%)
Means of transportation to work - Railroad (%)
Means of transportation to work - Ferryboat (%)
Means of transportation to work - Taxicab (%)
Means of transportation to work - Motorcycle (%)
Means of transportation to work - Bicycle (%)
Means of transportation to work - Walked (%)
Means of transportation to work - Other means (%)
Working at home (%)
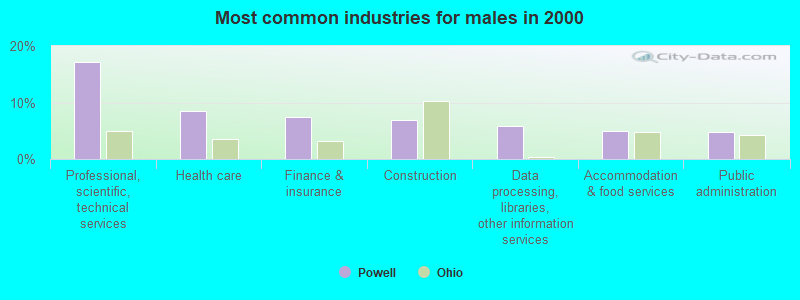
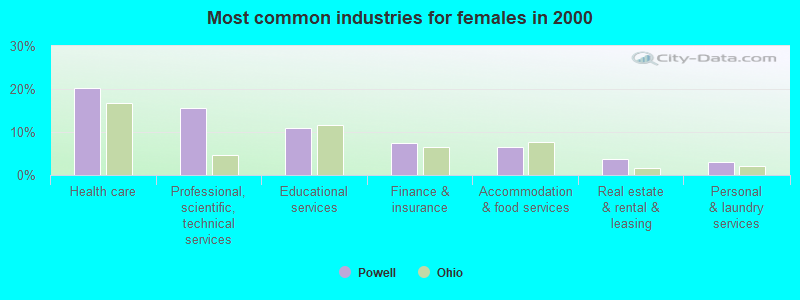
Industry diversity
Most Common Industries - Agriculture, forestry, fishing and hunting, and mining (%)
Most Common Industries - Agriculture, forestry, fishing and hunting (%)
Most Common Industries - Mining, quarrying, and oil and gas extraction (%)
Most Common Industries - Construction (%)
Most Common Industries - Manufacturing (%)
Most Common Industries - Wholesale trade (%)
Most Common Industries - Retail trade (%)
Most Common Industries - Transportation and warehousing, and utilities (%)
Most Common Industries - Transportation and warehousing (%)
Most Common Industries - Utilities (%)
Most Common Industries - Information (%)
Most Common Industries - Finance and insurance, and real estate and rental and leasing (%)
Most Common Industries - Finance and insurance (%)
Most Common Industries - Real estate and rental and leasing (%)
Most Common Industries - Professional, scientific, and management, and administrative and waste management services (%)
Most Common Industries - Professional, scientific, and technical services (%)
Most Common Industries - Management of companies and enterprises (%)
Most Common Industries - Administrative and support and waste management services (%)
Most Common Industries - Educational services, and health care and social assistance (%)
Most Common Industries - Educational services (%)
Most Common Industries - Health care and social assistance (%)
Most Common Industries - Arts, entertainment, and recreation, and accommodation and food services (%)
Most Common Industries - Arts, entertainment, and recreation (%)
Most Common Industries - Accommodation and food services (%)
Most Common Industries - Other services, except public administration (%)
Most Common Industries - Public administration (%)
Occupation diversity
Most Common Occupations - Management, business, science, and arts occupations (%)
Most Common Occupations - Management, business, and financial occupations (%)
Most Common Occupations - Management occupations (%)
Most Common Occupations - Business and financial operations occupations (%)
Most Common Occupations - Computer, engineering, and science occupations (%)
Most Common Occupations - Computer and mathematical occupations (%)
Most Common Occupations - Architecture and engineering occupations (%)
Most Common Occupations - Life, physical, and social science occupations (%)
Most Common Occupations - Education, legal, community service, arts, and media occupations (%)
Most Common Occupations - Community and social service occupations (%)
Most Common Occupations - Legal occupations (%)
Most Common Occupations - Education, training, and library occupations (%)
Most Common Occupations - Arts, design, entertainment, sports, and media occupations (%)
Most Common Occupations - Healthcare practitioners and technical occupations (%)
Most Common Occupations - Health diagnosing and treating practitioners and other technical occupations (%)
Most Common Occupations - Health technologists and technicians (%)
Most Common Occupations - Service occupations (%)
Most Common Occupations - Healthcare support occupations (%)
Most Common Occupations - Protective service occupations (%)
Most Common Occupations - Fire fighting and prevention, and other protective service workers including supervisors (%)
Most Common Occupations - Law enforcement workers including supervisors (%)
Most Common Occupations - Food preparation and serving related occupations (%)
Most Common Occupations - Building and grounds cleaning and maintenance occupations (%)
Most Common Occupations - Personal care and service occupations (%)
Most Common Occupations - Sales and office occupations (%)
Most Common Occupations - Sales and related occupations (%)
Most Common Occupations - Office and administrative support occupations (%)
Most Common Occupations - Natural resources, construction, and maintenance occupations (%)
Most Common Occupations - Farming, fishing, and forestry occupations (%)
Most Common Occupations - Construction and extraction occupations (%)
Most Common Occupations - Installation, maintenance, and repair occupations (%)
Most Common Occupations - Production, transportation, and material moving occupations (%)
Most Common Occupations - Production occupations (%)
Most Common Occupations - Transportation occupations (%)
Most Common Occupations - Material moving occupations (%)
People in Group quarters - Institutionalized population (%)
People in Group quarters - Correctional institutions (%)
People in Group quarters - Federal prisons and detention centers (%)
People in Group quarters - Halfway houses (%)
People in Group quarters - Local jails and other confinement facilities (including police lockups) (%)
People in Group quarters - Military disciplinary barracks (%)
People in Group quarters - State prisons (%)
People in Group quarters - Other types of correctional institutions (%)
People in Group quarters - Nursing homes (%)
People in Group quarters - Hospitals/wards, hospices, and schools for the handicapped (%)
People in Group quarters - Hospitals/wards and hospices for chronically ill (%)
People in Group quarters - Hospices or homes for chronically ill (%)
People in Group quarters - Military hospitals or wards for chronically ill (%)
People in Group quarters - Other hospitals or wards for chronically ill (%)
People in Group quarters - Hospitals or wards for drug/alcohol abuse (%)
People in Group quarters - Mental (Psychiatric) hospitals or wards (%)
People in Group quarters - Schools, hospitals, or wards for the mentally retarded (%)
People in Group quarters - Schools, hospitals, or wards for the physically handicapped (%)
People in Group quarters - Institutions for the deaf (%)
People in Group quarters - Institutions for the blind (%)
People in Group quarters - Orthopedic wards and institutions for the physically handicapped (%)
People in Group quarters - Wards in general hospitals for patients who have no usual home elsewhere (%)
People in Group quarters - Wards in military hospitals for patients who have no usual home elsewhere (%)
People in Group quarters - Juvenile institutions (%)
People in Group quarters - Long-term care (%)
People in Group quarters - Homes for abused, dependent, and neglected children (%)
People in Group quarters - Residential treatment centers for emotionally disturbed children (%)
People in Group quarters - Training schools for juvenile delinquents (%)
People in Group quarters - Short-term care, detention or diagnostic centers for delinquent children (%)
People in Group quarters - Type of juvenile institution unknown (%)
People in Group quarters - Noninstitutionalized population (%)
People in Group quarters - College dormitories (includes college quarters off campus) (%)
People in Group quarters - Military quarters (%)
People in Group quarters - On base (%)
People in Group quarters - Barracks, unaccompanied personnel housing (UPH), (Enlisted/Officer), ;and similar group living quarters for military personnel (%)
People in Group quarters - Transient quarters for temporary residents (%)
People in Group quarters - Military ships (%)
People in Group quarters - Group homes (%)
People in Group quarters - Homes or halfway houses for drug/alcohol abuse (%)
People in Group quarters - Homes for the mentally ill (%)
People in Group quarters - Homes for the mentally retarded (%)
People in Group quarters - Homes for the physically handicapped (%)
People in Group quarters - Other group homes (%)
People in Group quarters - Religious group quarters (%)
People in Group quarters - Dormitories (%)
People in Group quarters - Agriculture workers' dormitories on farms (%)
People in Group quarters - Job Corps and vocational training facilities (%)
People in Group quarters - Other workers' dormitories (%)
People in Group quarters - Crews of maritime vessels (%)
People in Group quarters - Other nonhousehold living situations (%)
People in Group quarters - Other noninstitutional group quarters (%)
Residents speaking English at home (%)
Residents speaking English at home - Born in the United States (%)
Residents speaking English at home - Native, born elsewhere (%)
Residents speaking English at home - Foreign born (%)
Residents speaking Spanish at home (%)
Residents speaking Spanish at home - Born in the United States (%)
Residents speaking Spanish at home - Native, born elsewhere (%)
Residents speaking Spanish at home - Foreign born (%)
Residents speaking other language at home (%)
Residents speaking other language at home - Born in the United States (%)
Residents speaking other language at home - Native, born elsewhere (%)
Residents speaking other language at home - Foreign born (%)
Class of Workers - Employee of private company (%)
Class of Workers - Self-employed in own incorporated business (%)
Class of Workers - Private not-for-profit wage and salary workers (%)
Class of Workers - Local government workers (%)
Class of Workers - State government workers (%)
Class of Workers - Federal government workers (%)
Class of Workers - Self-employed workers in own not incorporated business and Unpaid family workers (%)
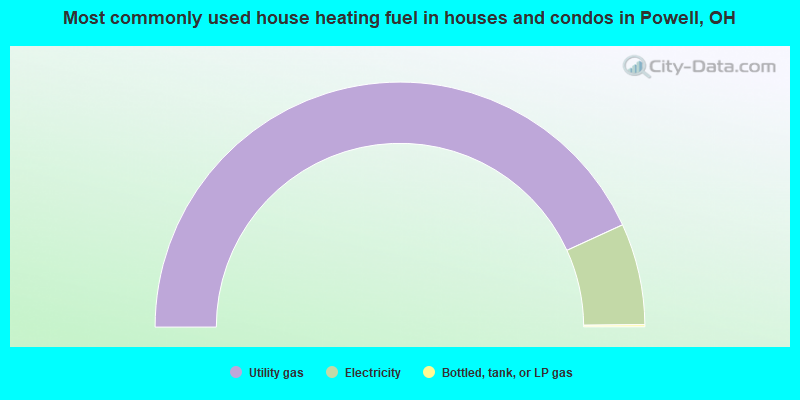
House heating fuel used in houses and condos - Utility gas (%)
House heating fuel used in houses and condos - Bottled, tank, or LP gas (%)
House heating fuel used in houses and condos - Electricity (%)
House heating fuel used in houses and condos - Fuel oil, kerosene, etc. (%)
House heating fuel used in houses and condos - Coal or coke (%)
House heating fuel used in houses and condos - Wood (%)
House heating fuel used in houses and condos - Solar energy (%)
House heating fuel used in houses and condos - Other fuel (%)
House heating fuel used in houses and condos - No fuel used (%)
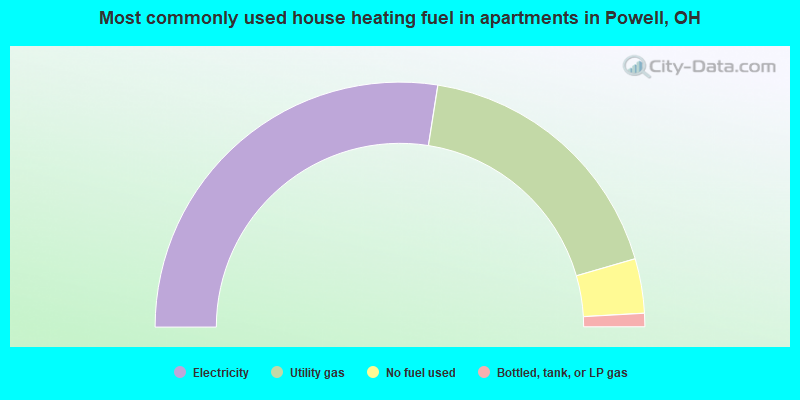
House heating fuel used in apartments - Utility gas (%)
House heating fuel used in apartments - Bottled, tank, or LP gas (%)
House heating fuel used in apartments - Electricity (%)
House heating fuel used in apartments - Fuel oil, kerosene, etc. (%)
House heating fuel used in apartments - Coal or coke (%)
House heating fuel used in apartments - Wood (%)
House heating fuel used in apartments - Solar energy (%)
House heating fuel used in apartments - Other fuel (%)
House heating fuel used in apartments - No fuel used (%)
Armed forces status - In Armed Forces (%)
Armed forces status - Civilian (%)
Armed forces status - Civilian - Veteran (%)
Armed forces status - Civilian - Nonveteran (%)
Fatal accidents locations in years 2005-2021
Fatal accidents locations in 2005
Fatal accidents locations in 2006
Fatal accidents locations in 2007
Fatal accidents locations in 2008
Fatal accidents locations in 2009
Fatal accidents locations in 2010
Fatal accidents locations in 2011
Fatal accidents locations in 2012
Fatal accidents locations in 2013
Fatal accidents locations in 2014
Fatal accidents locations in 2015
Fatal accidents locations in 2016
Fatal accidents locations in 2017
Fatal accidents locations in 2018
Fatal accidents locations in 2019
Fatal accidents locations in 2020
Fatal accidents locations in 2021
Alcohol use - People drinking some alcohol every month (%)
Alcohol use - People not drinking at all (%)
Alcohol use - Average days/month drinking alcohol
Alcohol use - Average drinks/week
Alcohol use - Average days/year people drink much
Audiometry - Average condition of hearing (%)
Audiometry - People that can hear a whisper from across a quiet room (%)
Audiometry - People that can hear normal voice from across a quiet room (%)
Audiometry - Ears ringing, roaring, buzzing (%)
Audiometry - Had a job exposure to loud noise (%)
Audiometry - Had off-work exposure to loud noise (%)
Blood Pressure & Cholesterol - Has high blood pressure (%)
Blood Pressure & Cholesterol - Checking blood pressure at home (%)
Blood Pressure & Cholesterol - Frequently checking blood cholesterol (%)
Blood Pressure & Cholesterol - Has high cholesterol level (%)
Consumer Behavior - Money monthly spent on food at supermarket/grocery store
Consumer Behavior - Money monthly spent on food at other stores
Consumer Behavior - Money monthly spent on eating out
Consumer Behavior - Money monthly spent on carryout/delivered foods
Consumer Behavior - Income spent on food at supermarket/grocery store (%)
Consumer Behavior - Income spent on food at other stores (%)
Consumer Behavior - Income spent on eating out (%)
Consumer Behavior - Income spent on carryout/delivered foods (%)
Current Health Status - General health condition (%)
Current Health Status - Blood donors (%)
Current Health Status - Has blood ever tested for HIV virus (%)
Current Health Status - Left-handed people (%)
Dermatology - People using sunscreen (%)
Diabetes - Diabetics (%)
Diabetes - Had a blood test for high blood sugar (%)
Diabetes - People taking insulin (%)
Diet Behavior & Nutrition - Diet health (%)
Diet Behavior & Nutrition - Milk product consumption (# of products/month)
Diet Behavior & Nutrition - Meals not home prepared (#/week)
Diet Behavior & Nutrition - Meals from fast food or pizza place (#/week)
Diet Behavior & Nutrition - Ready-to-eat foods (#/month)
Diet Behavior & Nutrition - Frozen meals/pizza (#/month)
Drug Use - People that ever used marijuana or hashish (%)
Drug Use - Ever used hard drugs (%)
Drug Use - Ever used any form of cocaine (%)
Drug Use - Ever used heroin (%)
Drug Use - Ever used methamphetamine (%)
Health Insurance - People covered by health insurance (%)
Kidney Conditions-Urology - Avg. # of times urinating at night
Medical Conditions - People with asthma (%)
Medical Conditions - People with anemia (%)
Medical Conditions - People with psoriasis (%)
Medical Conditions - People with overweight (%)
Medical Conditions - Elderly people having difficulties in thinking or remembering (%)
Medical Conditions - People who ever received blood transfusion (%)
Medical Conditions - People having trouble seeing even with glass/contacts (%)
Medical Conditions - People with arthritis (%)
Medical Conditions - People with gout (%)
Medical Conditions - People with congestive heart failure (%)
Medical Conditions - People with coronary heart disease (%)
Medical Conditions - People with angina pectoris (%)
Medical Conditions - People who ever had heart attack (%)
Medical Conditions - People who ever had stroke (%)
Medical Conditions - People with emphysema (%)
Medical Conditions - People with thyroid problem (%)
Medical Conditions - People with chronic bronchitis (%)
Medical Conditions - People with any liver condition (%)
Medical Conditions - People who ever had cancer or malignancy (%)
Mental Health - People who have little interest in doing things (%)
Mental Health - People feeling down, depressed, or hopeless (%)
Mental Health - People who have trouble sleeping or sleeping too much (%)
Mental Health - People feeling tired or having little energy (%)
Mental Health - People with poor appetite or overeating (%)
Mental Health - People feeling bad about themself (%)
Mental Health - People who have trouble concentrating on things (%)
Mental Health - People moving or speaking slowly or too fast (%)
Mental Health - People having thoughts they would be better off dead (%)
Oral Health - Average years since last visit a dentist
Oral Health - People embarrassed because of mouth (%)
Oral Health - People with gum disease (%)
Oral Health - General health of teeth and gums (%)
Oral Health - Average days a week using dental floss/device
Oral Health - Average days a week using mouthwash for dental problem
Oral Health - Average number of teeth
Pesticide Use - Households using pesticides to control insects (%)
Pesticide Use - Households using pesticides to kill weeds (%)
Physical Activity - People doing vigorous-intensity work activities (%)
Physical Activity - People doing moderate-intensity work activities (%)
Physical Activity - People walking or bicycling (%)
Physical Activity - People doing vigorous-intensity recreational activities (%)
Physical Activity - People doing moderate-intensity recreational activities (%)
Physical Activity - Average hours a day doing sedentary activities
Physical Activity - Average hours a day watching TV or videos
Physical Activity - Average hours a day using computer
Physical Functioning - People having limitations keeping them from working (%)
Physical Functioning - People limited in amount of work they can do (%)
Physical Functioning - People that need special equipment to walk (%)
Physical Functioning - People experiencing confusion/memory problems (%)
Physical Functioning - People requiring special healthcare equipment (%)
Prescription Medications - Average number of prescription medicines taking
Preventive Aspirin Use - Adults 40+ taking low-dose aspirin (%)
Reproductive Health - Vaginal deliveries (%)
Reproductive Health - Cesarean deliveries (%)
Reproductive Health - Deliveries resulted in a live birth (%)
Reproductive Health - Pregnancies resulted in a delivery (%)
Reproductive Health - Women breastfeeding newborns (%)
Reproductive Health - Women that had a hysterectomy (%)
Reproductive Health - Women that had both ovaries removed (%)
Reproductive Health - Women that have ever taken birth control pills (%)
Reproductive Health - Women taking birth control pills (%)
Reproductive Health - Women that have ever used Depo-Provera or injectables (%)
Reproductive Health - Women that have ever used female hormones (%)
Sexual Behavior - People 18+ that ever had sex (vaginal, anal, or oral) (%)
Sexual Behavior - Males 18+ that ever had vaginal sex with a woman (%)
Sexual Behavior - Males 18+ that ever performed oral sex on a woman (%)
Sexual Behavior - Males 18+ that ever had anal sex with a woman (%)
Sexual Behavior - Males 18+ that ever had any sex with a man (%)
Sexual Behavior - Females 18+ that ever had vaginal sex with a man (%)
Sexual Behavior - Females 18+ that ever performed oral sex on a man (%)
Sexual Behavior - Females 18+ that ever had anal sex with a man (%)
Sexual Behavior - Females 18+ that ever had any kind of sex with a woman (%)
Sexual Behavior - Average age people first had sex
Sexual Behavior - Average number of female sex partners in lifetime (males 18+)
Sexual Behavior - Average number of female vaginal sex partners in lifetime (males 18+)
Sexual Behavior - Average age people first performed oral sex on a woman (18+)
Sexual Behavior - Average number of woman performed oral sex on in lifetime (18+)
Sexual Behavior - Average number of male sex partners in lifetime (males 18+)
Sexual Behavior - Average number of male anal sex partners in lifetime (males 18+)
Sexual Behavior - Average age people first performed oral sex on a man (18+)
Sexual Behavior - Average number of male oral sex partners in lifetime (18+)
Sexual Behavior - People using protection when performing oral sex (%)
Sexual Behavior - Average number of times people have vaginal or anal sex a year
Sexual Behavior - People having sex without condom (%)
Sexual Behavior - Average number of male sex partners in lifetime (females 18+)
Sexual Behavior - Average number of male vaginal sex partners in lifetime (females 18+)
Sexual Behavior - Average number of female sex partners in lifetime (females 18+)
Sexual Behavior - Circumcised males 18+ (%)
Sleep Disorders - Average hours sleeping at night
Sleep Disorders - People that has trouble sleeping (%)
Smoking-Cigarette Use - People smoking cigarettes (%)
Taste & Smell - People 40+ having problems with smell (%)
Taste & Smell - People 40+ having problems with taste (%)
Taste & Smell - People 40+ that ever had wisdom teeth removed (%)
Taste & Smell - People 40+ that ever had tonsils teeth removed (%)
Taste & Smell - People 40+ that ever had a loss of consciousness because of a head injury (%)
Taste & Smell - People 40+ that ever had a broken nose or other serious injury to face or skull (%)
Taste & Smell - People 40+ that ever had two or more sinus infections (%)
Weight - Average height (inches)
Weight - Average weight (pounds)
Weight - Average BMI
Weight - People that are obese (%)
Weight - People that ever were obese (%)
Weight - People trying to lose weight (%)
According to our research of Ohio and other state lists, there were 7 registered sex offenders living in Powell, Ohio as of April 27, 2024 . The ratio of all residents to sex offenders in Powell is 1,781 to 1.The ratio of registered sex offenders to all residents in this city is much lower than the state average.
Officers per 1,000 residents here:
1.40Ohio average:
2.31
Latest news from Powell, OH collected exclusively by city-data.com from local newspapers, TV, and radio stations
Ancestries: German (22.5%), English (11.8%), Irish (9.5%), American (8.1%), Italian (5.4%), European (4.0%).
Current Local Time:
Land area: 3.04 square miles.
Population density: 4,739 people per square mile (average).
1,210 residents are foreign born (6.8% Asia , 1.2% Europe ).
This village:
8.2%Ohio:
4.9%
Median real estate property taxes paid for housing units with mortgages in 2022: $10,042 (1.9%)Median real estate property taxes paid for housing units with no mortgage in 2022: $10,370 (2.0%)
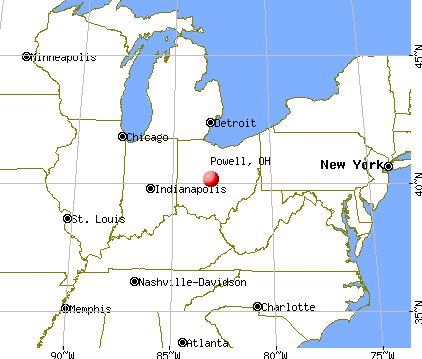
Nearest city with pop. 50,000+: Columbus, OH
Nearest city with pop. 1,000,000+: Chicago, IL
Nearest cities:
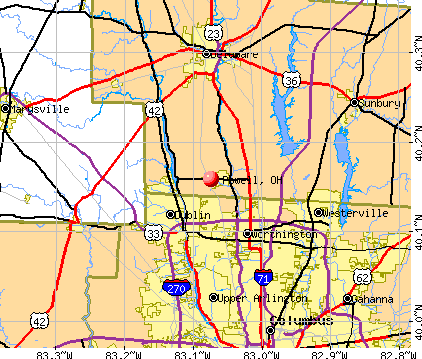
Latitude: 40.16 N, Longitude: 83.07 W
Daytime population change due to commuting: -1,501 (-10.2%)Workers who live and work in this village: 2,398 (33.5%)
Area code commonly used in this area: 614
Powell tourist attractions:
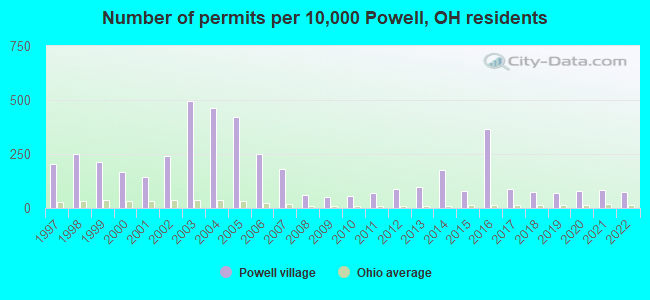
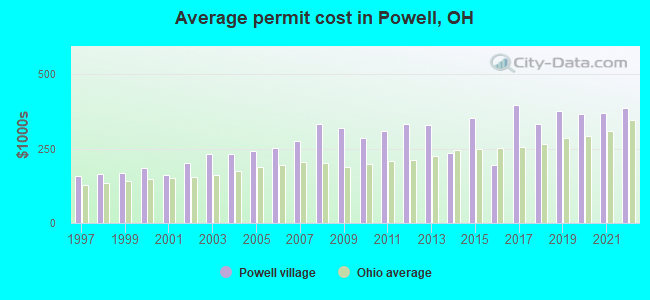
Single-family new house construction building permits:
2022: 45 buildings , average cost: $384,6002021: 53 buildings , average cost: $368,5002020: 50 buildings , average cost: $366,4002019: 43 buildings , average cost: $374,8002018: 47 buildings , average cost: $332,9002017: 54 buildings , average cost: $396,3002016: 229 buildings , average cost: $195,7002015: 50 buildings , average cost: $353,7002014: 110 buildings , average cost: $235,0002013: 62 buildings , average cost: $328,2002012: 55 buildings , average cost: $330,9002011: 44 buildings , average cost: $308,2002010: 34 buildings , average cost: $283,9002009: 32 buildings , average cost: $317,5002008: 37 buildings , average cost: $332,7002007: 114 buildings , average cost: $274,5002006: 155 buildings , average cost: $251,2002005: 263 buildings , average cost: $242,8002004: 289 buildings , average cost: $230,9002003: 310 buildings , average cost: $231,7002002: 149 buildings , average cost: $199,7002001: 90 buildings , average cost: $162,1002000: 104 buildings , average cost: $185,8001999: 133 buildings , average cost: $168,5001998: 157 buildings , average cost: $163,2001997: 126 buildings , average cost: $158,400Unemployment in December 2023: Population change in the 1990s: +4,089 (+189.5%).
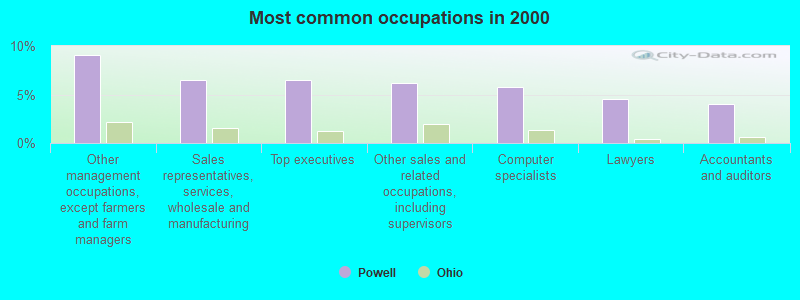
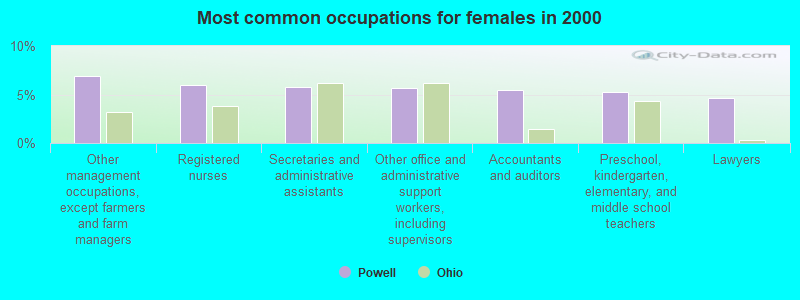
Most common occupations in Powell, OH (%)
Both Males Females
Other management occupations, except farmers and farm managers (9.1%)
Sales representatives, services, wholesale and manufacturing (6.5%)
Top executives (6.5%)
Other sales and related occupations, including supervisors (6.2%)
Computer specialists (5.8%)
Lawyers (4.5%)
Accountants and auditors (4.0%)
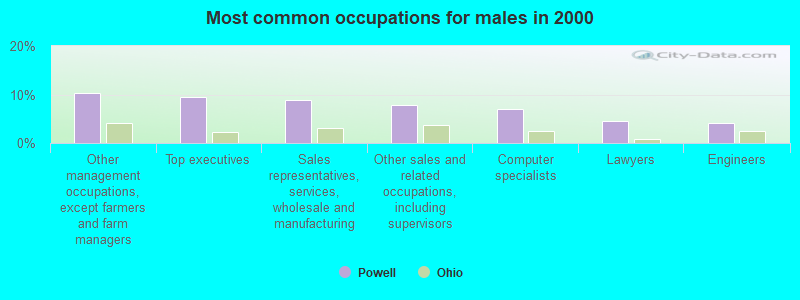
Other management occupations, except farmers and farm managers (10.4%)
Top executives (9.5%)
Sales representatives, services, wholesale and manufacturing (8.8%)
Other sales and related occupations, including supervisors (7.9%)
Computer specialists (7.1%)
Lawyers (4.5%)
Engineers (4.1%)
Other management occupations, except farmers and farm managers (6.9%)
Registered nurses (6.0%)
Secretaries and administrative assistants (5.8%)
Other office and administrative support workers, including supervisors (5.7%)
Accountants and auditors (5.5%)
Preschool, kindergarten, elementary, and middle school teachers (5.3%)
Lawyers (4.6%)
Tornado activity:
Powell-area historical tornado activity is near Ohio state average. It is 25% greater than the overall U.S. average.
On 4/3/1974, a category F5 (max. wind speeds 261-318 mph) tornado 32.4 miles away from the Powell village center killed 36 people and injured 1150 people and caused between $50,000,000 and $500,000,000 in damages.
On 2/22/1971, a category F3 (max. wind speeds 158-206 mph) tornado 15.1 miles away from the village center injured 7 people and caused between $500,000 and $5,000,000 in damages.
Earthquake activity:
Powell-area historical earthquake activity is significantly above Ohio state average. It is 19% smaller than the overall U.S. average. On 7/27/1980 at 18:52:21, a magnitude 5.2 (5.1 MB, 4.7 MS, 5.0 UK, 5.2 UK, Class: Moderate, Intensity: VI - VII) earthquake occurred 142.9 miles away from the city center On 9/25/1998 at 19:52:52, a magnitude 5.2 (4.8 MB, 4.3 MS, 5.2 LG, 4.5 MW, Depth: 3.1 mi) earthquake occurred 167.8 miles away from Powell center On 1/31/1986 at 16:46:43, a magnitude 5.0 (5.0 MB) earthquake occurred 141.4 miles away from the city center On 8/23/2011 at 17:51:04, a magnitude 5.8 (5.8 MW, Depth: 3.7 mi) earthquake occurred 316.8 miles away from the city center On 7/12/1986 at 08:19:37, a magnitude 4.5 (4.5 MB, Class: Light, Intensity: IV - V) earthquake occurred 73.2 miles away from Powell center On 4/18/2008 at 09:36:59, a magnitude 5.4 (5.1 MB, 4.8 MS, 5.4 MW, 5.2 MW) earthquake occurred 283.2 miles away from the city center Magnitude types: regional Lg-wave magnitude (LG), body-wave magnitude (MB), surface-wave magnitude (MS), moment magnitude (MW) Natural disasters: The number of natural disasters in Delaware County (10) is smaller than the US average (15).Major Disasters (Presidential) Declared: 5Emergencies Declared: 4Storms: 3, Floods: 2, Snows: 2, Tornadoes: 2, Blizzard: 1, Hurricane: 1, Mudslide: 1, Snowstorm: 1, Tropical Depression: 1, Wind: 1, Winter Storm: 1, Other: 1 (Note: some incidents may be assigned to more than one category). Hospitals and medical centers near Powell: CAPITAL HOME HEALTH, INC (Home Health Center, about 2 miles away; COLUMBUS, OH)
RAPHAEL HEALTH CARE, LLC (Home Health Center, about 4 miles away; COLUMBUS, OH)
WORTHINGTON CHRISTIAN VILLAGE (Nursing Home, about 4 miles away; COLUMBUS, OH)
WILLOW BROOK CHRISTIAN HOME (Nursing Home, about 4 miles away; COLUMBUS, OH)
PREMIER CARE (Home Health Center, about 4 miles away; COLUMBUS, OH)
HIGHBANKS CARE CENTER (Nursing Home, about 4 miles away; COLUMBUS, OH)
EXCEL HEALTH SERVICES (Home Health Center, about 4 miles away; WESTERVILLE, OH)
Heliports located in Powell: Amtrak station near Powell: 15 miles: COLUMBUS (111 EAST TOWN ST.) - Bus Station Services: enclosed waiting area, public restrooms, public payphones.
Colleges/universities with over 2000 students nearest to Powell:
Otterbein University (about 8 miles; Westerville, OH ; Full-time enrollment: 2,933)
Ohio State University-Main Campus (about 12 miles; Columbus, OH ; FT enrollment: 50,395)
Ohio Dominican University (about 14 miles; Columbus, OH ; FT enrollment: 2,045)
Columbus State Community College (about 14 miles; Columbus, OH ; FT enrollment: 24,488)
Franklin University (about 15 miles; Columbus, OH ; FT enrollment: 3,736)
Capital University (about 16 miles; Columbus, OH ; FT enrollment: 3,029)
DeVry University-Ohio (about 17 miles; Columbus, OH ; FT enrollment: 3,896)
Public high school in Powell:
Private high school in Powell: VILLAGE ACADEMY SCHOOLS Students: 337, Location: 284 S LIBERTY ST, Grades: PK-12)
Public elementary/middle schools in Powell: OLENTANGY LIBERTY MIDDLE SCHOOL Students: 743, Location: 7940 LIBERTY RD N, Grades: 6-8)TYLER RUN ELEMENTARY SCHOOL Students: 694, Location: 580 SALISBURY DR, Grades: PK-5)SCIOTO RIDGE ELEMENTARY SCHOOL Students: 678, Location: 8715 BIG BEAR AVE, Grades: KG-5)INDIAN SPRINGS ELEMENTARY Students: 671, Location: 3828 HOME RD, Grades: KG-5)WYANDOT RUN ELEMENTARY SCHOOL Students: 630, Location: 2800 CARRIAGE RD, Grades: PK-5)ALBERT CHAPMAN ELEMENTARY SCHOOL Students: 499, Location: 8450 SAWMILL RD, Grades: PK-5)LIBERTY TREE ELEMENTARY SCHOOL Students: 489, Location: 6877 SAWMILL PARKWAY, Grades: PK-5)LIBERTY ELEMENTARY SCHOOL Students: 323, Location: 8081 SADDLE RUN, Grades: KG-6)HYATTS MIDDLE SCHOOL Location: 6885 SAWMILL PARKWAY, Grades: 6-8)
See full list of schools located in Powell Birthplace of: Ikechuku Ndukwe - Football player.
Delaware County has a predicted average indoor radon screening level greater than 4 pCi/L (pico curies per liter) - Highest Potential Average household size: This village:
3.0 peopleOhio:
2.4 people
Percentage of family households: This village:
85.0%Whole state:
65.0%
Percentage of households with unmarried partners: This village:
2.7%Whole state:
6.8%
Likely homosexual households (counted as self-reported same-sex unmarried-partner households)
Lesbian couples: 0.2% of all households Gay men: 0.3% of all households
Banks with most branches in Powell (2011 data):
The Huntington National Bank: Lewis Center Branch, Powell-Home Road Branch, Powell Giant Eagle Branch, Powell Branch. Info updated 2012/04/02: Bank assets: $54,183.4 mil, Deposits: $44,300.3 mil, headquarters in Columbus, OH, positive income , Commercial Lending Specialization, 878 total offices , Holding Company: Huntington Bancshares Incorporated
JPMorgan Chase Bank, National Association: Powell Kroger Branch, Powell North Branch, Powell Road Branch. Info updated 2011/11/10: Bank assets: $1,811,678.0 mil, Deposits: $1,190,738.0 mil, headquarters in Columbus, OH, positive income , International Specialization, 5577 total offices , Holding Company: Jpmorgan Chase & Co.
Fifth Third Bank: Lewis Center Banking Center Branch at 8877 Owenfield Drive, branch established on 2004/05/03; Powell Road Banking Center Branch at 3949 West Powell Road, branch established on 2001/12/01. Info updated 2009/10/05: Bank assets: $114,540.4 mil, Deposits: $89,689.1 mil, headquarters in Cincinnati, OH, positive income , Commercial Lending Specialization, 1378 total offices , Holding Company: Fifth Third Bancorp
The Delaware County Bank and Trust Company: Liberty Branch at 7319 Sawmill Parkway, branch established on 2008/05/05; Sawmill Road Branch at 10149 Brewster Lane, branch established on 1997/11/17. Info updated 2011/11/15: Bank assets: $523.6 mil, Deposits: $446.1 mil, headquarters in Lewis Center, OH, negative income in the last year , Commercial Lending Specialization, 21 total offices , Holding Company: Dcb Financial Corp
KeyBank National Association: Powell Keycenter Branch at 3944 Powell Road, branch established on 2003/12/15; Lewis Keycenter Branch at 8609 Owenfield Drive, branch established on 2003/12/22. Info updated 2008/03/03: Bank assets: $86,198.8 mil, Deposits: $64,214.8 mil, headquarters in Cleveland, OH, positive income , Commercial Lending Specialization, 1067 total offices , Holding Company: Keycorp
Advantage Bank: Powell Branch at 218 West Olentangy Street, branch established on 1998/07/01. Info updated 2011/03/23: Bank assets: $767.1 mil, Deposits: $634.2 mil, headquarters in Cambridge, OH, positive income , Commercial Lending Specialization, 26 total offices , Holding Company: Camco Financial Corporation
Firstmerit Bank, National Association: Powell Banking Center Branch at 9494 Wedgewood Boulevard, branch established on 2006/12/19. Info updated 2010/05/17: Bank assets: $14,420.6 mil, Deposits: $11,497.6 mil, headquarters in Akron, OH, positive income , Commercial Lending Specialization, 213 total offices , Holding Company: Firstmerit Corporation
PNC Bank, National Association: Powell Road Big Bear Branch at 3932 Powell Road, branch established on 1994/05/02. Info updated 2012/03/20: Bank assets: $263,309.6 mil, Deposits: $197,343.0 mil, headquarters in Wilmington, DE, positive income , Commercial Lending Specialization, 3085 total offices , Holding Company: Pnc Financial Services Group, Inc., The
The First Citizens National Bank of Upper Sandusky: Powell Branch at 9595 Sawmill Parkway, branch established on 2000/06/26. Info updated 2006/11/03: Bank assets: $220.2 mil, Deposits: $170.7 mil, headquarters in Upper Sandusky, OH, positive income , 8 total offices
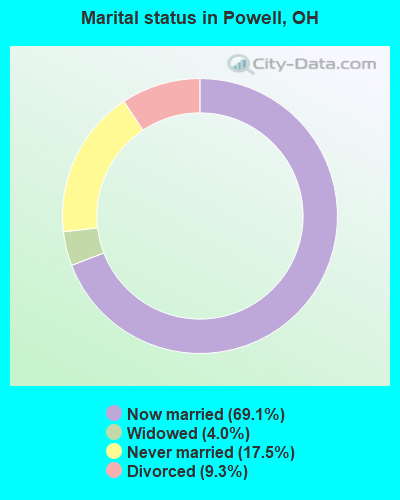
For population 15 years and over in Powell:
Never married: 17.5%Now married: 69.1%Separated: 0.1%Widowed: 4.0%Divorced: 9.3% For population 25 years and over in Powell:
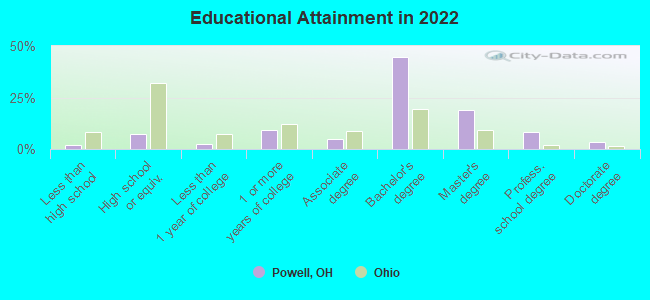
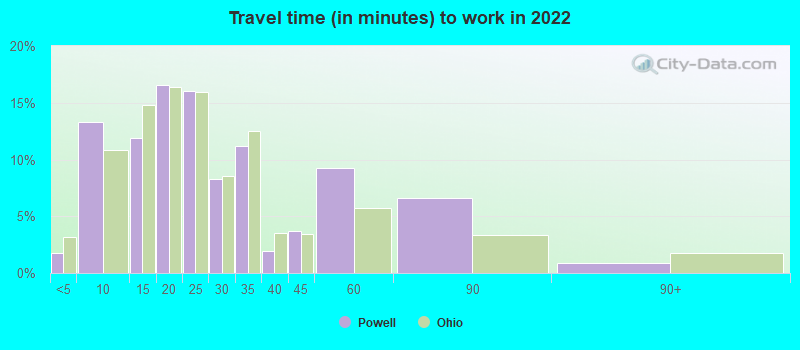
High school or higher: 98.6%Bachelor's degree or higher: 75.0%Graduate or professional degree: 32.6%Unemployed: 2.0%Mean travel time to work (commute): 16.5 minutes
Education Gini index (Inequality in education) Here:
7.8Ohio average:
11.0
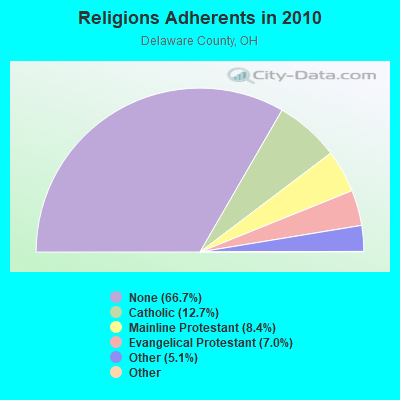
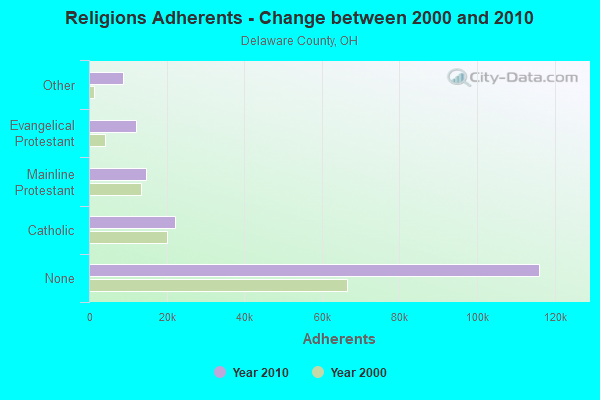
Religion statistics for Powell, OH (based on Delaware County data)
Religion Adherents Congregations Catholic 22,100 5 Mainline Protestant 14,636 41 Evangelical Protestant 12,235 61 Other 8,872 17 Black Protestant 139 1 Orthodox 114 1 None 116,118 -
Source: Clifford Grammich, Kirk Hadaway, Richard Houseal, Dale E.Jones, Alexei Krindatch, Richie Stanley and Richard H.Taylor. 2012. 2010 U.S.Religion Census: Religious Congregations & Membership Study. Association of Statisticians of American Religious Bodies. Jones, Dale E., et al. 2002. Congregations and Membership in the United States 2000. Nashville, TN: Glenmary Research Center. Graphs represent county-level data
Food Environment Statistics: Number of grocery stores : 17Delaware County :
1.06 / 10,000 pop.Ohio :
1.89 / 10,000 pop.
Number of supercenters and club stores : 4Here :
0.25 / 10,000 pop.Ohio :
0.13 / 10,000 pop.
Number of convenience stores (no gas) : 8This county :
0.50 / 10,000 pop.Ohio :
1.25 / 10,000 pop.
Number of convenience stores (with gas) : 31This county :
1.93 / 10,000 pop.Ohio :
2.93 / 10,000 pop.
Number of full-service restaurants : 116Here :
7.23 / 10,000 pop.Ohio :
6.25 / 10,000 pop.
Adult obesity rate : This county :
27.1%Ohio :
29.1%
Low-income preschool obesity rate : Health and Nutrition:
Average overall health of teeth and gums : People feeling badly about themselves : People not drinking alcohol at all : Average hours sleeping at night : General health condition : Average condition of hearing : More about Health and Nutrition of Powell, OH Residents
Local government employment and payroll (March 2022)
Function
Full-time employees
Monthly full-time payroll
Average yearly full-time wage
Part-time employees
Monthly part-time payroll
Other Government Administration
22 $32,579 $17,770 1 $599 Police Protection - Officers
20 $173,569 $104,141 0 $0 Streets and Highways
10 $58,252 $69,902 0 $0 Other and Unallocable
5 $30,271 $72,650 0 $0 Financial Administration
3 $21,682 $86,728 0 $0 Parks and Recreation
1 $7,201 $86,412 0 $0 Police - Other
1 $4,538 $54,456 0 $0
Totals for Government
62 $328,091 $63,501 1 $599
Powell government finances - Expenditure in 2017 (per resident):
Current Operations - General - Other: $3,389,000 ($235.51)
Police Protection: $2,590,000 ($179.99)Regular Highways: $1,521,000 ($105.70)Financial Administration: $626,000 ($43.50)Parks and Recreation: $424,000 ($29.46)Central Staff Services: $294,000 ($20.43)General Public Buildings: $157,000 ($10.91)General - Interest on Debt: $1,101,000 ($76.51)
Other Capital Outlay - General - Other: $3,942,000 ($273.94)
Total Salaries and Wages: $364,995,000 ($25364.49)
Powell government finances - Revenue in 2017 (per resident):
Charges - Parks and Recreation: $196,000 ($13.62)
Local Intergovernmental - General Local Government Support: $1,664,000 ($115.64)
Highways: $622,000 ($43.22)Miscellaneous - General Revenue - Other: $3,056,000 ($212.37)
Special Assessments: $1,601,000 ($111.26)Donations From Private Sources: $141,000 ($9.80)Interest Earnings: $70,000 ($4.86)Sale of Property: $44,000 ($3.06)Fines and Forfeits: $8,000 ($0.56)Tax - Individual Income: $6,093,000 ($423.42)
Property: $1,742,000 ($121.06)Occupation and Business License - Other: $958,000 ($66.57)Alcoholic Beverage License: $20,000 ($1.39)
Powell government finances - Debt in 2017 (per resident):
Long Term Debt - Beginning Outstanding - Unspecified Public Purpose: $27,530,000 ($1913.13)
Outstanding Unspecified Public Purpose: $25,375,000 ($1763.38)Retired Unspecified Public Purpose: $2,155,000 ($149.76)Short Term Debt Outstanding - End of Fiscal Year: $3,000,000 ($208.48)
Powell government finances - Cash and Securities in 2017 (per resident):
Bond Funds - Cash and Securities: $3,359,000 ($233.43)
Other Funds - Cash and Securities: $13,856,000 ($962.89)
Businesses in Powell, OH
Name Count Name Count
Advance Auto Parts 1 Nike 4 Applebee's 1 Panera Bread 1 Arby's 1 Pizza Hut 1 Blockbuster 1 Quiznos 1 Buffalo Wild Wings 1 Ruby Tuesday 1 CVS 2 Sprint Nextel 1 Caribou Coffee 1 Starbucks 2 Chipotle 2 Steak 'n Shake 1 Circle K 1 Subway 2 Curves 1 Taco Bell 1 FedEx 4 Tim Hortons 1 GNC 1 U-Haul 1 GameStop 1 UPS 5 H&R Block 1 Walgreens 2 Home Depot 1 Wendy's 1 KFC 1 White Castle 1 Kroger 1 YMCA 1 McDonald's 1
Strongest AM radio stations in Powell:
WRFD (880 AM; daytime; 23 kW; COLUMBUS-WORTHINGTON, OH; Owner: SALEM MEDIA OF OHIO, INC.)
WOSU (820 AM; 5 kW; COLUMBUS, OH; Owner: THE OHIO STATE UNIVERSITY)
WTVN (610 AM; 50 kW; COLUMBUS, OH; Owner: CITICASTERS LICENSES, L.P.)
WDLR (1550 AM; 4 kW; DELAWARE, OH; Owner: THE FIFTEEN FIFTY CORPORATION)
WBNS (1460 AM; 5 kW; COLUMBUS, OH; Owner: RADIOHIO, INCORPORATED)
WVKO (1580 AM; 1 kW; COLUMBUS, OH; Owner: ASSOCIATED RADIO, INC.)
WLW (700 AM; 50 kW; CINCINNATI, OH; Owner: JACOR BROADCASTING CORPORATION)
WKNR (850 AM; 50 kW; CLEVELAND, OH; Owner: CARON BROADCASTING, INC.)
WTAM (1100 AM; 50 kW; CLEVELAND, OH; Owner: JACOR BROADCASTING CORPORATION)
WHK (1220 AM; 50 kW; CLEVELAND, OH; Owner: CARON BROADCASTING, INC.)
WCOL (1230 AM; 1 kW; COLUMBUS, OH; Owner: CITICASTERS LICENSES, L.P.)
WWVA (1170 AM; 53 kW; WHEELING, WV; Owner: CAPSTAR TX LIMITED PARTNERSHIP)
WJR (760 AM; 50 kW; DETROIT, MI; Owner: ABC, INC.)
Strongest FM radio stations in Powell:
WSNY (94.7 FM; COLUMBUS, OH; Owner: FRANKLIN COMMUNICATIONS, INC.)
WBZX (99.7 FM; COLUMBUS, OH; Owner: NORTH AMERICAN BROADCASTING CO., INC)
WBNS-FM (97.1 FM; COLUMBUS, OH; Owner: RADIO OHIO, INC.)
W201AK (88.1 FM; COLUMBUS, OH; Owner: THE CEDARVILLE UNIVERSITY)
WOSU-FM (89.7 FM; COLUMBUS, OH; Owner: THE OHIO STATE UNIVERSITY)
WXMG (98.9 FM; UPPER ARLINGTON, OH; Owner: BLUE CHIP BROADCASTING LICENSES, LTD)
WCOL-FM (92.3 FM; COLUMBUS, OH; Owner: CITICASTERS LICENSES, L.P.)
WLVQ (96.3 FM; COLUMBUS, OH; Owner: INFINITY RADIO OPERATIONS INC.)
WODB (107.9 FM; DELAWARE, OH; Owner: FRANKLIN COMMUNICATIONS, INC.)
WEGE (103.9 FM; WESTERVILLE, OH; Owner: NORTH AMERICAN BROADCASTING CO. INC.)
WUFM (88.7 FM; COLUMBUS, OH; Owner: SPIRIT COMMUNICATIONS, INC)
WNCI (97.9 FM; COLUMBUS, OH; Owner: CITICASTERS LICENSES, L.P.)
WRVT (88.7 FM; RUTLAND, VT; Owner: VERMONT PUBLIC RADIO)
WFJX (105.7 FM; HILLIARD, OH; Owner: CITICASTERS LICENSES, L.P.)
WCBE (90.5 FM; COLUMBUS, OH; Owner: BD.OF EDUC.,CITY SCH.DIST.,COLUMBUS)
WCKX (107.5 FM; COLUMBUS, OH; Owner: BLUE CHIP BROADCASTING LICENSES, LTD)
WJZK (104.3 FM; RICHWOOD, OH; Owner: SCANTLAND BROADCASTING LTD)
WCVO (104.9 FM; GAHANNA, OH; Owner: CHRISTIAN VOICE OF CENTRAL OHIO)
WSMZ (103.1 FM; JOHNSTOWN, OH; Owner: STOP 26- RIVERBEND, INC.)
W272AT (102.3 FM; COLUMBUS, OH; Owner: INFINITY RADIO SUBSIDIARY OPERATIONS INC.)
TV broadcast stations around Powell:
WOSU-TV (Channel 34; COLUMBUS, OH; Owner: THE OHIO STATE UNIVERSITY)
WBNS-TV (Channel 10; COLUMBUS, OH; Owner: WBNS-TV, INC.)
WCMH-TV (Channel 4; COLUMBUS, OH; Owner: OUTLET BROADCASTING, INC.)
WSYX (Channel 6; COLUMBUS, OH; Owner: WSYX LICENSEE, INC.)
WTTE (Channel 28; COLUMBUS, OH; Owner: COLUMBUS (WTTE-TV) LICENSEE, INC.)
WCPX-LP (Channel 48; COLUMBUS, OH; Owner: PAXSON COMMUNICATIONS LICENSE COMPANY, LLC)
WINJ-LP (Channel 8; COLUMBUS, OH; Owner: THE NEW LIFE FELLOWSHIP OF CHURCHES)
WCLL-LP (Channel 19; COLUMBUS, OH; Owner: JONATHAN W. OWENS)
WDEM-LP (Channel 17; COLUMBUS, OH; Owner: TRIPLETT & ASSOCIATES, INC.)
W43BZ (Channel 43; COLUMBUS, OH; Owner: VENTANA TELEVISION, INC.)
WXCB-LP (Channel 42; DELAWARE, OH; Owner: CENTRAL OHIO ASSOCIATION OF CHRISTIAN BROADCASTERS)
W23BZ (Channel 23; COLUMBUS, OH; Owner: NATIONAL MINORITY T.V., INC.)
WMFD-TV (Channel 68; MANSFIELD, OH; Owner: MID-STATE TELEVISION,INC.)
WWHO (Channel 53; CHILLICOTHE, OH; Owner: UPN STATIONS GROUP INC.)
WBDT (Channel 26; SPRINGFIELD, OH; Owner: ACME TV LICENSES OF OHIO, LLC)
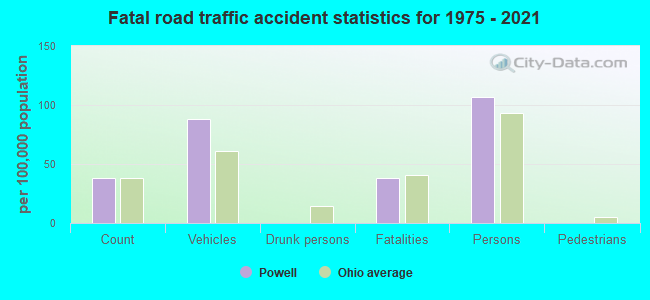
Powell fatal accident statistics for 1975 - 2021
Powell fatal accident list:
Oct 5, 2020 03:57 PM, Cr-609 Sawmill Pkwy, Woodcutter Dr, Lat: 40.190892, Lon: -83.095678, Vehicles: 2, Persons: 3, Fatalities: 1Lat: 40.166794, Lon: -83.076522, Vehicles: 2, Persons: 2, Fatalities: 1Vehicles: 2, Persons: 2, Fatalities: 1Vehicles: 3, Persons: 4, Fatalities: 1
National Bridge Inventory (NBI) Statistics 8 Number of bridges203ft / 62.4m Total length $999,999,000 Total costs47,184 Total average daily traffic1,722 Total average daily truck traffic81,870 Total future (year 2035) average daily traffic
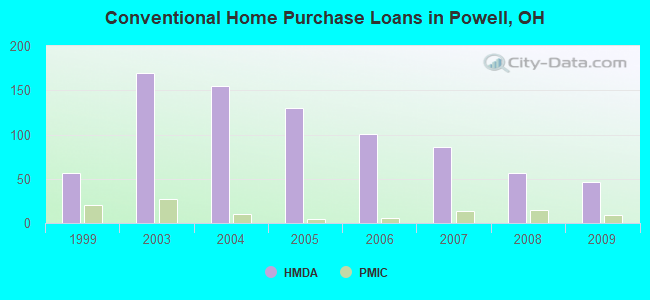
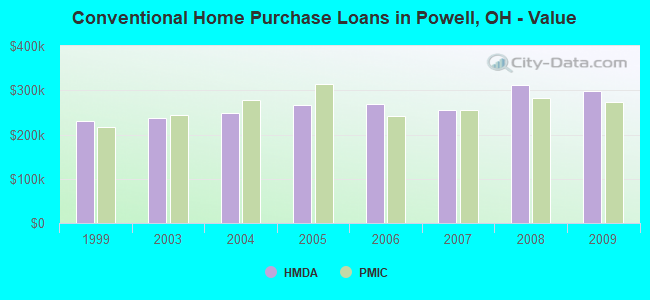
Home Mortgage Disclosure Act Aggregated Statistics For Year 2009(Based on 2 partial tracts) A) FHA, FSA/RHS & VA B) Conventional C) Refinancings D) Home Improvement Loans F) Non-occupant Loans on Number Average Value Number Average Value Number Average Value Number Average Value Number Average Value
LOANS ORIGINATED 12 $243,014 46 $298,672 251 $247,859 5 $123,690 3 $247,777 APPLICATIONS APPROVED, NOT ACCEPTED 1 $251,670 4 $258,048 15 $248,957 1 $218,290 0 $0 APPLICATIONS DENIED 3 $181,487 2 $227,625 36 $285,814 2 $98,695 1 $64,950 APPLICATIONS WITHDRAWN 2 $200,255 5 $332,734 25 $259,303 2 $103,720 0 $0 FILES CLOSED FOR INCOMPLETENESS 0 $0 2 $249,375 9 $280,984 1 $76,320 0 $0
Aggregated Statistics For Year 2008(Based on 2 partial tracts) A) FHA, FSA/RHS & VA B) Conventional C) Refinancings D) Home Improvement Loans F) Non-occupant Loans on Number Average Value Number Average Value Number Average Value Number Average Value Number Average Value
LOANS ORIGINATED 6 $258,205 57 $311,750 84 $262,309 4 $88,950 6 $198,578 APPLICATIONS APPROVED, NOT ACCEPTED 1 $109,150 7 $302,887 10 $288,896 1 $14,170 0 $0 APPLICATIONS DENIED 1 $336,600 6 $394,797 29 $279,167 2 $35,990 4 $369,998 APPLICATIONS WITHDRAWN 1 $218,790 4 $387,030 12 $246,564 0 $0 1 $126,670 FILES CLOSED FOR INCOMPLETENESS 0 $0 2 $248,520 5 $262,632 2 $68,535 0 $0
Aggregated Statistics For Year 2007(Based on 2 partial tracts) A) FHA, FSA/RHS & VA B) Conventional C) Refinancings D) Home Improvement Loans F) Non-occupant Loans on Number Average Value Number Average Value Number Average Value Number Average Value Number Average Value
LOANS ORIGINATED 1 $168,430 86 $256,174 65 $280,406 9 $124,386 13 $224,684 APPLICATIONS APPROVED, NOT ACCEPTED 0 $0 13 $276,698 11 $306,136 3 $48,747 2 $173,120 APPLICATIONS DENIED 0 $0 11 $226,503 43 $303,642 6 $142,998 7 $256,300 APPLICATIONS WITHDRAWN 0 $0 7 $344,630 12 $305,548 1 $94,620 1 $262,090 FILES CLOSED FOR INCOMPLETENESS 0 $0 3 $296,987 7 $305,833 0 $0 1 $196,060
Aggregated Statistics For Year 2006(Based on 2 partial tracts) A) FHA, FSA/RHS & VA B) Conventional C) Refinancings D) Home Improvement Loans F) Non-occupant Loans on Number Average Value Number Average Value Number Average Value Number Average Value Number Average Value
LOANS ORIGINATED 1 $121,120 101 $267,979 81 $238,578 8 $119,765 6 $171,607 APPLICATIONS APPROVED, NOT ACCEPTED 0 $0 10 $232,996 14 $281,001 1 $29,770 2 $107,865 APPLICATIONS DENIED 0 $0 10 $320,836 37 $276,450 1 $76,720 2 $149,680 APPLICATIONS WITHDRAWN 0 $0 9 $243,017 20 $248,828 1 $68,890 3 $218,447 FILES CLOSED FOR INCOMPLETENESS 0 $0 2 $446,230 9 $277,296 1 $30,910 0 $0
Aggregated Statistics For Year 2005(Based on 2 partial tracts) A) FHA, FSA/RHS & VA B) Conventional C) Refinancings D) Home Improvement Loans F) Non-occupant Loans on Number Average Value Number Average Value Number Average Value Number Average Value Number Average Value
LOANS ORIGINATED 0 $0 130 $266,986 108 $292,736 9 $109,964 7 $263,661 APPLICATIONS APPROVED, NOT ACCEPTED 0 $0 12 $267,946 18 $279,528 2 $85,285 0 $0 APPLICATIONS DENIED 1 $224,270 11 $231,767 39 $247,642 7 $123,807 1 $265,830 APPLICATIONS WITHDRAWN 0 $0 21 $298,512 22 $241,437 3 $76,117 2 $179,985 FILES CLOSED FOR INCOMPLETENESS 0 $0 3 $303,453 12 $273,975 1 $96,680 0 $0
Aggregated Statistics For Year 2004(Based on 2 partial tracts) A) FHA, FSA/RHS & VA B) Conventional C) Refinancings D) Home Improvement Loans F) Non-occupant Loans on Number Average Value Number Average Value Number Average Value Number Average Value Number Average Value
LOANS ORIGINATED 1 $123,440 155 $247,653 152 $251,061 8 $67,899 6 $226,447 APPLICATIONS APPROVED, NOT ACCEPTED 0 $0 14 $254,517 18 $231,211 2 $63,355 1 $174,560 APPLICATIONS DENIED 0 $0 10 $290,253 31 $256,028 3 $29,493 0 $0 APPLICATIONS WITHDRAWN 1 $106,590 19 $246,557 25 $307,206 2 $69,040 1 $236,490 FILES CLOSED FOR INCOMPLETENESS 0 $0 3 $185,363 7 $220,603 1 $27,790 0 $0
Aggregated Statistics For Year 2003(Based on 2 partial tracts) A) FHA, FSA/RHS & VA B) Conventional C) Refinancings D) Home Improvement Loans F) Non-occupant Loans on Number Average Value Number Average Value Number Average Value Number Average Value Number Average Value
LOANS ORIGINATED 2 $215,360 169 $238,288 524 $234,901 7 $47,071 8 $231,649 APPLICATIONS APPROVED, NOT ACCEPTED 1 $238,890 16 $246,500 46 $205,776 3 $35,163 1 $338,170 APPLICATIONS DENIED 0 $0 12 $239,393 43 $247,414 1 $37,120 1 $324,510 APPLICATIONS WITHDRAWN 0 $0 16 $228,021 37 $272,119 1 $52,500 1 $189,240 FILES CLOSED FOR INCOMPLETENESS 0 $0 2 $276,150 13 $259,097 0 $0 0 $0
Aggregated Statistics For Year 1999(Based on 1 partial tract) A) FHA, FSA/RHS & VA B) Conventional C) Refinancings D) Home Improvement Loans F) Non-occupant Loans on Number Average Value Number Average Value Number Average Value Number Average Value Number Average Value
LOANS ORIGINATED 1 $140,360 56 $230,010 35 $209,393 5 $32,248 1 $146,280 APPLICATIONS APPROVED, NOT ACCEPTED 0 $0 4 $217,762 5 $140,740 1 $31,370 0 $0 APPLICATIONS DENIED 0 $0 2 $183,085 7 $201,539 2 $28,135 0 $0 APPLICATIONS WITHDRAWN 0 $0 5 $227,142 5 $203,284 0 $0 0 $0 FILES CLOSED FOR INCOMPLETENESS 0 $0 1 $350,120 1 $192,890 0 $0 0 $0
Detailed HMDA statistics for the following Tracts:
0114.21
, 0114.23
Private Mortgage Insurance Companies Aggregated Statistics For Year 2009(Based on 2 partial tracts) A) Conventional B) Refinancings Number Average Value Number Average Value
LOANS ORIGINATED 9 $272,351 8 $260,181 APPLICATIONS APPROVED, NOT ACCEPTED 1 $555,940 1 $352,590 APPLICATIONS DENIED 0 $0 1 $329,180 APPLICATIONS WITHDRAWN 0 $0 1 $194,130 FILES CLOSED FOR INCOMPLETENESS 0 $0 0 $0
Aggregated Statistics For Year 2008(Based on 2 partial tracts) A) Conventional B) Refinancings C) Non-occupant Loans on Number Average Value Number Average Value Number Average Value
LOANS ORIGINATED 15 $282,513 4 $284,098 1 $268,710 APPLICATIONS APPROVED, NOT ACCEPTED 3 $270,143 2 $195,455 0 $0 APPLICATIONS DENIED 3 $299,737 0 $0 0 $0 APPLICATIONS WITHDRAWN 1 $192,180 0 $0 0 $0 FILES CLOSED FOR INCOMPLETENESS 0 $0 1 $124,470 0 $0
Aggregated Statistics For Year 2007(Based on 2 partial tracts) A) Conventional B) Refinancings C) Non-occupant Loans on Number Average Value Number Average Value Number Average Value
LOANS ORIGINATED 14 $254,254 4 $318,080 2 $265,370 APPLICATIONS APPROVED, NOT ACCEPTED 1 $227,720 1 $353,170 0 $0 APPLICATIONS DENIED 0 $0 0 $0 0 $0 APPLICATIONS WITHDRAWN 1 $197,660 1 $330,300 0 $0 FILES CLOSED FOR INCOMPLETENESS 0 $0 0 $0 0 $0
Aggregated Statistics For Year 2006(Based on 2 partial tracts) A) Conventional B) Refinancings Number Average Value Number Average Value
LOANS ORIGINATED 6 $240,830 1 $612,540 APPLICATIONS APPROVED, NOT ACCEPTED 2 $274,135 1 $314,290 APPLICATIONS DENIED 1 $173,260 1 $384,180 APPLICATIONS WITHDRAWN 0 $0 0 $0 FILES CLOSED FOR INCOMPLETENESS 0 $0 0 $0
Aggregated Statistics For Year 2005(Based on 2 partial tracts) A) Conventional B) Refinancings Number Average Value Number Average Value
LOANS ORIGINATED 5 $313,418 4 $283,440 APPLICATIONS APPROVED, NOT ACCEPTED 1 $256,660 1 $431,320 APPLICATIONS DENIED 0 $0 0 $0 APPLICATIONS WITHDRAWN 0 $0 0 $0 FILES CLOSED FOR INCOMPLETENESS 0 $0 0 $0
Aggregated Statistics For Year 2004(Based on 2 partial tracts) A) Conventional B) Refinancings Number Average Value Number Average Value
LOANS ORIGINATED 10 $277,751 7 $231,024 APPLICATIONS APPROVED, NOT ACCEPTED 2 $271,775 4 $273,938 APPLICATIONS DENIED 1 $132,240 0 $0 APPLICATIONS WITHDRAWN 2 $190,980 0 $0 FILES CLOSED FOR INCOMPLETENESS 0 $0 0 $0
Aggregated Statistics For Year 2003(Based on 2 partial tracts) A) Conventional B) Refinancings C) Non-occupant Loans on Number Average Value Number Average Value Number Average Value
LOANS ORIGINATED 27 $244,154 33 $243,968 1 $305,290 APPLICATIONS APPROVED, NOT ACCEPTED 6 $256,852 9 $229,131 0 $0 APPLICATIONS DENIED 0 $0 0 $0 0 $0 APPLICATIONS WITHDRAWN 1 $281,810 1 $179,800 0 $0 FILES CLOSED FOR INCOMPLETENESS 0 $0 0 $0 0 $0
Aggregated Statistics For Year 1999(Based on 1 partial tract) A) Conventional B) Refinancings Number Average Value Number Average Value
LOANS ORIGINATED 20 $216,322 3 $215,263 APPLICATIONS APPROVED, NOT ACCEPTED 1 $310,260 1 $112,910 APPLICATIONS DENIED 1 $148,380 0 $0 APPLICATIONS WITHDRAWN 0 $0 0 $0 FILES CLOSED FOR INCOMPLETENESS 0 $0 0 $0
Detailed PMIC statistics for the following Tracts:
0114.21
, 0114.23 Powell compared to Ohio state average:
Median household income significantly above state average. Median house value significantly above state average. Unemployed percentage significantly below state average. Black race population percentage significantly below state average. Hispanic race population percentage below state average. Foreign-born population percentage significantly above state average. Renting percentage significantly below state average. Number of rooms per house significantly above state average. House age significantly below state average. Percentage of population with a bachelor's degree or higher significantly above state average.
#48 on the list of "Top 101 cities with largest percentage of males in occupations: health diagnosing and treating practitioners and other technical occupations (population 5,000+)"
#50 on the list of "Top 101 cities with largest percentage of females in occupations: business and financial operations occupations (population 5,000+)"
#54 on the list of "Top 100 cities with biggest houses (pop. 5,000+)"
#67 on the list of "Top 101 cities with largest percentage of males in industries: health care and social assistance (population 5,000+)"
#79 on the list of "Top 101 cities with largest percentage of females in industries: finance and insurance (population 5,000+)"
#14 on the list of "Top 101 counties with the largest decrease in the number of births per 1000 residents 2000-2006 to 2007-2013 (pop 50,000+)"
#92 on the list of "Top 101 counties with the lowest number of deaths per 1000 residents 2007-2013"
#95 on the list of "Top 101 counties with the largest number of children under 18 without health insurance coverage in 2000"
Top Patent Applicants
Brian K. Lickfelt (26)
Chad E. Bouton (16)
Vincent J. Contini (14)
William M. Hathaway (12)
Hideaki Arai (12)
Jack Bruce Wallace (12)
Vincent Contini (10)
Thomas A. Klausing (9)
John W. Lucek (9)
Jean-Baptiste Bezelgues (8)
Total of 740 patent applications in 2008-2024.


 Recent articles from our blog. Our writers, many of them Ph.D. graduates or candidates, create easy-to-read articles on a wide variety of topics.

 (12.4 miles
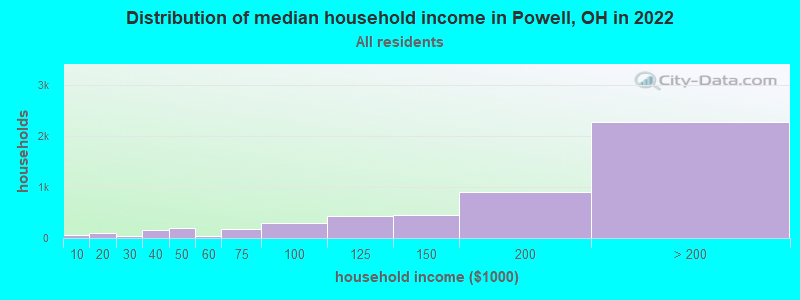
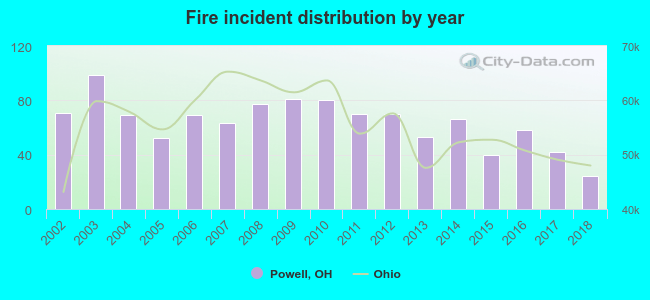 According to the data from the years 2002 - 2018 the average number of fires per year is 64. The highest number of reported fire incidents - 99 took place in 2003, and the least - 24 in 2018. The data has a dropping trend.
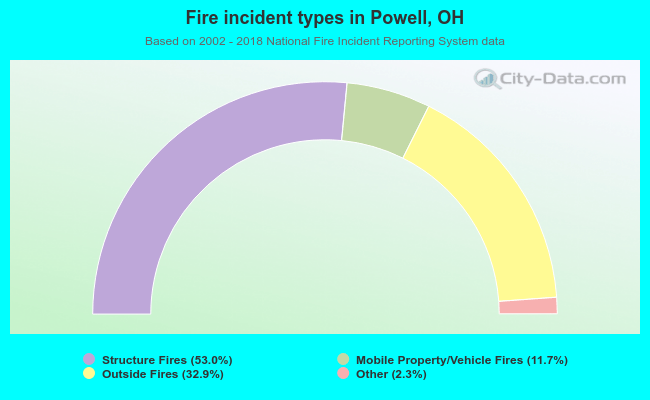 When looking into fire subcategories, the most reports belonged to: Structure Fires (53.0%), and Outside Fires (32.9%).