Estimated zip code population in 2022: 17,384 Zip code population in 2010: 19,050 Zip code population in 2000: 21,074
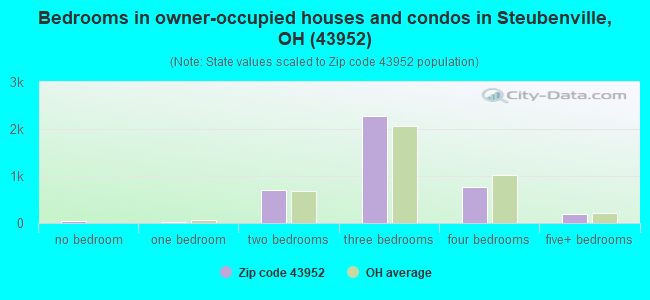
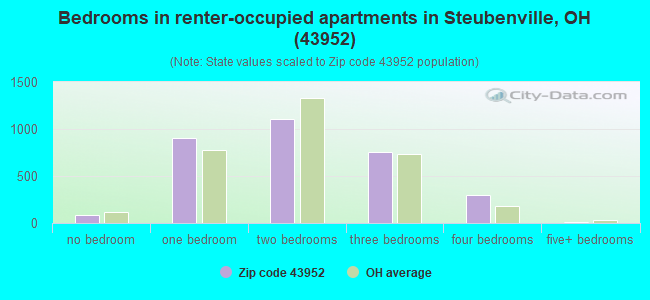
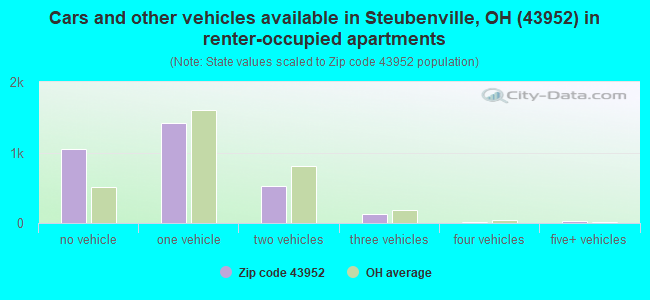
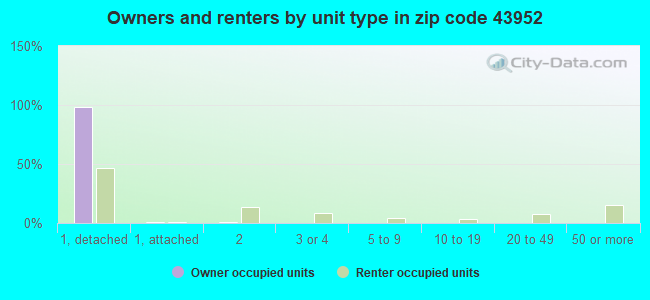
Houses and condos: 8,761 Renter-occupied apartments: 3,167
% of renters here:
44%
State:
33%
March 2022 cost of living index in zip code 43952: 88.7 (less than average, U.S. average is 100)
Land area: 25.8 sq. mi. Water area: 0.4 sq. mi.
Population density: 673 people per square mile
(low).
OSM Map
General Map
Google Map
MSN Map
OSM Map
General Map
Google Map
MSN Map
OSM Map
General Map
Google Map
MSN Map
OSM Map
General Map
Google Map
MSN Map
Please wait while loading the map...
Real estate property taxes paid for housing units in 2022:
This zip code:
0.9% ($1,196)
Ohio:
1.3% ($2,639)
Median real estate property taxes paid for housing units with mortgages in 2022: $1,357 (0.9%) Median real estate property taxes paid for housing units with no mortgage in 2022: $948 (0.9%)
Business Search- 14 Million verified businesses
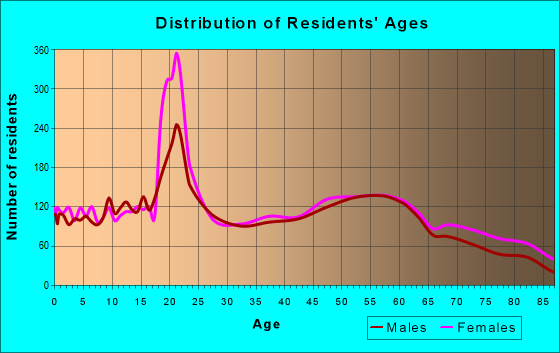
Males: 8,544
(49.1%)
Females: 8,840
(50.9%)
For population 25 years and over in 43952:
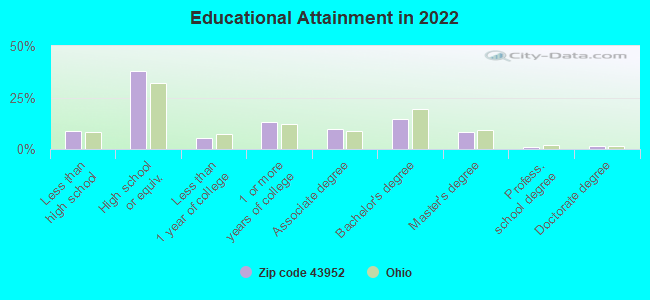
High school or higher: 90.8%
Bachelor's degree or higher: 25.2%
Graduate or professional degree: 10.9%
Unemployed: 6.6%
Mean travel time to work (commute): 19.3 minutes
For population 15 years and over in 43952:
Never married: 45.1%
Now married: 34.2%
Separated: 1.5%
Widowed: 6.2%
Divorced: 13.0%
Zip code 43952 compared to state average:
Median household income below state average.
Median house value below state average.
Unemployed percentage above state average.
Foreign-born population percentage below state average.
Length of stay since moving in significantly above state average.
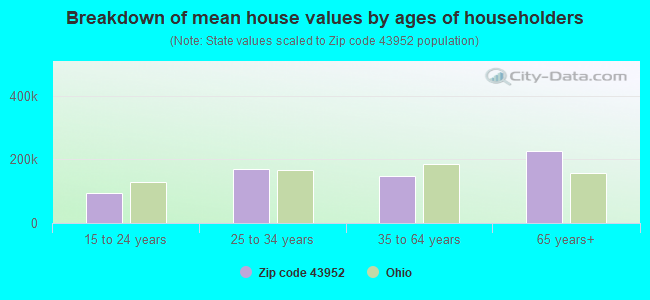
Estimated median house/condo value in 2022: $133,283
43952:
$133,283
Ohio:
$204,100
According to our research of Ohio and other state lists, there were 36 registered sex offenders living in 43952 zip code as of April 27, 2024. The ratio of all residents to sex offenders in zip code 43952 is 527 to 1. The ratio of registered sex offenders to all residents in this zip code is near the state average.
Median resident age:
This zip code:
36.7 years
Ohio median age:
39.9 years
Average household size:
This zip code:
2.2 people
Ohio:
2.4 people
Averages for the 2020 tax year for zip code 43952, filed in 2021:
Average Adjusted Gross Income (AGI) in 2020: $45,081 (Individual Income Tax Returns)
Here:
$45,081
State:
$67,288
Salary/wage: $38,112 (reported on 79.4% of returns)
Here:
$38,112
State:
$55,628
(% of AGI for various income ranges: 1015.2% for AGIs below $25k, 3253.4% for AGIs $25k-50k, 5731.1% for AGIs $50k-75k, 8630.0% for AGIs $75k-100k, 15458.3% for AGIs $100k-200k, 71995.0% for AGIs over 200k)
Taxable interest for individuals: $795 (reported on 21.2% of returns)
This zip code:
$795
Ohio:
$1,518
(% of AGI for various income ranges: 6.9% for AGIs below $25k, 12.5% for AGIs $25k-50k, 32.6% for AGIs $50k-75k, 39.2% for AGIs $75k-100k, 54.9% for AGIs $100k-200k, 1375.0% for AGIs over 200k)
Ordinary dividends: $4,009 (reported on 12.8% of returns)
Here:
$4,009
State:
$7,167
(% of AGI for various income ranges: 11.5% for AGIs below $25k, 25.1% for AGIs $25k-50k, 83.8% for AGIs $50k-75k, 116.6% for AGIs $75k-100k, 251.7% for AGIs $100k-200k, 5635.0% for AGIs over 200k)
Net capital gain/loss in AGI: +$9,319 (reported on 10.7% of returns)
Here:
+$9,319
State:
+$18,919
(% of AGI for various income ranges: 6.2% for AGIs below $25k, 18.0% for AGIs $25k-50k, 52.1% for AGIs $50k-75k, 195.5% for AGIs $75k-100k, 289.7% for AGIs $100k-200k, 23390.0% for AGIs over 200k)
Profit/loss from business: +$9,956 (reported on 11.5% of returns)
Here:
+$9,956
State:
+$13,744
(% of AGI for various income ranges: 88.3% for AGIs below $25k, 73.1% for AGIs $25k-50k, 114.1% for AGIs $50k-75k, 227.1% for AGIs $75k-100k, 696.0% for AGIs $100k-200k, 4260.0% for AGIs over 200k)
Taxable individual retirement arrangement distribution: $15,998 (reported on 8.3% of returns)
43952:
$15,998
Ohio:
$18,876
(% of AGI for various income ranges: 31.6% for AGIs below $25k, 93.5% for AGIs $25k-50k, 147.6% for AGIs $50k-75k, 330.0% for AGIs $75k-100k, 857.4% for AGIs $100k-200k, 10600.0% for AGIs over 200k)
Total itemized deductions: $34,769 (reported on 1.8% of returns)
Here:
$34,769
State:
$33,869
(% of AGI for various income ranges: 53.4% for AGIs $25k-50k, 136.7% for AGIs $50k-75k, 273.7% for AGIs $100k-200k, 8400.0% for AGIs over 200k)
Charity contributions: $16,180 (reported on 1.4% of returns)
Here:
$16,180
State:
$14,577
(% of AGI for various income ranges: 6.6% for AGIs $25k-50k, 41.2% for AGIs $50k-75k, 71.1% for AGIs $100k-200k, 4755.0% for AGIs over 200k)
Taxes paid: $5,662 (reported on 1.8% of returns)
43952:
$5,662
State:
$7,681
(% of AGI for various income ranges: 4.5% for AGIs $25k-50k, 24.5% for AGIs $50k-75k, 66.0% for AGIs $100k-200k, 1240.0% for AGIs over 200k)
Earned income credit: $2,376 (reported on 22.4% of returns)
Here:
$2,376
State:
$2,304
(% of AGI for various income ranges: 113.6% for AGIs below $25k, 67.4% for AGIs $25k-50k, 1.8% for AGIs $50k-75k)
Percentage of individuals using paid preparers for their 2020 taxes: 94.4%
Here:
94%
State:
94%
(% for various income ranges: 94.0% for AGIs below $25k, 94.9% for AGIs $25k-50k, 93.9% for AGIs $50k-75k, 96.2% for AGIs $75k-100k, 93.3% for AGIs $100k-200k, 100.0% for AGIs over 200k)
Averages for the 2012 tax year for zip code 43952, filed in 2013:
Average Adjusted Gross Income (AGI) in 2012: $43,362 (Individual Income Tax Returns)
Here:
$43,362
State:
$54,926
Salary/wage: $33,820 (reported on 81.0% of returns)
Here:
$33,820
State:
$45,869
(% of AGI for various income ranges: 71.3% for AGIs below $25k, 72.2% for AGIs $25k-50k, 71.9% for AGIs $50k-75k, 73.3% for AGIs $75k-100k, 68.2% for AGIs $100k-200k, 26.5% for AGIs over 200k)
Taxable interest for individuals: $1,691 (reported on 27.8% of returns)
This zip code:
$1,691
Ohio:
$1,297
(% of AGI for various income ranges: 1.1% for AGIs below $25k, 0.7% for AGIs $25k-50k, 0.8% for AGIs $50k-75k, 0.8% for AGIs $75k-100k, 0.7% for AGIs $100k-200k, 2.3% for AGIs over 200k)
Ordinary dividends: $7,296 (reported on 15.3% of returns)
Here:
$7,296
State:
$5,821
(% of AGI for various income ranges: 1.0% for AGIs below $25k, 0.8% for AGIs $25k-50k, 1.1% for AGIs $50k-75k, 1.2% for AGIs $75k-100k, 2.0% for AGIs $100k-200k, 8.8% for AGIs over 200k)
Net capital gain/loss in AGI: +$5,021 (reported on 10.4% of returns)
Here:
+$5,021
State:
+$11,232
(% of AGI for various income ranges: 0.2% for AGIs $25k-50k, 0.2% for AGIs $50k-75k, 1.0% for AGIs $75k-100k, 1.4% for AGIs $100k-200k, 4.3% for AGIs over 200k)
Profit/loss from business: +$10,379 (reported on 10.6% of returns)
Here:
+$10,379
State:
+$12,773
(% of AGI for various income ranges: 6.3% for AGIs below $25k, 2.0% for AGIs $25k-50k, 1.2% for AGIs $50k-75k, 2.0% for AGIs $75k-100k, 2.7% for AGIs $100k-200k, 1.9% for AGIs over 200k)
Taxable individual retirement arrangement distribution: $11,039 (reported on 10.2% of returns)
43952:
$11,039
Ohio:
$14,511
(% of AGI for various income ranges: 2.0% for AGIs below $25k, 2.3% for AGIs $25k-50k, 3.2% for AGIs $50k-75k, 2.4% for AGIs $75k-100k, 3.7% for AGIs $100k-200k, 2.0% for AGIs over 200k)
Total itemized deductions: $21,740 (19% of AGI, reported on 14.7% of returns)
Here:
$21,740
State:
$21,278
Here:
18.6% of AGI
State:
18.8% of AGI
(% of AGI for various income ranges: 3.8% for AGIs below $25k, 4.7% for AGIs $25k-50k, 5.9% for AGIs $50k-75k, 7.4% for AGIs $75k-100k, 10.4% for AGIs $100k-200k, 11.9% for AGIs over 200k)
Charity contributions: $3,784 (reported on 11.6% of returns)
Here:
$3,784
State:
$3,943
(% of AGI for various income ranges: 0.3% for AGIs below $25k, 0.7% for AGIs $25k-50k, 0.9% for AGIs $50k-75k, 1.1% for AGIs $75k-100k, 1.5% for AGIs $100k-200k, 1.5% for AGIs over 200k)
Taxes paid: $8,157 (reported on 14.6% of returns)
43952:
$8,157
State:
$9,568
(% of AGI for various income ranges: 0.4% for AGIs below $25k, 1.0% for AGIs $25k-50k, 1.7% for AGIs $50k-75k, 2.5% for AGIs $75k-100k, 4.1% for AGIs $100k-200k, 6.6% for AGIs over 200k)
Earned income credit: $2,286 (reported on 24.0% of returns)
Here:
$2,286
State:
$2,285
(% of AGI for various income ranges: 7.8% for AGIs below $25k, 0.9% for AGIs $25k-50k)
Percentage of individuals using paid preparers for their 2012 taxes: 52.5%
Here:
53%
State:
51%
(% for various income ranges: 47.2% for AGIs below $25k, 53.0% for AGIs $25k-50k, 58.7% for AGIs $50k-75k, 62.5% for AGIs $75k-100k, 65.9% for AGIs $100k-200k, 77.8% for AGIs over 200k)
Averages for the 2004 tax year for zip code 43952, filed in 2005:
Average Adjusted Gross Income (AGI) in 2004: $37,506 (Individual Income Tax Returns)
Here:
$37,506
State:
$44,480
Salary/wage: $28,715 (reported on 80.6% of returns)
Here:
$28,715
State:
$39,198
(% of AGI for various income ranges: 88.6% for AGIs below $10k, 67.0% for AGIs $10k-25k, 74.5% for AGIs $25k-50k, 78.2% for AGIs $50k-75k, 78.8% for AGIs $75k-100k, 30.0% for AGIs over 100k)
Taxable interest for individuals: $1,973 (reported on 42.8% of returns)
This zip code:
$1,973
Ohio:
$1,532
(% of AGI for various income ranges: 5.7% for AGIs below $10k, 3.6% for AGIs $10k-25k, 2.1% for AGIs $25k-50k, 1.4% for AGIs $50k-75k, 2.0% for AGIs $75k-100k, 2.1% for AGIs over 100k)
Taxable dividends: $5,752 (reported on 20.2% of returns)
Here:
$5,752
State:
$3,496
(% of AGI for various income ranges: 2.2% for AGIs below $10k, 1.4% for AGIs $10k-25k, 1.1% for AGIs $25k-50k, 1.4% for AGIs $50k-75k, 1.9% for AGIs $75k-100k, 7.1% for AGIs over 100k)
Net capital gain/loss: +$7,861 (reported on 15.0% of returns)
Here:
+$7,861
State:
+$8,582
(% of AGI for various income ranges: -1.4% for AGIs below $10k, -0.1% for AGIs $10k-25k, 0.0% for AGIs $25k-50k, 0.8% for AGIs $50k-75k, 1.0% for AGIs $75k-100k, 9.8% for AGIs over 100k)
Profit/loss from business: +$12,992 (reported on 9.4% of returns)
Here:
+$12,992
State:
+$10,813
(% of AGI for various income ranges: 0.9% for AGIs below $10k, 2.1% for AGIs $10k-25k, 2.0% for AGIs $25k-50k, 2.2% for AGIs $50k-75k, 2.4% for AGIs $75k-100k, 5.9% for AGIs over 100k)
IRA payment deduction: $2,397 (reported on 1.9% of returns)
43952:
$2,397
Ohio:
$2,794
(% of AGI for various income ranges: 0.1% for AGIs $10k-25k, 0.2% for AGIs $25k-50k, 0.2% for AGIs $50k-75k, 0.1% for AGIs $75k-100k, 0.1% for AGIs over 100k)
Self-employed pension: $15,381 (reported on 0.3% of returns)
Here:
$15,381
Ohio:
$13,981
Total itemized deductions: $16,949 (16% of AGI, reported on 15.9% of returns)
Here:
$16,949
State:
$17,503
Here:
15.5% of AGI
State:
20.8% of AGI
(% of AGI for various income ranges: 3.3% for AGIs below $10k, 3.3% for AGIs $10k-25k, 6.0% for AGIs $25k-50k, 7.6% for AGIs $50k-75k, 9.6% for AGIs $75k-100k, 9.0% for AGIs over 100k)
Charity contributions deductions: $3,258 (3% of AGI, reported on 14.0% of returns)
Here:
$3,258
State:
$3,087
Here:
2.8% of AGI
State:
3.4% of AGI
(% of AGI for various income ranges: 0.2% for AGIs below $10k, 0.4% for AGIs $10k-25k, 0.9% for AGIs $25k-50k, 1.2% for AGIs $50k-75k, 1.6% for AGIs $75k-100k, 1.7% for AGIs over 100k)
Total tax: $5,853 (reported on 68.3% of returns)
43952:
$5,853
State:
$6,781
(% of AGI for various income ranges: 1.6% for AGIs below $10k, 3.6% for AGIs $10k-25k, 7.1% for AGIs $25k-50k, 9.6% for AGIs $50k-75k, 11.1% for AGIs $75k-100k, 17.9% for AGIs over 100k)
Earned income credit: $1,563 (reported on 19.8% of returns)
Here:
$1,563
State:
$1,696
Percentage of individuals using paid preparers for their 2004 taxes: 54.8%
Here:
55%
State:
55%
(% for various income ranges: 47.7% for AGIs below $10k, 55.3% for AGIs $10k-25k, 57.0% for AGIs $25k-50k, 57.3% for AGIs $50k-75k, 58.5% for AGIs $75k-100k, 74.7% for AGIs over 100k)
Likely homosexual households (counted as self-reported same-sex unmarried-partner households)
Lesbian couples: 0.1% of all households
Gay men: 0.1% of all households
Household received Food Stamps/SNAP in the past 12 months: 1,629 Household did not receive Food Stamps/SNAP in the past 12 months: 5,604
Women who had a birth in the past 12 months: 121 (85 now married, 36 unmarried) Women who did not have a birth in the past 12 months: 4,193 (1,052 now married, 3,143 unmarried)
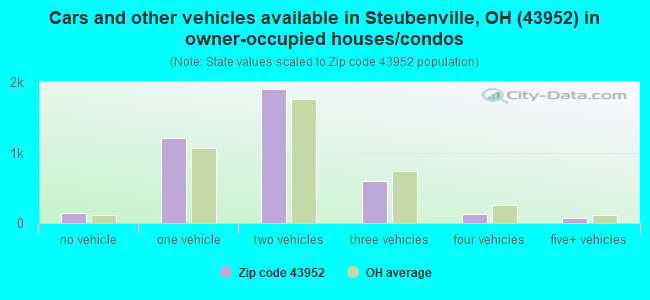
Housing units in zip code 43952 with a mortgage: 1,988 (311 second mortgage, 318 both second mortgage and home equity loan) Houses without a mortgage: 183
Median monthly owner costs for units with a mortgage: $1,077 Median monthly owner costs for units without a mortgage: $445
Residents with income below the poverty level in 2022:
This zip code:
26.8%
Whole state:
13.4%
Residents with income below 50% of the poverty level in 2022:
This zip code:
12.0%
Whole state:
7.0%
Median number of rooms in houses and condos:
Here:
6.6
State:
6.7
Median number of rooms in apartments:
Here:
4.7
State:
4.4
Notable locations in this zip code not listed on our city pages
Notable locations in zip code 43952: Jefferson County Industrial Park (A), Harding Stadium (B), Ambulance Service (C), John Paul II Library (D), Schiappa Memorial Library (E), Saint John Community Arena (F), Steubenville and Jefferson County Public Library (G), Steubenville City Hall (H), Jefferson County Courthouse (I), Jefferson County Historical Association Museum (J), McCollough Childrens Home (K), Steubenville Fire Department North Street Station (L), Pottery Addition Volunteer Fire Department (M), Pleasant Hill Volunteer Fire Department (N), Steubenville Fire Department Adams Street Station (O), Steubenville Fire Department West End Station (P), Trinity Hall (Q), Starvaggi Hall (R), Saints Cosmos and Damian Science Hall (S), Saint Thomas Moore Hall (T). Display/hide their locations on the map
Churches in zip code 43952 include: Buena Vista United Methodist Church (A), Calvary United Methodist Church (B), Church of the United Brethren in Christ (C), Emmanuel Church of Christ in Christ (D), Fifth Street United Methodist Church (E), First Baptist Church of Steubenville (F), First Christian Church (G), First Church of the Nazarene (H), First Westminster Presbyterian Church (I). Display/hide their locations on the map
Cemeteries: Bnai Israel Cemetery (1), Union Cemetery (2), Holy Resurrection Cemetery (3), Center Chapel Cemetery (4), Mount Calvary Cemetery (5), Coulter Private Cemetery (6). Display/hide their locations on the map
Streams, rivers, and creeks: Wills Creek (A), Island Creek (B), Cedar Creek (C), Wells Run (D), Rush Run (E), Permars Run (F). Display/hide their locations on the map
Parks in zip code 43952 include: Belleview Municipal Park (1), Steubenville Commercial Historic District (2), Fort Steuben Historical Site (3), Woodview Park (4), Beatty Park Number 1 (5), Beatty Park Number 2 (6), Vaccaro Baseball Field (7). Display/hide their locations on the map
1,484 married couples with children.
991 single-parent households (171 men, 820 women).
95.6% of residents of 43952 zip code speak English at home.
2.4% of residents speak Spanish at home (70% very well, 16% well, 14% not well).
0.9% of residents speak other Indo-European language at home (97% very well, 3% not well).
0.8% of residents speak Asian or Pacific Island language at home (20% very well, 52% well, 28% not well).
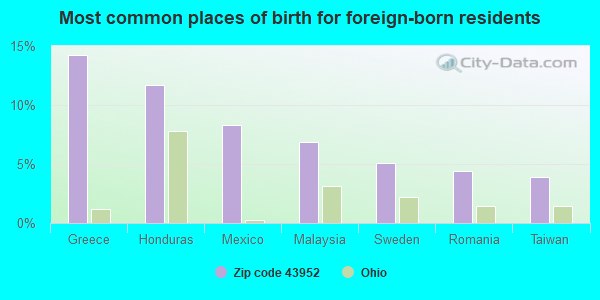
Foreign born population: 436 (2.5%) (73.8% of them are naturalized citizens)
Facilities with environmental interests located in this zip code:
BARIUM & CHEMICALS INC (515 KINGSDALE ROAD in STEUBENVILLE, OH)
(Integrated Compliance Information System) - ICIS-05-1996-0378, FORMAL ENFORCEMENT ACTION STATE MASTER (Ohio general info) - PCS-OH0011886, National Pollutant Discharge Elimination System Permit, AIR MAJOR, EPCRA, TRIS-43952BRMCHCOUNT, TRI REPORTER, RCRA-OHD004323465, HAZARDOUS WASTE PROGRAM National Pollutant Discharge Elimination System NON-MAJOR (Tracking pollutant discharge elimination systems) - permit National Pollutant Discharge Elimination System NON-MAJOR (Tracking pollutant discharge elimination systems) - permit HAZARDOUS WASTE BIENNIAL REPORTER (Resource Conservation and Recovery Act (tracking hazardous waste)) Small Quantity Generators, between 100 kg and 1000 kg of hazardous waste/month (Resource Conservation and Recovery Act (tracking hazardous waste)) TSD (Resource Conservation and Recovery Act (tracking hazardous waste)) TRI REPORTER (Tracking of toxic chemicals releasing facilities) Business SIC classification: INDUSTRIAL INORGANIC CHEMICALS Organizations: BARIUM AND CHEMICALS INC (CONTACT/OWNER)
ALBERT MOTORS INC DBA BIGGIO FORD LINCOLN MERCURY (905 BRADY AVE in STEUBENVILLE, OH)
STATE MASTER (Ohio general info) - RCRA-OHD018328609, HAZARDOUS WASTE PROGRAM (Resource Conservation and Recovery Act (tracking hazardous waste)) Organizations: GEARY TERAMANA (CONTACT/OWNER)
Alternative names: ALBERT MOTORS INC DBA BIGGIO FORD LIN ME
AMERICAN CLEANERS (520 MAIN STREET in WINTERSVILLE, OH)
AIR MINOR (AIRS/AFS) STATE MASTER (Ohio general info) - AIR MAJOR Business SIC classification: DRYCLEANING PLANTS, EXCEPT RUG CLEANING
ASHLAND BRANDED BULK PLANT NO 940 (WILLIAM BLVD AND COAL HILL in STEUBENVILLE, OH)
STATE MASTER (Ohio general info) - AIR MAJOR (Resource Conservation and Recovery Act (tracking hazardous waste)) Organizations: ASHLAND BRANDED MARKETING INC (CONTACT/OWNER)
Alternative names: ASHLAND BRANDED MARKETING
ALLEN OIL INC (2105 ST RTE 7 in STEUBENVILLE, OH)
STATE MASTER (Ohio general info) - AIR MAJOR, EPCRA, PCS-OH0127833, National Pollutant Discharge Elimination System Permit National Pollutant Discharge Elimination System NON-MAJOR (Tracking pollutant discharge elimination systems) - permit Business SIC classification: PETROLEUM BULK STATIONS AND TERMINALS
AQUINAS ELEMENTARY SCHOOL (LOVERS LANE in STEUBENVILLE, OH)
AIR MINOR (AIRS/AFS) STATE MASTER (Ohio general info) - AIR MAJOR Business SIC classification: ELEMENTARY AND SECONDARY SCHOOLS
ACI STANDARD (DETMAR RD B4-43 in STEUBENVILLE, OH)
STATE MASTER (Ohio general info) - AIR MAJOR TSD (Resource Conservation and Recovery Act (tracking hazardous waste)) Organizations: AMERICAN CARBON INDUST (CONTACT/OWNER)
AAMCO TRANSMISSIONS (119 S SEVENTH ST in STEUBENVILLE, OH)
(Resource Conservation and Recovery Act (tracking hazardous waste)) Organizations: LIPPS ROY C (CONTACT/OWNER)
APEX ENERGY INC (SPRINGFIELD/GERMAN TOWNSHIP in STEUBENVILLE, OH)
National Pollutant Discharge Elimination System NON-MAJOR (Tracking pollutant discharge elimination systems) - permit Business SIC classification: NONCLASSIFIABLE ESTABLISHMENTS Organizations: APEX ENVIRONMENTAL LLC (CONTACT/OWNER)
ARCO STEUBENVILLE TERMINAL (2B379 KINGSDALE ROAD in STEUBENVILLE, OH)
(Resource Conservation and Recovery Act (tracking hazardous waste))
ADVANCED AUTO GLASS INC (4429 SUNSET BLVD in STEUBENVILLE, OH)
(Resource Conservation and Recovery Act (tracking hazardous waste))
APEX ENERGY (ROAD 1 COUNTY ROAD 43 in STEUBENVILLE, OH)
AIR MINOR (AIRS/AFS) Business SIC classification: NONCLASSIFIABLE ESTABLISHMENTS
Housing units lacking complete plumbing facilities: 3.8% Housing units lacking complete kitchen facilities: 4.8%
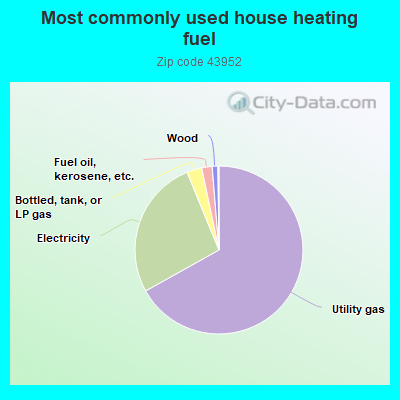
66.9%Utility gas
26.9%Electricity
2.9%Bottled, tank, or LP gas
2.0%Fuel oil, kerosene, etc.
1.1%Wood
Population in 1990: 35,873.
Place of birth for U.S.-born residents:
This state: 10,178
Northeast: 2,042
Midwest: 926
South: 3,202
West: 517
62% of the 43952 zip code residents lived in the same house 5 years ago. Out of people who lived in different houses, 62% lived in this county. Out of people who lived in different counties, 50% lived in Ohio.
91% of the 43952 zip code residents lived in the same house 1 year ago. Out of people who lived in different houses, 50% moved from this county. Out of people who lived in different houses, 20% moved from different county within same state. Out of people who lived in different houses, 27% moved from different state. Out of people who lived in different houses, 4% moved from abroad.
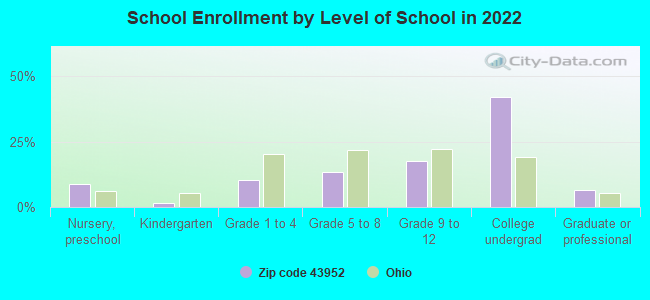
Private vs. public school enrollment:
Students in private schools in grades 1 to 8 (elementary and middle school): 258
Here:
23.4%
Ohio:
16.0%
Students in private schools in grades 9 to 12 (high school): 152
Here:
18.6%
Ohio:
13.1%
Students in private undergraduate colleges: 1,354
Here:
70.1%
Ohio:
22.3%
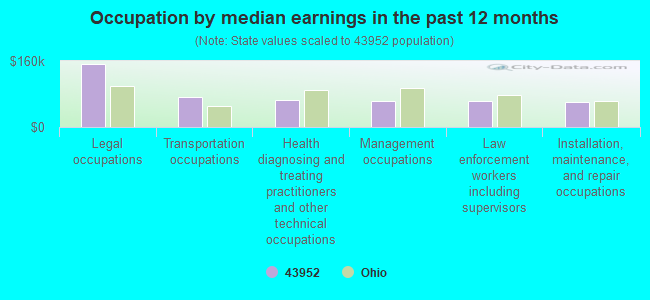
Occupation by median earnings in the past 12 months ($)
151,645Legal occupations
71,894Transportation occupations
64,804Health diagnosing and treating practitioners and other technical occupations
63,652Management occupations
61,824Law enforcement workers including supervisors
60,528Installation, maintenance, and repair occupations
Companies with federal contracts located in this zip code:
BARIUM & CHEMICALS, INC (515 KINGSDALE ROAD in STEUBENVILLE, OH; small business)
$37,950 with Defense Logistics Agency for Chemicals. Signed on 2004-01-06. Completion date: 2004-02-20.
WORLD INTERNATIONAL TESTING (2229 SUNSET BLVD in STEUBENVILLE, OH) : $33,700 in 2 contractsin 2005
$16,850 with U.S. Army Corps of Engineers - civil program financing only for Inspection Services (including commercial testing and lab services, except medical/dental) -- Pipe, Tubing, Hose, and Fittings. Signed on 2005-06-15. Completion date: 2005-06-27.
$16,850 with Army for Inspection Services (including commercial testing and lab services, except medical/dental) -- Pipe, Tubing, Hose, and Fittings. Signed on 2005-06-15. Completion date: 2005-06-27.
CLYKEL INC (1534 SUNSET BLVD in STEUBENVILLE, OH; small business) : $4,390 in 2 contractsin 2003
$3,594 with Army for Lease or Rental of Equipment -- Ground Effect Vehicles, Motor Vehicles, Trailers, and Cycles. Signed on 2003-12-02. Completion date: 2003-12-08.
$796, same as above.Signed on 2003-12-23. Completion date: 2003-12-08.
Top industries in this zip code by the number of employees in 2005:
Health Care and Social Assistance: General Medical and Surgical Hospitals (over 1000 employees: 1 establishment, 250-499 employees: 1 establishment)
Educational Services: Colleges, Universities, and Professional Schools (over 1000: 1)
Administrative and Support and Waste Management and Remediation Services: Telemarketing Bureaus (over 1000: 1)
2002 - 2018 National Fire Incident Reporting System (NFIRS) incidents
According to the data from the years 2002 - 2018 the average number of fires per year is 131. The highest number of fire incidents - 187 took place in 2010, and the least - 92 in 2011. The data has a declining trend.
When looking into fire subcategories, the most reports belonged to: Structure Fires (51.4%), and Outside Fires (28.6%).
Fire incident types reported to NFIRS in Zip Code 43952


 Nearest zip codes: 43953, 43964, 43938, 26062, 26037, 43944.


 According to the data from the years 2002 - 2018 the average number of fires per year is 131. The highest number of fire incidents - 187 took place in 2010, and the least - 92 in 2011. The data has a declining trend.
 When looking into fire subcategories, the most reports belonged to: Structure Fires (51.4%), and Outside Fires (28.6%).