Estimated zip code population in 2022: 23,354 Zip code population in 2010: 22,472 Zip code population in 2000: 22,233
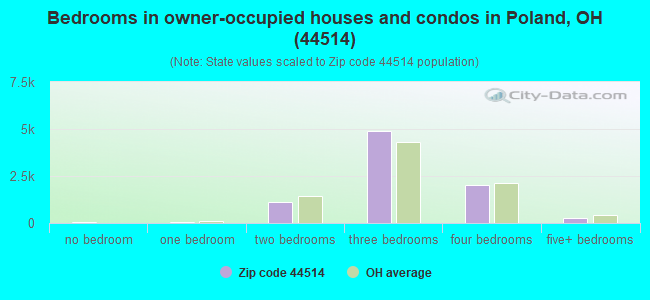
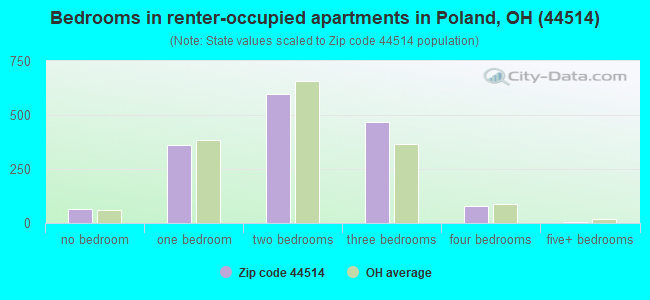
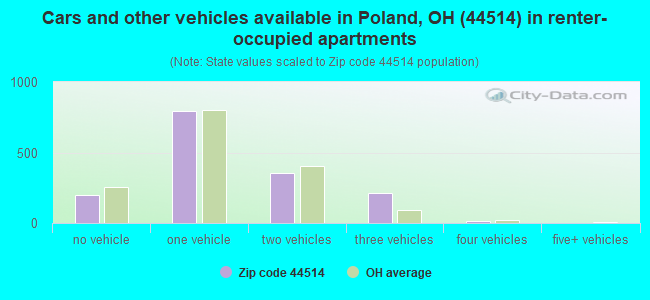
Houses and condos: 10,399 Renter-occupied apartments: 1,576
% of renters here:
16%
State:
33%
March 2022 cost of living index in zip code 44514: 89.8 (less than average, U.S. average is 100)
Land area: 21.6 sq. mi. Water area: 1.3 sq. mi.
Population density: 1,083 people per square mile
(low).
OSM Map
General Map
Google Map
MSN Map
OSM Map
General Map
Google Map
MSN Map
OSM Map
General Map
Google Map
MSN Map
OSM Map
General Map
Google Map
MSN Map
Please wait while loading the map...
Real estate property taxes paid for housing units in 2022:
This zip code:
1.4% ($2,765)
Ohio:
1.3% ($2,639)
Median real estate property taxes paid for housing units with mortgages in 2022: $2,864 (1.4%) Median real estate property taxes paid for housing units with no mortgage in 2022: $2,628 (1.4%)
Business Search- 14 Million verified businesses
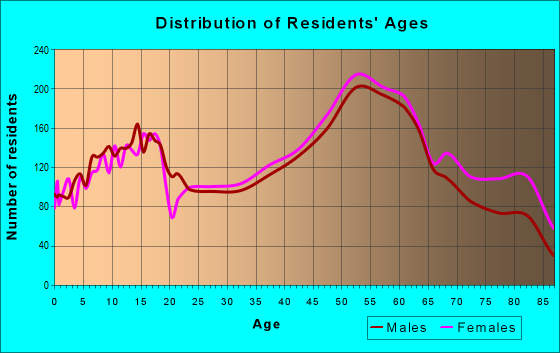
Males: 11,316
(48.5%)
Females: 12,037
(51.5%)
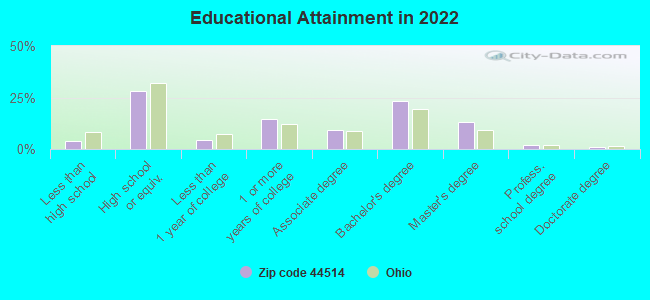
For population 25 years and over in 44514:
High school or higher: 96.6%
Bachelor's degree or higher: 40.1%
Graduate or professional degree: 16.6%
Unemployed: 2.5%
Mean travel time to work (commute): 20.8 minutes
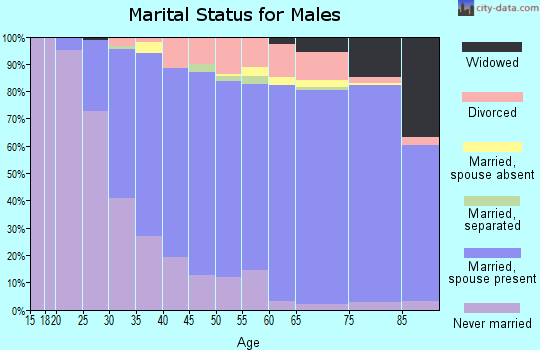
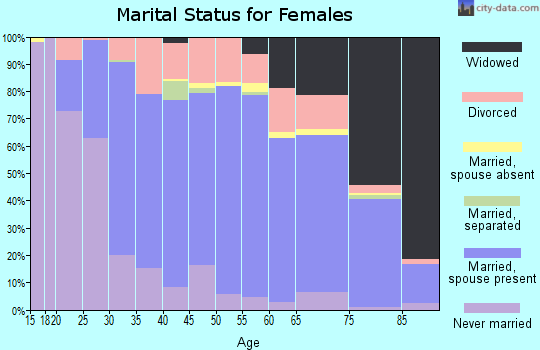
For population 15 years and over in 44514:
Never married: 24.4%
Now married: 56.1%
Separated: 0.4%
Widowed: 9.1%
Divorced: 10.1%
Zip code 44514 compared to state average:
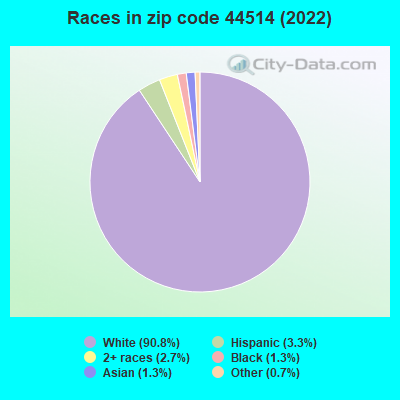
Black race population percentage significantly below state average.
Median age above state average.
Foreign-born population percentage below state average.
Renting percentage below state average.
Length of stay since moving in significantly above state average.
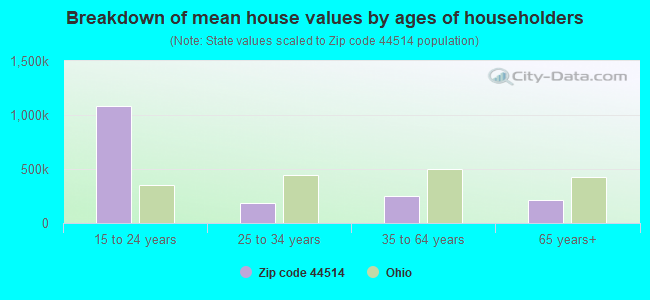
Estimated median house/condo value in 2022: $201,539
44514:
$201,539
Ohio:
$204,100
According to our research of Ohio and other state lists, there were 20 registered sex offenders living in 44514 zip code as of April 27, 2024. The ratio of all residents to sex offenders in zip code 44514 is 1,118 to 1. The ratio of registered sex offenders to all residents in this zip code is lower than the state average.
Median resident age:
This zip code:
44.8 years
Ohio median age:
39.9 years
Average household size:
This zip code:
2.3 people
Ohio:
2.4 people
Averages for the 2020 tax year for zip code 44514, filed in 2021:
Average Adjusted Gross Income (AGI) in 2020: $79,946 (Individual Income Tax Returns)
Here:
$79,946
State:
$67,288
Salary/wage: $62,703 (reported on 76.0% of returns)
Here:
$62,703
State:
$55,628
(% of AGI for various income ranges: 1003.0% for AGIs below $25k, 3187.7% for AGIs $25k-50k, 5978.1% for AGIs $50k-75k, 8674.8% for AGIs $75k-100k, 15980.8% for AGIs $100k-200k, 88795.8% for AGIs over 200k)
Taxable interest for individuals: $1,930 (reported on 36.3% of returns)
This zip code:
$1,930
Ohio:
$1,518
(% of AGI for various income ranges: 23.3% for AGIs below $25k, 41.7% for AGIs $25k-50k, 62.4% for AGIs $50k-75k, 102.2% for AGIs $75k-100k, 209.2% for AGIs $100k-200k, 1688.9% for AGIs over 200k)
Ordinary dividends: $6,212 (reported on 30.3% of returns)
Here:
$6,212
State:
$7,167
(% of AGI for various income ranges: 42.5% for AGIs below $25k, 64.4% for AGIs $25k-50k, 133.1% for AGIs $50k-75k, 205.0% for AGIs $75k-100k, 510.8% for AGIs $100k-200k, 6163.2% for AGIs over 200k)
Net capital gain/loss in AGI: +$12,948 (reported on 25.9% of returns)
Here:
+$12,948
State:
+$18,919
(% of AGI for various income ranges: 18.6% for AGIs below $25k, 45.4% for AGIs $25k-50k, 118.4% for AGIs $50k-75k, 285.6% for AGIs $75k-100k, 654.7% for AGIs $100k-200k, 15127.4% for AGIs over 200k)
Profit/loss from business: +$15,768 (reported on 14.3% of returns)
Here:
+$15,768
State:
+$13,744
(% of AGI for various income ranges: 91.2% for AGIs below $25k, 112.4% for AGIs $25k-50k, 155.4% for AGIs $50k-75k, 336.4% for AGIs $75k-100k, 663.3% for AGIs $100k-200k, 5833.7% for AGIs over 200k)
Taxable individual retirement arrangement distribution: $17,325 (reported on 15.0% of returns)
44514:
$17,325
Ohio:
$18,876
(% of AGI for various income ranges: 93.6% for AGIs below $25k, 183.7% for AGIs $25k-50k, 313.2% for AGIs $50k-75k, 551.0% for AGIs $75k-100k, 1008.4% for AGIs $100k-200k, 3283.2% for AGIs over 200k)
Self-employed (Keogh) retirement plans: $25,467 (reported on 0.7% of returns)
44514:
$25,467
Ohio:
$24,898
(% of AGI for various income ranges: 53.5% for AGIs $100k-200k, 913.7% for AGIs over 200k)
Total itemized deductions: $35,170 (reported on 5.7% of returns)
Here:
$35,170
State:
$33,869
(% of AGI for various income ranges: 43.2% for AGIs below $25k, 70.6% for AGIs $25k-50k, 165.4% for AGIs $50k-75k, 281.6% for AGIs $75k-100k, 546.2% for AGIs $100k-200k, 6036.3% for AGIs over 200k)
Charity contributions: $12,893 (reported on 4.6% of returns)
Here:
$12,893
State:
$14,577
(% of AGI for various income ranges: 3.0% for AGIs below $25k, 6.7% for AGIs $25k-50k, 20.6% for AGIs $50k-75k, 63.6% for AGIs $75k-100k, 145.2% for AGIs $100k-200k, 2471.6% for AGIs over 200k)
Taxes paid: $7,501 (reported on 5.5% of returns)
44514:
$7,501
State:
$7,681
(% of AGI for various income ranges: 5.7% for AGIs below $25k, 9.8% for AGIs $25k-50k, 34.1% for AGIs $50k-75k, 69.4% for AGIs $75k-100k, 141.5% for AGIs $100k-200k, 1144.2% for AGIs over 200k)
Earned income credit: $1,931 (reported on 9.2% of returns)
Here:
$1,931
State:
$2,304
(% of AGI for various income ranges: 54.4% for AGIs below $25k, 39.9% for AGIs $25k-50k, 0.8% for AGIs $50k-75k)
Percentage of individuals using paid preparers for their 2020 taxes: 93.7%
Here:
94%
State:
94%
(% for various income ranges: 92.9% for AGIs below $25k, 94.4% for AGIs $25k-50k, 93.7% for AGIs $50k-75k, 93.5% for AGIs $75k-100k, 93.4% for AGIs $100k-200k, 95.5% for AGIs over 200k)
Averages for the 2012 tax year for zip code 44514, filed in 2013:
Average Adjusted Gross Income (AGI) in 2012: $64,976 (Individual Income Tax Returns)
Here:
$64,976
State:
$54,926
Salary/wage: $52,251 (reported on 79.9% of returns)
Here:
$52,251
State:
$45,869
(% of AGI for various income ranges: 65.1% for AGIs below $25k, 68.8% for AGIs $25k-50k, 70.6% for AGIs $50k-75k, 69.6% for AGIs $75k-100k, 72.6% for AGIs $100k-200k, 49.5% for AGIs over 200k)
Taxable interest for individuals: $1,547 (reported on 44.5% of returns)
This zip code:
$1,547
Ohio:
$1,297
(% of AGI for various income ranges: 2.0% for AGIs below $25k, 1.0% for AGIs $25k-50k, 0.9% for AGIs $50k-75k, 0.9% for AGIs $75k-100k, 1.0% for AGIs $100k-200k, 1.1% for AGIs over 200k)
Ordinary dividends: $5,385 (reported on 31.7% of returns)
Here:
$5,385
State:
$5,821
(% of AGI for various income ranges: 3.0% for AGIs below $25k, 1.5% for AGIs $25k-50k, 1.7% for AGIs $50k-75k, 2.0% for AGIs $75k-100k, 2.2% for AGIs $100k-200k, 4.2% for AGIs over 200k)
Net capital gain/loss in AGI: +$5,037 (reported on 22.4% of returns)
Here:
+$5,037
State:
+$11,232
(% of AGI for various income ranges: 0.3% for AGIs $50k-75k, 0.5% for AGIs $75k-100k, 1.2% for AGIs $100k-200k, 4.7% for AGIs over 200k)
Profit/loss from business: +$20,870 (reported on 13.8% of returns)
Here:
+$20,870
State:
+$12,773
(% of AGI for various income ranges: 5.3% for AGIs below $25k, 3.1% for AGIs $25k-50k, 2.4% for AGIs $50k-75k, 2.2% for AGIs $75k-100k, 3.7% for AGIs $100k-200k, 7.4% for AGIs over 200k)
Taxable individual retirement arrangement distribution: $13,352 (reported on 15.4% of returns)
44514:
$13,352
Ohio:
$14,511
(% of AGI for various income ranges: 4.9% for AGIs below $25k, 3.8% for AGIs $25k-50k, 3.4% for AGIs $50k-75k, 3.7% for AGIs $75k-100k, 3.3% for AGIs $100k-200k, 2.0% for AGIs over 200k)
Self-employment retirement plans: $24,283 (reported on 1.0% of returns)
44514:
$24,283
Ohio:
$20,257
(% of AGI for various income ranges: 0.3% for AGIs $50k-75k, 0.3% for AGIs $100k-200k, 0.9% for AGIs over 200k)
Total itemized deductions: $22,075 (17% of AGI, reported on 31.5% of returns)
Here:
$22,075
State:
$21,278
Here:
16.9% of AGI
State:
18.8% of AGI
(% of AGI for various income ranges: 8.3% for AGIs below $25k, 8.0% for AGIs $25k-50k, 10.0% for AGIs $50k-75k, 10.3% for AGIs $75k-100k, 12.5% for AGIs $100k-200k, 11.5% for AGIs over 200k)
Charity contributions: $3,863 (reported on 26.3% of returns)
Here:
$3,863
State:
$3,943
(% of AGI for various income ranges: 0.7% for AGIs below $25k, 0.8% for AGIs $25k-50k, 1.1% for AGIs $50k-75k, 1.3% for AGIs $75k-100k, 1.8% for AGIs $100k-200k, 2.2% for AGIs over 200k)
Taxes paid: $9,883 (reported on 31.4% of returns)
44514:
$9,883
State:
$9,568
(% of AGI for various income ranges: 1.3% for AGIs below $25k, 2.2% for AGIs $25k-50k, 3.4% for AGIs $50k-75k, 3.8% for AGIs $75k-100k, 5.7% for AGIs $100k-200k, 7.1% for AGIs over 200k)
Earned income credit: $1,820 (reported on 10.1% of returns)
Here:
$1,820
State:
$2,285
(% of AGI for various income ranges: 3.3% for AGIs below $25k, 0.5% for AGIs $25k-50k)
Percentage of individuals using paid preparers for their 2012 taxes: 60.1%
Here:
60%
State:
51%
(% for various income ranges: 53.3% for AGIs below $25k, 60.5% for AGIs $25k-50k, 63.5% for AGIs $50k-75k, 63.9% for AGIs $75k-100k, 65.0% for AGIs $100k-200k, 83.0% for AGIs over 200k)
Averages for the 2004 tax year for zip code 44514, filed in 2005:
Average Adjusted Gross Income (AGI) in 2004: $51,457 (Individual Income Tax Returns)
Here:
$51,457
State:
$44,480
Salary/wage: $45,350 (reported on 80.2% of returns)
Here:
$45,350
State:
$39,198
(% of AGI for various income ranges: 109.0% for AGIs below $10k, 60.5% for AGIs $10k-25k, 75.2% for AGIs $25k-50k, 78.8% for AGIs $50k-75k, 78.4% for AGIs $75k-100k, 62.9% for AGIs over 100k)
Taxable interest for individuals: $1,689 (reported on 63.7% of returns)
This zip code:
$1,689
Ohio:
$1,532
(% of AGI for various income ranges: 11.2% for AGIs below $10k, 5.0% for AGIs $10k-25k, 2.0% for AGIs $25k-50k, 1.8% for AGIs $50k-75k, 2.0% for AGIs $75k-100k, 1.5% for AGIs over 100k)
Taxable dividends: $2,979 (reported on 41.2% of returns)
Here:
$2,979
State:
$3,496
(% of AGI for various income ranges: 9.0% for AGIs below $10k, 2.9% for AGIs $10k-25k, 1.7% for AGIs $25k-50k, 1.5% for AGIs $50k-75k, 2.4% for AGIs $75k-100k, 2.8% for AGIs over 100k)
Net capital gain/loss: +$5,030 (reported on 29.8% of returns)
Here:
+$5,030
State:
+$8,582
(% of AGI for various income ranges: -5.2% for AGIs below $10k, 0.6% for AGIs $10k-25k, 0.7% for AGIs $25k-50k, 0.8% for AGIs $50k-75k, 1.8% for AGIs $75k-100k, 5.9% for AGIs over 100k)
Profit/loss from business: +$14,895 (reported on 14.0% of returns)
Here:
+$14,895
State:
+$10,813
(% of AGI for various income ranges: 3.1% for AGIs below $10k, 4.2% for AGIs $10k-25k, 2.6% for AGIs $25k-50k, 2.6% for AGIs $50k-75k, 2.3% for AGIs $75k-100k, 5.9% for AGIs over 100k)
IRA payment deduction: $2,910 (reported on 3.8% of returns)
44514:
$2,910
Ohio:
$2,794
(% of AGI for various income ranges: 0.5% for AGIs below $10k, 0.3% for AGIs $10k-25k, 0.4% for AGIs $25k-50k, 0.2% for AGIs $50k-75k, 0.2% for AGIs $75k-100k, 0.1% for AGIs over 100k)
Self-employed pension: $15,500 (reported on 1.1% of returns)
Here:
$15,500
Ohio:
$13,981
(% of AGI for various income ranges: 0.1% for AGIs $25k-50k, 0.1% for AGIs $50k-75k, 0.1% for AGIs $75k-100k, 0.7% for AGIs over 100k)
Total itemized deductions: $17,380 (18% of AGI, reported on 37.5% of returns)
Here:
$17,380
State:
$17,503
Here:
18.3% of AGI
State:
20.8% of AGI
(% of AGI for various income ranges: 12.9% for AGIs below $10k, 9.3% for AGIs $10k-25k, 10.9% for AGIs $25k-50k, 12.9% for AGIs $50k-75k, 15.2% for AGIs $75k-100k, 13.0% for AGIs over 100k)
Charity contributions deductions: $2,903 (3% of AGI, reported on 33.6% of returns)
Here:
$2,903
State:
$3,087
Here:
2.9% of AGI
State:
3.4% of AGI
(% of AGI for various income ranges: 0.7% for AGIs below $10k, 1.1% for AGIs $10k-25k, 1.4% for AGIs $25k-50k, 1.6% for AGIs $50k-75k, 2.0% for AGIs $75k-100k, 2.4% for AGIs over 100k)
Total tax: $8,540 (reported on 80.2% of returns)
44514:
$8,540
State:
$6,781
(% of AGI for various income ranges: 3.4% for AGIs below $10k, 4.5% for AGIs $10k-25k, 7.6% for AGIs $25k-50k, 9.4% for AGIs $50k-75k, 10.7% for AGIs $75k-100k, 20.3% for AGIs over 100k)
Earned income credit: $1,370 (reported on 6.9% of returns)
Here:
$1,370
State:
$1,696
Percentage of individuals using paid preparers for their 2004 taxes: 58.8%
Here:
59%
State:
55%
(% for various income ranges: 51.4% for AGIs below $10k, 57.8% for AGIs $10k-25k, 60.3% for AGIs $25k-50k, 60.6% for AGIs $50k-75k, 58.0% for AGIs $75k-100k, 69.5% for AGIs over 100k)
Likely homosexual households (counted as self-reported same-sex unmarried-partner households)
Lesbian couples: 0.2% of all households
Gay men: 0.0% of all households
Household received Food Stamps/SNAP in the past 12 months: 643 Household did not receive Food Stamps/SNAP in the past 12 months: 9,303
Women who had a birth in the past 12 months: 372 (273 now married, 100 unmarried) Women who did not have a birth in the past 12 months: 4,179 (1,864 now married, 2,315 unmarried)
Housing units in zip code 44514 with a mortgage: 4,732 (614 second mortgage, 558 both second mortgage and home equity loan) Houses without a mortgage: 296
Median monthly owner costs for units with a mortgage: $1,260 Median monthly owner costs for units without a mortgage: $564
Residents with income below the poverty level in 2022:
This zip code:
6.2%
Whole state:
13.4%
Residents with income below 50% of the poverty level in 2022:
This zip code:
3.1%
Whole state:
7.0%
Median number of rooms in houses and condos:
Here:
6.7
State:
6.7
Median number of rooms in apartments:
Here:
4.8
State:
4.4
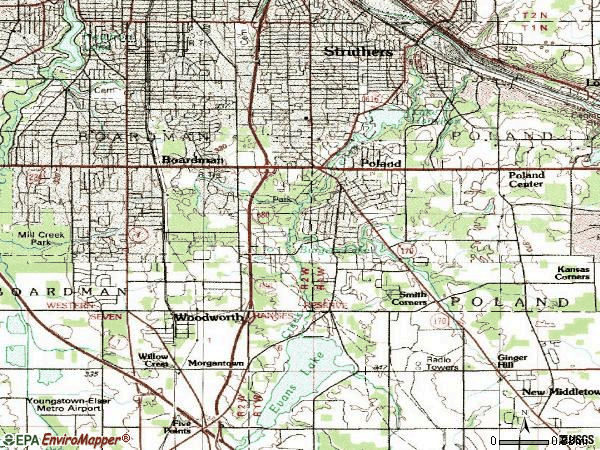
Notable locations in this zip code not listed on our city pages
Notable locations in zip code 44514: Pioneer Trails Tree Farm (A), Western Reserve Joint Fire District Station 91 (B), Western Reserve Joint Fire District Station 92 (C), Poland Branch Library (D). Display/hide their locations on the map
Shopping Centers: Poland West Plaza Shopping Center (1), Withers Plaza Shopping Center (2), Stewart Hill Plaza Shopping Center (3). Display/hide their locations on the map
Churches in zip code 44514 include: Fairview Immanuel Baptist Church (A), Brownlee Woods Presbyterian Church (B), Bethlehem United Church of Christ (C), Poland Village Baptist Church (D), Memorial Baptist Church (E), Gospel Baptist Independent Church (F), Chapel of the Evangelical Free Church (G), Saint Paul United Church of Christ (H), Bethel Evangelical Friends Church (I). Display/hide their locations on the map
Parks in zip code 44514 include: South Main Street Historic District (1), Poland Village Park (2), Poland Polo Field (3). Display/hide their locations on the map
In group quarters: 215 (-1 institutionalized population)
Size of family households: 3,199 2-persons, 1,256 3-persons, 1,530 4-persons, 405 5-persons, 93 6-persons, 113 7-or-more-persons
Size of nonfamily households: 2,924 1-person, 378 2-persons, 29 3-persons
3,711 married couples with children.
1,180 single-parent households (247 men, 933 women).
94.8% of residents of 44514 zip code speak English at home.
1.7% of residents speak Spanish at home (90% very well, 10% well).
3.1% of residents speak other Indo-European language at home (73% very well, 6% well, 21% not well).
0.2% of residents speak Asian or Pacific Island language at home (31% very well, 51% well, 18% not well).
0.4% of residents speak other language at home (89% very well, 11% well).
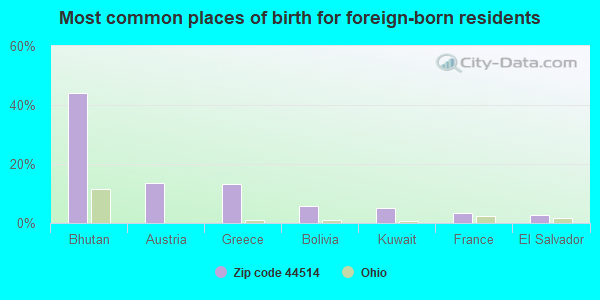
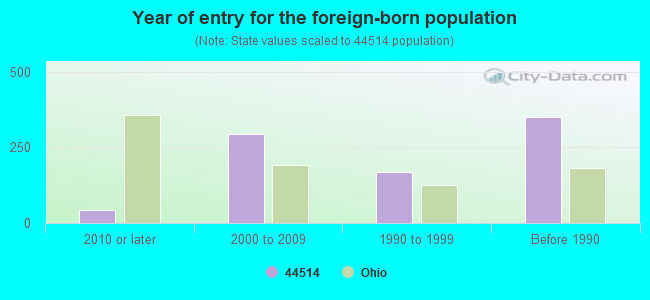
Foreign born population: 626 (2.7%) (95.5% of them are naturalized citizens)
Facilities with environmental interests located in this zip code:
ASPEN DENTAL (1320 BOARDMAN POLAND RD-STE C in POLAND, OH)
Conditionally Exempt Small Quantity Generators, less than 100 kg/month of hazardous waste (Resource Conservation and Recovery Act (tracking hazardous waste)) Organizations: RUBINS NOEL (CONTACT/OPERATOR)
BLOOMINGDALE'S POINT (10897 SPRINGFIELD RD in POLAND, OH)
National Pollutant Discharge Elimination System NON-MAJOR (Tracking pollutant discharge elimination systems) - permit Business SIC classification: EATING PLACES
BMC LOGISTICS INC (590 EAST WESTERN RESERVE RD in YOUNGSTOWN, OH)
Small Quantity Generators, between 100 kg and 1000 kg of hazardous waste/month (Resource Conservation and Recovery Act (tracking hazardous waste)) - notification Organizations: LEE STONEBURNER (CONTACT/OWNER)
Housing units lacking complete plumbing facilities: 0.7% Housing units lacking complete kitchen facilities: 1.8%
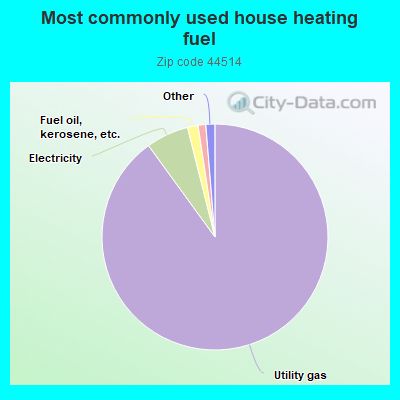
90.0%Utility gas
6.1%Electricity
1.5%Fuel oil, kerosene, etc.
1.1%Bottled, tank, or LP gas
0.7%Other fuel
0.6%Wood
Population in 1990: 21,694. Population change in the 1990s: +539 (+2.5%).
Place of birth for U.S.-born residents:
This state: 18,153
Northeast: 2,443
Midwest: 411
South: 896
West: 567
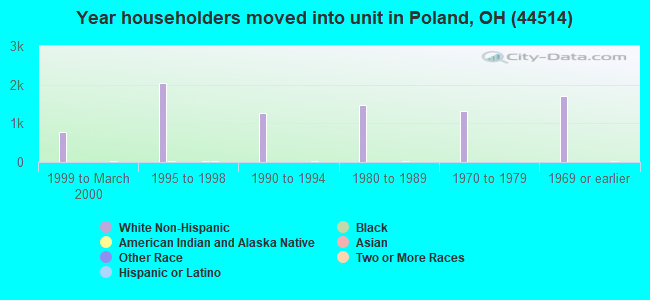
70% of the 44514 zip code residents lived in the same house 5 years ago. Out of people who lived in different houses, 78% lived in this county. Out of people who lived in different counties, 50% lived in Ohio.
94% of the 44514 zip code residents lived in the same house 1 year ago. Out of people who lived in different houses, 45% moved from this county. Out of people who lived in different houses, 25% moved from different county within same state. Out of people who lived in different houses, 28% moved from different state. Out of people who lived in different houses, 9% moved from abroad.
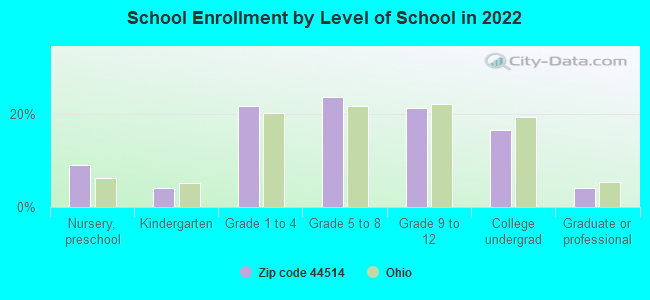
Private vs. public school enrollment:
Students in private schools in grades 1 to 8 (elementary and middle school): 226
Here:
10.0%
Ohio:
16.0%
Students in private schools in grades 9 to 12 (high school): 109
Here:
10.3%
Ohio:
13.1%
Students in private undergraduate colleges: 147
Here:
17.6%
Ohio:
22.3%
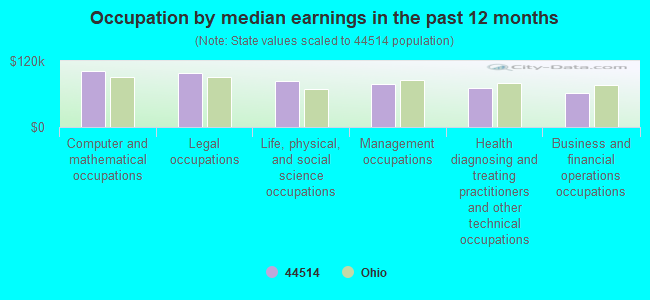
Occupation by median earnings in the past 12 months ($)
101,484Computer and mathematical occupations
97,830Legal occupations
83,697Life, physical, and social science occupations
78,028Management occupations
70,356Health diagnosing and treating practitioners and other technical occupations
62,581Business and financial operations occupations
Companies with federal contracts located in this zip code:
AMBRICK INC (217 EVERGREEN DRIVE in POLAND, OH; small business) : $1,950,125 in 2 contractsfrom 2000 to 2001
$1,948,400 with Army for Construction of Structures and Facilities -- Highways, Roads, Streets, Bridges, and Railways (includes resurfacing). Signed on 2000-09-26. Completion date: 2001-09-26.
$1,725, same as above.Signed on 2001-12-12. Completion date: 2001-09-09.
ACME COMPANY, THE (9495 HARVARD BLVD in YOUNGSTOWN, OH)
$152,587 with Army for Soil Preparation Equipment. Signed on 2003-07-10. Completion date: 2003-08-05.
GORDON FOOD SERVICE, INC (333 SWALLOW HOLW in POLAND, OH; small business) : $65,000 in 4 contractsin 2000
$28,000 with Bureau of Prisoners/Federal Prison System for Condiments and Related Products. Signed on 2000-10-15. Completion date: 2001-09-15.
$27,000 with Bureau of Prisoners/Federal Prison System for Bakery and Cereal Products. Signed on 2000-04-15. Completion date: 2000-06-15.
$7,000, same as above.Signed on 2000-06-15. Completion date: 2000-06-15.
$3,000, same as above.Signed on 2000-08-15. Completion date: 2000-08-15.
CROGAN PLUMBING & HEATING SUPP (5821 POLAND-STRUTHERS RD in YOUNGSTOWN, OH; small business) : $10,300 in 2 contractsin 2004
$10,000 with Navy for Maintenance, Repair and Rebuilding of Equipment -- Fire Fighting, Rescue, and Safety Equipment; and Environmental Protection Equipment and Materials. Taking place in WA. Signed on 2004-10-27. Completion date: 2005-09-30.
$300, same as above.Signed on 2004-10-27. Completion date: 2005-09-30.
GREAT LAKES TELCOM, LTD (590 EAST WRESERVE RD 9C in YOUNGSTOWN, OH)
$8,890 with Army for ADP Input/Output and Storage Devices. Signed on 2002-09-13. Completion date: 2002-09-30.
Top industries in this zip code by the number of employees in 2005:
2002 - 2018 National Fire Incident Reporting System (NFIRS) incidents
According to the data from the years 2002 - 2018 the average number of fires per year is 39. The highest number of reported fires - 61 took place in 2014, and the least - 21 in 2004. The data has a dropping trend.
When looking into fire subcategories, the most reports belonged to: Structure Fires (44.9%), and Outside Fires (37.9%).
Fire incident types reported to NFIRS in Zip Code 44514


 Nearest zip codes: 44471, 44512, 44443, 44442, 44452, 44405.


 According to the data from the years 2002 - 2018 the average number of fires per year is 39. The highest number of reported fires - 61 took place in 2014, and the least - 21 in 2004. The data has a dropping trend.
 When looking into fire subcategories, the most reports belonged to: Structure Fires (44.9%), and Outside Fires (37.9%).