Estimated zip code population in 2022: 28,656 Zip code population in 2010: 28,565 Zip code population in 2000: 26,446
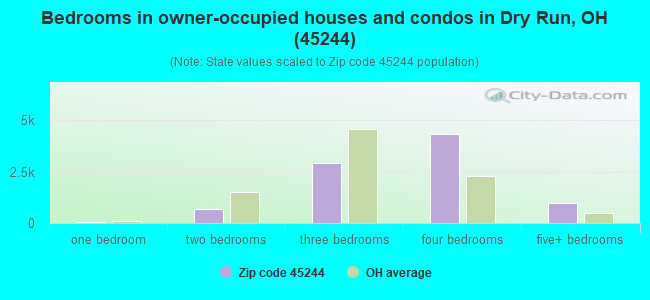
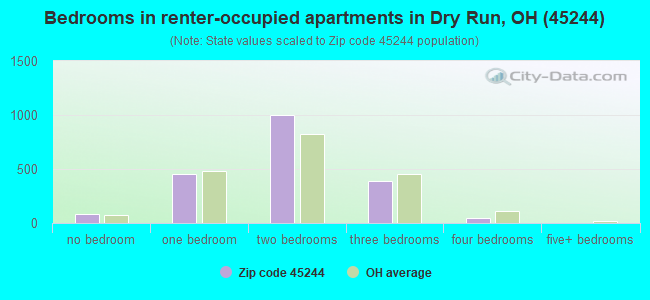
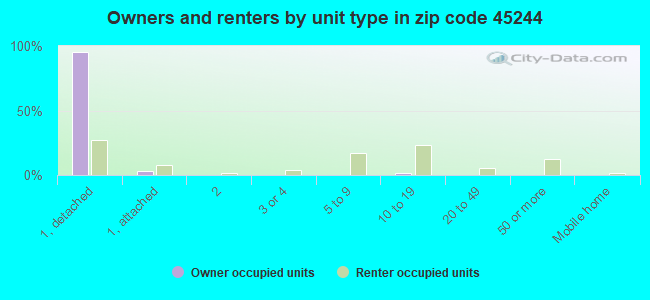
Houses and condos: 11,229 Renter-occupied apartments: 1,961
% of renters here:
18%
State:
33%
March 2022 cost of living index in zip code 45244: 88.7 (less than average, U.S. average is 100)
Land area: 22.0 sq. mi. Water area: 0.6 sq. mi.
Population density: 1,302 people per square mile
(low).
OSM Map
General Map
Google Map
MSN Map
OSM Map
General Map
Google Map
MSN Map
OSM Map
General Map
Google Map
MSN Map
OSM Map
General Map
Google Map
MSN Map
Please wait while loading the map...
Real estate property taxes paid for housing units in 2022:
This zip code:
1.5% ($5,635)
Ohio:
1.3% ($2,639)
Median real estate property taxes paid for housing units with mortgages in 2022: $5,911 (1.5%) Median real estate property taxes paid for housing units with no mortgage in 2022: $4,915 (1.6%)
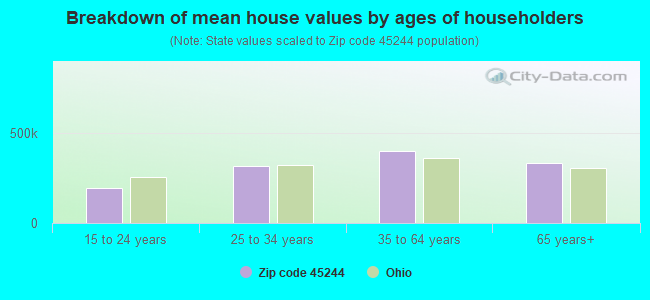
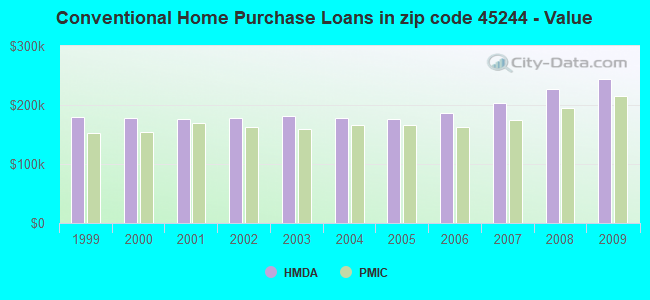
Estimated median house/condo value in 2022: $363,995
45244:
$363,995
Ohio:
$204,100
According to our research of Ohio and other state lists, there were 18 registered sex offenders living in 45244 zip code as of April 27, 2024. The ratio of all residents to sex offenders in zip code 45244 is 1,634 to 1. The ratio of registered sex offenders to all residents in this zip code is much lower than the state average.
Median resident age:
This zip code:
40.0 years
Ohio median age:
39.9 years
Average household size:
This zip code:
2.6 people
Ohio:
2.4 people
Averages for the 2020 tax year for zip code 45244, filed in 2021:
Average Adjusted Gross Income (AGI) in 2020: $114,147 (Individual Income Tax Returns)
Here:
$114,147
State:
$67,288
Salary/wage: $95,450 (reported on 83.1% of returns)
Here:
$95,450
State:
$55,628
(% of AGI for various income ranges: 1111.0% for AGIs below $25k, 3707.5% for AGIs $25k-50k, 6281.8% for AGIs $50k-75k, 9440.8% for AGIs $75k-100k, 18953.5% for AGIs $100k-200k, 93455.2% for AGIs over 200k)
Taxable interest for individuals: $1,730 (reported on 35.9% of returns)
This zip code:
$1,730
Ohio:
$1,518
(% of AGI for various income ranges: 13.2% for AGIs below $25k, 23.4% for AGIs $25k-50k, 40.5% for AGIs $50k-75k, 56.5% for AGIs $75k-100k, 117.1% for AGIs $100k-200k, 855.3% for AGIs over 200k)
Ordinary dividends: $9,049 (reported on 34.7% of returns)
Here:
$9,049
State:
$7,167
(% of AGI for various income ranges: 47.8% for AGIs below $25k, 77.3% for AGIs $25k-50k, 165.9% for AGIs $50k-75k, 394.9% for AGIs $75k-100k, 733.7% for AGIs $100k-200k, 4117.2% for AGIs over 200k)
Net capital gain/loss in AGI: +$21,800 (reported on 28.9% of returns)
Here:
+$21,800
State:
+$18,919
(% of AGI for various income ranges: 23.8% for AGIs below $25k, 48.5% for AGIs $25k-50k, 103.3% for AGIs $50k-75k, 241.8% for AGIs $75k-100k, 732.4% for AGIs $100k-200k, 12098.2% for AGIs over 200k)
Profit/loss from business: +$26,568 (reported on 15.9% of returns)
Here:
+$26,568
State:
+$13,744
(% of AGI for various income ranges: 134.9% for AGIs below $25k, 158.7% for AGIs $25k-50k, 243.1% for AGIs $50k-75k, 479.3% for AGIs $75k-100k, 942.9% for AGIs $100k-200k, 5233.5% for AGIs over 200k)
Taxable individual retirement arrangement distribution: $25,276 (reported on 12.0% of returns)
45244:
$25,276
Ohio:
$18,876
(% of AGI for various income ranges: 65.8% for AGIs below $25k, 142.7% for AGIs $25k-50k, 207.7% for AGIs $50k-75k, 485.3% for AGIs $75k-100k, 1124.9% for AGIs $100k-200k, 2366.8% for AGIs over 200k)
Self-employed (Keogh) retirement plans: $30,709 (reported on 1.6% of returns)
45244:
$30,709
Ohio:
$24,898
(% of AGI for various income ranges: 21.0% for AGIs $50k-75k, 56.5% for AGIs $100k-200k, 983.2% for AGIs over 200k)
Total itemized deductions: $37,147 (reported on 10.5% of returns)
Here:
$37,147
State:
$33,869
(% of AGI for various income ranges: 58.9% for AGIs below $25k, 123.3% for AGIs $25k-50k, 201.7% for AGIs $50k-75k, 396.0% for AGIs $75k-100k, 768.9% for AGIs $100k-200k, 5522.2% for AGIs over 200k)
Charity contributions: $16,176 (reported on 9.0% of returns)
Here:
$16,176
State:
$14,577
(% of AGI for various income ranges: 3.4% for AGIs below $25k, 13.2% for AGIs $25k-50k, 25.9% for AGIs $50k-75k, 70.0% for AGIs $75k-100k, 184.4% for AGIs $100k-200k, 2732.8% for AGIs over 200k)
Taxes paid: $8,633 (reported on 10.4% of returns)
45244:
$8,633
State:
$7,681
(% of AGI for various income ranges: 7.6% for AGIs below $25k, 24.6% for AGIs $25k-50k, 50.4% for AGIs $50k-75k, 113.5% for AGIs $75k-100k, 225.3% for AGIs $100k-200k, 1148.3% for AGIs over 200k)
Earned income credit: $1,971 (reported on 7.9% of returns)
Here:
$1,971
State:
$2,304
(% of AGI for various income ranges: 57.9% for AGIs below $25k, 39.3% for AGIs $25k-50k, 0.9% for AGIs $50k-75k)
Percentage of individuals using paid preparers for their 2020 taxes: 92.9%
Here:
93%
State:
94%
(% for various income ranges: 91.4% for AGIs below $25k, 93.8% for AGIs $25k-50k, 94.5% for AGIs $50k-75k, 92.9% for AGIs $75k-100k, 93.0% for AGIs $100k-200k, 93.1% for AGIs over 200k)
Averages for the 2012 tax year for zip code 45244, filed in 2013:
Average Adjusted Gross Income (AGI) in 2012: $92,502 (Individual Income Tax Returns)
Here:
$92,502
State:
$54,926
Salary/wage: $77,314 (reported on 84.9% of returns)
Here:
$77,314
State:
$45,869
(% of AGI for various income ranges: 74.2% for AGIs below $25k, 76.9% for AGIs $25k-50k, 72.3% for AGIs $50k-75k, 73.3% for AGIs $75k-100k, 77.4% for AGIs $100k-200k, 65.0% for AGIs over 200k)
Taxable interest for individuals: $1,415 (reported on 40.7% of returns)
This zip code:
$1,415
Ohio:
$1,297
(% of AGI for various income ranges: 1.0% for AGIs below $25k, 0.5% for AGIs $25k-50k, 0.6% for AGIs $50k-75k, 0.5% for AGIs $75k-100k, 0.6% for AGIs $100k-200k, 0.7% for AGIs over 200k)
Ordinary dividends: $7,445 (reported on 36.5% of returns)
Here:
$7,445
State:
$5,821
(% of AGI for various income ranges: 2.9% for AGIs below $25k, 1.8% for AGIs $25k-50k, 2.4% for AGIs $50k-75k, 2.4% for AGIs $75k-100k, 2.5% for AGIs $100k-200k, 3.6% for AGIs over 200k)
Net capital gain/loss in AGI: +$16,412 (reported on 27.6% of returns)
Here:
+$16,412
State:
+$11,232
(% of AGI for various income ranges: 0.4% for AGIs below $25k, 0.6% for AGIs $25k-50k, 1.0% for AGIs $50k-75k, 0.9% for AGIs $75k-100k, 1.8% for AGIs $100k-200k, 9.5% for AGIs over 200k)
Profit/loss from business: +$21,124 (reported on 15.7% of returns)
Here:
+$21,124
State:
+$12,773
(% of AGI for various income ranges: 6.7% for AGIs below $25k, 3.1% for AGIs $25k-50k, 3.6% for AGIs $50k-75k, 3.4% for AGIs $75k-100k, 4.2% for AGIs $100k-200k, 3.1% for AGIs over 200k)
Taxable individual retirement arrangement distribution: $22,319 (reported on 13.1% of returns)
45244:
$22,319
Ohio:
$14,511
(% of AGI for various income ranges: 3.8% for AGIs below $25k, 3.5% for AGIs $25k-50k, 4.5% for AGIs $50k-75k, 4.3% for AGIs $75k-100k, 3.6% for AGIs $100k-200k, 2.3% for AGIs over 200k)
Self-employment retirement plans: $21,769 (reported on 1.9% of returns)
45244:
$21,769
Ohio:
$20,257
(% of AGI for various income ranges: 0.4% for AGIs $25k-50k, 0.2% for AGIs $75k-100k, 0.4% for AGIs $100k-200k, 0.6% for AGIs over 200k)
Total itemized deductions: $27,111 (16% of AGI, reported on 46.2% of returns)
Here:
$27,111
State:
$21,278
Here:
16.4% of AGI
State:
18.8% of AGI
(% of AGI for various income ranges: 9.0% for AGIs below $25k, 10.0% for AGIs $25k-50k, 14.0% for AGIs $50k-75k, 15.3% for AGIs $75k-100k, 16.0% for AGIs $100k-200k, 12.5% for AGIs over 200k)
Charity contributions: $4,329 (reported on 39.4% of returns)
Here:
$4,329
State:
$3,943
(% of AGI for various income ranges: 0.6% for AGIs below $25k, 1.0% for AGIs $25k-50k, 1.6% for AGIs $50k-75k, 1.7% for AGIs $75k-100k, 2.0% for AGIs $100k-200k, 2.0% for AGIs over 200k)
Taxes paid: $13,523 (reported on 46.2% of returns)
45244:
$13,523
State:
$9,568
(% of AGI for various income ranges: 2.1% for AGIs below $25k, 2.9% for AGIs $25k-50k, 4.9% for AGIs $50k-75k, 6.3% for AGIs $75k-100k, 7.8% for AGIs $100k-200k, 7.6% for AGIs over 200k)
Earned income credit: $2,076 (reported on 9.4% of returns)
Here:
$2,076
State:
$2,285
(% of AGI for various income ranges: 4.5% for AGIs below $25k, 0.6% for AGIs $25k-50k)
Percentage of individuals using paid preparers for their 2012 taxes: 47.9%
Here:
48%
State:
51%
(% for various income ranges: 40.7% for AGIs below $25k, 46.9% for AGIs $25k-50k, 49.1% for AGIs $50k-75k, 51.1% for AGIs $75k-100k, 49.6% for AGIs $100k-200k, 65.9% for AGIs over 200k)
Averages for the 2004 tax year for zip code 45244, filed in 2005:
Average Adjusted Gross Income (AGI) in 2004: $69,301 (Individual Income Tax Returns)
Here:
$69,301
State:
$44,480
Salary/wage: $61,815 (reported on 84.7% of returns)
Here:
$61,815
State:
$39,198
(% of AGI for various income ranges: 142.2% for AGIs below $10k, 72.1% for AGIs $10k-25k, 77.4% for AGIs $25k-50k, 77.1% for AGIs $50k-75k, 79.9% for AGIs $75k-100k, 73.4% for AGIs over 100k)
Taxable interest for individuals: $1,482 (reported on 53.2% of returns)
This zip code:
$1,482
Ohio:
$1,532
(% of AGI for various income ranges: 9.2% for AGIs below $10k, 2.5% for AGIs $10k-25k, 1.3% for AGIs $25k-50k, 1.1% for AGIs $50k-75k, 1.0% for AGIs $75k-100k, 1.0% for AGIs over 100k)
Taxable dividends: $4,133 (reported on 41.8% of returns)
Here:
$4,133
State:
$3,496
(% of AGI for various income ranges: 13.1% for AGIs below $10k, 2.5% for AGIs $10k-25k, 1.8% for AGIs $25k-50k, 1.8% for AGIs $50k-75k, 2.2% for AGIs $75k-100k, 2.7% for AGIs over 100k)
Net capital gain/loss: +$8,811 (reported on 32.9% of returns)
Here:
+$8,811
State:
+$8,582
(% of AGI for various income ranges: -0.8% for AGIs below $10k, 0.9% for AGIs $10k-25k, 0.7% for AGIs $25k-50k, 1.2% for AGIs $50k-75k, 1.6% for AGIs $75k-100k, 6.2% for AGIs over 100k)
Profit/loss from business: +$18,406 (reported on 15.5% of returns)
Here:
+$18,406
State:
+$10,813
(% of AGI for various income ranges: 10.8% for AGIs below $10k, 4.2% for AGIs $10k-25k, 3.2% for AGIs $25k-50k, 3.4% for AGIs $50k-75k, 4.0% for AGIs $75k-100k, 4.3% for AGIs over 100k)
IRA payment deduction: $3,224 (reported on 2.8% of returns)
45244:
$3,224
Ohio:
$2,794
(% of AGI for various income ranges: 0.2% for AGIs $10k-25k, 0.3% for AGIs $25k-50k, 0.2% for AGIs $50k-75k, 0.2% for AGIs $75k-100k, 0.1% for AGIs over 100k)
Self-employed pension: $15,973 (reported on 2.2% of returns)
Here:
$15,973
Ohio:
$13,981
(% of AGI for various income ranges: 0.2% for AGIs $25k-50k, 0.2% for AGIs $50k-75k, 0.3% for AGIs $75k-100k, 0.7% for AGIs over 100k)
Total itemized deductions: $22,237 (19% of AGI, reported on 49.7% of returns)
Here:
$22,237
State:
$17,503
Here:
19.0% of AGI
State:
20.8% of AGI
(% of AGI for various income ranges: 18.5% for AGIs below $10k, 11.5% for AGIs $10k-25k, 14.2% for AGIs $25k-50k, 17.4% for AGIs $50k-75k, 18.6% for AGIs $75k-100k, 15.7% for AGIs over 100k)
Charity contributions deductions: $3,496 (3% of AGI, reported on 44.7% of returns)
Here:
$3,496
State:
$3,087
Here:
2.8% of AGI
State:
3.4% of AGI
(% of AGI for various income ranges: 0.8% for AGIs below $10k, 1.0% for AGIs $10k-25k, 1.4% for AGIs $25k-50k, 2.0% for AGIs $50k-75k, 2.3% for AGIs $75k-100k, 2.6% for AGIs over 100k)
Total tax: $12,771 (reported on 80.6% of returns)
45244:
$12,771
State:
$6,781
(% of AGI for various income ranges: 4.3% for AGIs below $10k, 4.5% for AGIs $10k-25k, 7.4% for AGIs $25k-50k, 9.0% for AGIs $50k-75k, 10.2% for AGIs $75k-100k, 19.2% for AGIs over 100k)
Earned income credit: $1,575 (reported on 7.3% of returns)
Here:
$1,575
State:
$1,696
Percentage of individuals using paid preparers for their 2004 taxes: 48.6%
Here:
49%
State:
55%
(% for various income ranges: 39.6% for AGIs below $10k, 49.2% for AGIs $10k-25k, 51.3% for AGIs $25k-50k, 49.5% for AGIs $50k-75k, 48.6% for AGIs $75k-100k, 53.6% for AGIs over 100k)
Likely homosexual households (counted as self-reported same-sex unmarried-partner households)
Lesbian couples: 0.0% of all households
Gay men: 0.2% of all households
Household received Food Stamps/SNAP in the past 12 months: 543 Household did not receive Food Stamps/SNAP in the past 12 months: 10,277
Women who had a birth in the past 12 months: 288 (275 now married, 18 unmarried) Women who did not have a birth in the past 12 months: 5,676 (3,014 now married, 2,660 unmarried)
Housing units in zip code 45244 with a mortgage: 6,041 (994 second mortgage, 26 home equity loan, 886 both second mortgage and home equity loan) Houses without a mortgage: 262
Median monthly owner costs for units with a mortgage: $2,002 Median monthly owner costs for units without a mortgage: $772
Residents with income below the poverty level in 2022:
This zip code:
6.9%
Whole state:
13.4%
Residents with income below 50% of the poverty level in 2022:
This zip code:
3.8%
Whole state:
7.0%
Median number of rooms in houses and condos:
Here:
8.2
State:
6.7
Median number of rooms in apartments:
Here:
4.4
State:
4.4
Notable locations in this zip code not listed on our city pages
Notable locations in zip code 45244: Little Miami Golf Center (A), Indian Valley Golf Course (B), Clermont County Industrial Park (C), Newtown Landfill (D), Newtown Town Hall (E), Anderson Township Fire and Rescue Department Station 100 (F), Union Township Fire Department Station 49 (G), Anderson Township Fire and Rescue Department Station 101 (H), Little Miami Joint Fire and Rescue District Station 76 Newtown (I), Union Township Library (J). Display/hide their locations on the map
Churches in zip code 45244 include: Saint Josephs Chapel (A), Old Pathway Church (B), Newtown United Methodist Church (C), All Saints Lutheran Church (D), Summerside United Methodist Church (E), First Baptist Church of Newtown (F), Mount Carmel Assembly of God Church (G), Saint Veronica Catholic Church (H), Saint John Fisher Roman Catholic Church (I). Display/hide their locations on the map
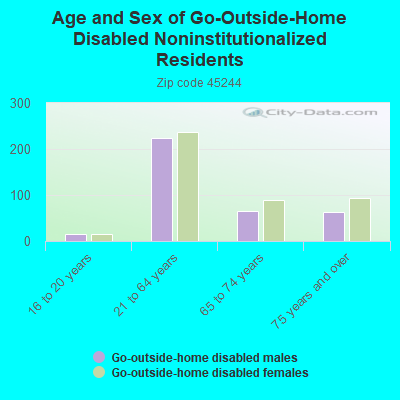
In group quarters: 22 (-1 institutionalized population)
Size of family households: 3,260 2-persons, 1,713 3-persons, 1,785 4-persons, 890 5-persons, 186 6-persons, 130 7-or-more-persons
Size of nonfamily households: 2,182 1-person, 612 2-persons, 11 3-persons
6,293 married couples with children.
1,317 single-parent households (532 men, 785 women).
95.4% of residents of 45244 zip code speak English at home.
1.3% of residents speak Spanish at home (51% very well, 33% well, 16% not well).
1.8% of residents speak other Indo-European language at home (76% very well, 21% well, 3% not well).
0.7% of residents speak Asian or Pacific Island language at home (60% very well, 40% well).
0.4% of residents speak other language at home (99% very well, 1% well).
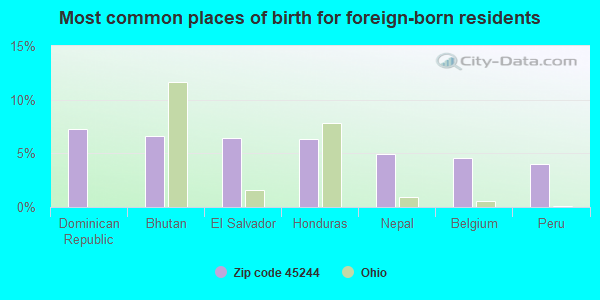
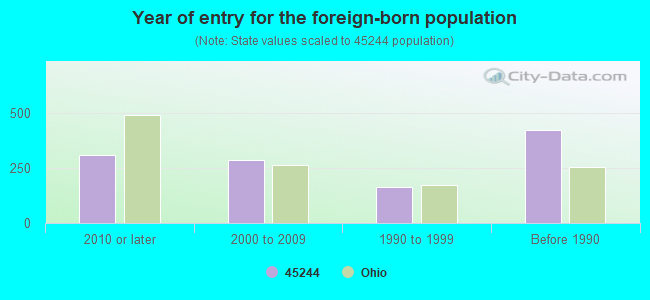
Foreign born population: 922 (3.2%) (78.7% of them are naturalized citizens)
This zip code:
3.2%
Whole state:
5.0%
7%Dominican Republic
7%Bhutan
6%El Salvador
6%Honduras
5%Nepal
5%Belgium
4%Peru
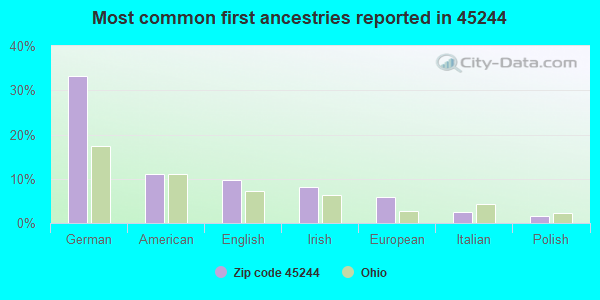
33%German
11%American
10%English
8%Irish
6%European
3%Italian
2%Polish
Year of entry for the foreign-born population
3102010 or later
2862000 to 2009
1651990 to 1999
422Before 1990
Facilities with environmental interests located in this zip code:
BARRETT PAVING MATERIALS INC (7374 MAIN ST in CINCINNATI, OH)
AIR SYNTHETIC MINOR (AIRS/AFS) STATE MASTER (Ohio general info) - AIR MAJOR STATE MASTER (Ohio general info) - RCRA-OHR000019034, HAZARDOUS WASTE PROGRAM Small Quantity Generators, between 100 kg and 1000 kg of hazardous waste/month (Resource Conservation and Recovery Act (tracking hazardous waste)) - notification Business SIC classification: ASPHALT PAVING MIXTURES AND BLOCKS
APPEARANCE PLUS CLEANERS (6812 CLOUGH PIKE in CINCINNATI, OH)
AIR MINOR (AIRS/AFS) STATE MASTER (Ohio general info) - AIR MAJOR Small Quantity Generators, between 100 kg and 1000 kg of hazardous waste/month (Resource Conservation and Recovery Act (tracking hazardous waste)) - notification Business SIC classification: DRYCLEANING PLANTS, EXCEPT RUG CLEANING Organizations: APPEARANCE PLUS CLEANERS INC (CONTACT/OWNER)
Alternative names: APPEARANCE PLUS CLEANERS 3266
Housing units lacking complete plumbing facilities: 1.2% Housing units lacking complete kitchen facilities: 0.6%
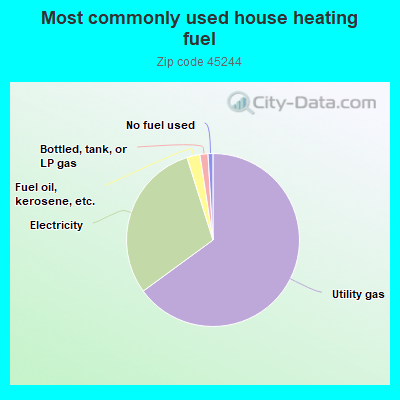
64.3%Utility gas
29.9%Electricity
2.4%Fuel oil, kerosene, etc.
1.5%Bottled, tank, or LP gas
0.9%No fuel used
Population in 1990: 12,310. Population change in the 1990s: +14,136 (+114.8%).
Place of birth for U.S.-born residents:
This state: 20,115
Northeast: 1,432
Midwest: 2,107
South: 2,820
West: 935
60% of the 45244 zip code residents lived in the same house 5 years ago. Out of people who lived in different houses, 52% lived in this county. Out of people who lived in different counties, 50% lived in Ohio.
93% of the 45244 zip code residents lived in the same house 1 year ago. Out of people who lived in different houses, 40% moved from this county. Out of people who lived in different houses, 32% moved from different county within same state. Out of people who lived in different houses, 24% moved from different state. Out of people who lived in different houses, 11% moved from abroad.
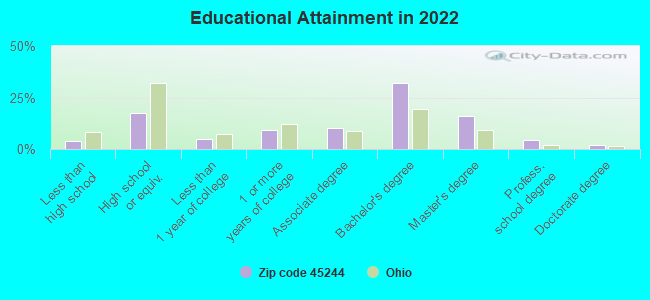
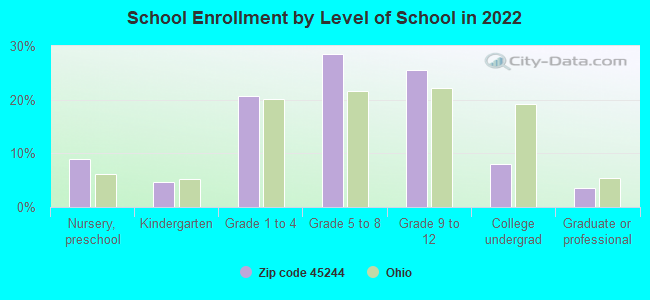
Private vs. public school enrollment:
Students in private schools in grades 1 to 8 (elementary and middle school): 872
Here:
22.7%
Ohio:
16.0%
Students in private schools in grades 9 to 12 (high school): 581
Here:
29.1%
Ohio:
13.1%
Students in private undergraduate colleges: 69
Here:
11.1%
Ohio:
22.3%
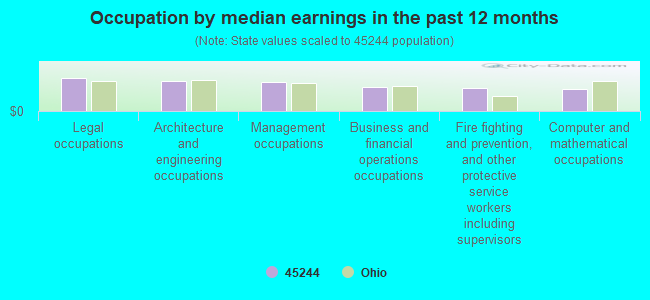
Occupation by median earnings in the past 12 months ($)
131,731Legal occupations
116,587Architecture and engineering occupations
113,932Management occupations
95,500Business and financial operations occupations
89,064Fire fighting and prevention, and other protective service workers including supervisors
88,468Computer and mathematical occupations
Companies with federal contracts located in this zip code (CINCINNATI, OH):
AMERICA'S BEST SERVICE, INC (3515 ROUND BOTTOM ROAD; small business) : $302,158 in 10 contractsfrom 2002 to 2006
Contracts for Maintenance, Repair and Rebuilding of Equipment -- Plumbing, Heating, and Waste Disposal Equipment, Maintenance, Repair or Alteration of Real Property -- Miscellaneous Buildings, Maintenance, Repair and Rebuilding of Equipment -- Refrigeration, Air Conditioning, and Air Circulating Equipment, Maintenance, Repair and Rebuilding of Equipment -- Miscellaneous, and moreby Army, U.S. Army Corps of Engineers - civil program financing only, Air Force, Navy, and others Signed by year:2000: $0; 2001: $0; 2002: $22,434; 2003: $37,766; 2004: $73,895; 2005: $155,317; 2006: $12,746.
Biggest contracts:
$67,720 with Army for Maintenance, Repair and Rebuilding of Equipment -- Plumbing, Heating, and Waste Disposal Equipment. Taking place in OK. Signed on 2005-04-27. Completion date: 2005-04-18.
$67,720 with U.S. Army Corps of Engineers - civil program financing only for Maintenance, Repair and Rebuilding of Equipment -- Plumbing, Heating, and Waste Disposal Equipment. Taking place in OK. Signed on 2005-04-27. Completion date: 2005-04-18.
$56,075 with Air Force for Maintenance, Repair or Alteration of Real Property -- Miscellaneous Buildings. Taking place in GA. Signed on 2004-04-30. Completion date: 2004-07-16.
$37,766 with Army for Maintenance, Repair and Rebuilding of Equipment -- Refrigeration, Air Conditioning, and Air Circulating Equipment. Taking place in KS. Signed on 2003-08-29. Completion date: 2003-04-30.
MARY AND LEWIS KAHLER (3590 ROUND BOTTOM RD PMB F; small business) : $72,037 in 19 contractsfrom 2004 to 2006
Contracts for Other Administrative Support Services, Operation of Government-Owned Facilities -- Recreation Facilities (Non-Building), Other Housekeeping Services by Army, U.S. Army Corps of Engineers - civil program financing only Signed by year:2000: $0; 2001: $0; 2002: $0; 2003: $0; 2004: $33,358; 2005: $22,674; 2006: $16,005.
Biggest contracts:
$16,895 with Army for Other Administrative Support Services. Taking place in CA. Signed on 2004-01-09. Completion date: 2004-09-30.
$16,895 with U.S. Army Corps of Engineers - civil program financing only for Other Administrative Support Services. Taking place in CA. Signed on 2004-01-09. Completion date: 2004-09-30.
$16,005 with Army for Operation of Government-Owned Facilities -- Recreation Facilities (Non-Building). Taking place in CA. Signed on 2006-04-14. Completion date: 2006-09-30.
$10,431 with U.S. Army Corps of Engineers - civil program financing only for Operation of Government-Owned Facilities -- Recreation Facilities (Non-Building). Taking place in ID. Signed on 2005-05-17. Completion date: 2005-05-12.
HENSLEY, TOM (3590 ROUND BOTTOM RD; small business) : $33,335 in 2 contractsin 2000
$33,335 with U.S. Army Corps of Engineers - civil program financing only for Custodial Janitorial Services. Taking place in ID. Signed on 2000-02-23. Completion date: 2000-09-22.
$0, same as above.Signed on 2000-02-23. Completion date: 2000-09-22.
NORMA GOTTSCHALK (3590 ROUNDBOTTOM RD; small business) : $31,006 in 9 contractsfrom 2001 to 2006
Contracts for Recreation Site Maintenance Services (non-construction) by Army, U.S. Army Corps of Engineers - civil program financing only Signed by year:2000: $0; 2001: $4,410; 2002: $675; 2003: $0; 2004: $0; 2005: $14,665; 2006: $11,256.
Biggest contracts:
$11,256 with Army for Recreation Site Maintenance Services (non-construction). Signed on 2006-03-01. Completion date: 2006-11-15.
$5,382 with U.S. Army Corps of Engineers - civil program financing only for Recreation Site Maintenance Services (non-construction). Signed on 2005-04-07. Completion date: 2005-09-06.
$5,382 with Army for Recreation Site Maintenance Services (non-construction). Signed on 2005-04-07. Completion date: 2005-09-06.
$4,410 with U.S. Army Corps of Engineers - civil program financing only for Recreation Site Maintenance Services (non-construction). Taking place in GA. Signed on 2001-05-03. Completion date: 2001-09-03.
DRYSDALE & ASSOCIATES, INC (595 CHICORY LANE; small business) : $27,854 in 2 contractsfrom 2004 to 2005
$24,999 with Navy for Electrical and Electronic Properties Measuring and Testing Instruments. Signed on 2004-11-30. Completion date: 2005-01-12.
$2,855 with Air Force for Laboratory Equipment and Supplies. Signed on 2005-09-14. Completion date: 2005-10-19.
LAURA M RECTOR (3590 ROUND BOTTOM ROAD; small business) : $11,310 in 6 contractsfrom 2000 to 2003
Contracts for Recreation Site Maintenance Services (non-construction) by U.S. Army Corps of Engineers - civil program financing only Signed by year:2000: $2,400; 2001: $6,880; 2002: $0; 2003: $2,030; 2004: $0; 2005: $0; 2006: $0.
Biggest contracts:
$6,880 with U.S. Army Corps of Engineers - civil program financing only for Recreation Site Maintenance Services (non-construction). Taking place in GA. Signed on 2001-03-22. Completion date: 2001-09-04.
$5,460 with U.S. Army Corps of Engineers - civil program financing only for Recreation Site Maintenance Services (non-construction). Signed on 2003-03-25. Completion date: 2003-09-03.
$2,400 with U.S. Army Corps of Engineers - civil program financing only for Recreation Site Maintenance Services (non-construction). Taking place in GA. Signed on 2000-10-23. Completion date: 2000-10-30.
$70 with U.S. Army Corps of Engineers - civil program financing only for Recreation Site Maintenance Services (non-construction). Signed on 2003-06-05. Completion date: 2003-09-03.
JONES FISH HATCHERY & DISTRIBU (3433 CHURCH ST)
$7,963 with Air Force for Fish Hatchery Services. Signed on 2005-09-14. Completion date: 2006-03-24.
Top industries in this zip code by the number of employees in 2005:
Other Services (except Public Administration): Religious Organizations (100-249 employees: 1 establishment, 50-99 employees: 1 establishment, 10-19 employees: 1 establishment, 5-9 employees: 4 establishments, 1-4 employees: 10 establishments)
2002 - 2018 National Fire Incident Reporting System (NFIRS) incidents
According to the data from the years 2002 - 2018 the average number of fire incidents per year is 40. The highest number of fires - 74 took place in 2008, and the least - 19 in 2017. The data has a dropping trend.
When looking into fire subcategories, the most incidents belonged to: Structure Fires (44.2%), and Outside Fires (38.1%).
Fire incident types reported to NFIRS in Zip Code 45244


 Nearest zip codes: 45174, 45255, 45227, 45245, 45230, 45243.


 According to the data from the years 2002 - 2018 the average number of fire incidents per year is 40. The highest number of fires - 74 took place in 2008, and the least - 19 in 2017. The data has a dropping trend.
 When looking into fire subcategories, the most incidents belonged to: Structure Fires (44.2%), and Outside Fires (38.1%).