Estimated zip code population in 2022: 10,700 Zip code population in 2010: 9,601 Zip code population in 2000: 11,310
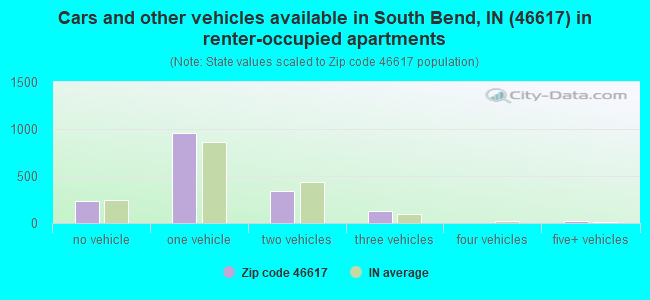
Houses and condos: 5,316 Renter-occupied apartments: 1,675
% of renters here:
37%
State:
29%
March 2022 cost of living index in zip code 46617: 86.9 (less than average, U.S. average is 100)
Land area: 2.6 sq. mi. Water area: 0.1 sq. mi.
Population density: 4,110 people per square mile
(average).
OSM Map
General Map
Google Map
MSN Map
OSM Map
General Map
Google Map
MSN Map
OSM Map
General Map
Google Map
MSN Map
OSM Map
General Map
Google Map
MSN Map
Please wait while loading the map...
Real estate property taxes paid for housing units in 2022:
This zip code:
0.9% ($2,034)
Indiana:
0.7% ($1,467)
Median real estate property taxes paid for housing units with mortgages in 2022: $2,248 (1.0%) Median real estate property taxes paid for housing units with no mortgage in 2022: $1,921 (0.9%)
Business Search- 14 Million verified businesses
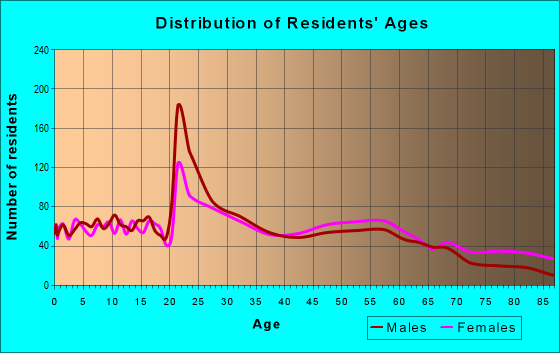
Males: 5,349
(50.0%)
Females: 5,350
(50.0%)
For population 25 years and over in 46617:
High school or higher: 99.3%
Bachelor's degree or higher: 63.9%
Graduate or professional degree: 28.6%
Unemployed: 3.7%
Mean travel time to work (commute): 15.3 minutes
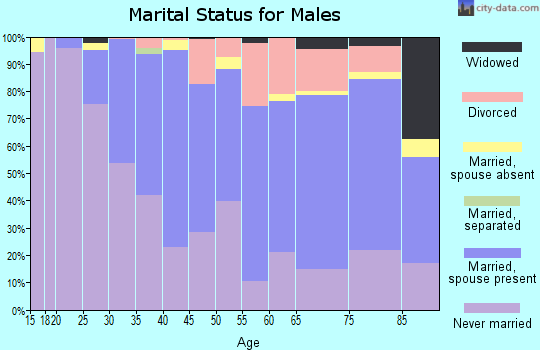
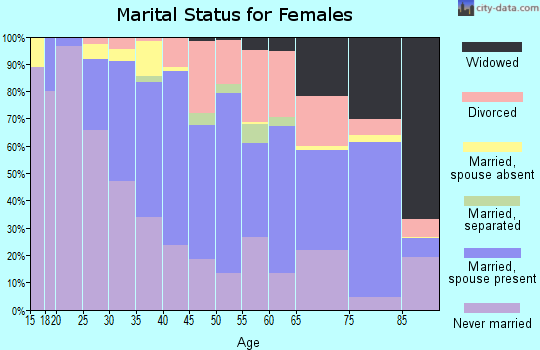
For population 15 years and over in 46617:
Never married: 44.5%
Now married: 38.6%
Separated: 0.7%
Widowed: 5.3%
Divorced: 11.0%
Zip code 46617 compared to state average:
Black race population percentage above state average.
Foreign-born population percentage above state average.
Length of stay since moving in significantly above state average.
Number of college students above state average.
Percentage of population with a bachelor's degree or higher above state average.
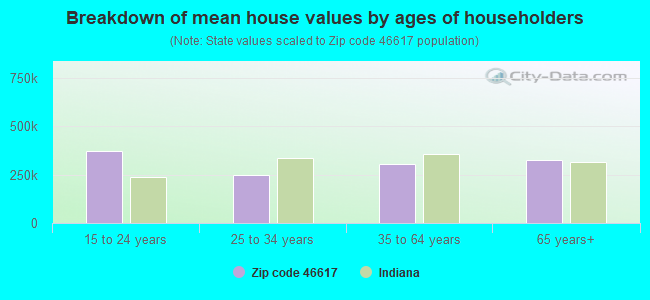
Estimated median house/condo value in 2022: $230,752
46617:
$230,752
Indiana:
$208,700
Median resident age:
This zip code:
34.5 years
Indiana median age:
38.2 years
Average household size:
This zip code:
2.3 people
Indiana:
2.4 people
Averages for the 2020 tax year for zip code 46617, filed in 2021:
Average Adjusted Gross Income (AGI) in 2020: $82,588 (Individual Income Tax Returns)
Here:
$82,588
State:
$64,978
Salary/wage: $66,327 (reported on 84.9% of returns)
Here:
$66,327
State:
$55,245
(% of AGI for various income ranges: 1063.0% for AGIs below $25k, 3727.3% for AGIs $25k-50k, 6712.8% for AGIs $50k-75k, 9525.8% for AGIs $75k-100k, 17850.6% for AGIs $100k-200k, 78025.8% for AGIs over 200k)
Taxable interest for individuals: $1,997 (reported on 34.9% of returns)
This zip code:
$1,997
Indiana:
$1,351
(% of AGI for various income ranges: 17.3% for AGIs below $25k, 18.3% for AGIs $25k-50k, 64.1% for AGIs $50k-75k, 52.3% for AGIs $75k-100k, 186.7% for AGIs $100k-200k, 1440.8% for AGIs over 200k)
Ordinary dividends: $11,115 (reported on 26.0% of returns)
Here:
$11,115
State:
$5,827
(% of AGI for various income ranges: 25.2% for AGIs below $25k, 43.1% for AGIs $25k-50k, 121.5% for AGIs $50k-75k, 205.8% for AGIs $75k-100k, 634.2% for AGIs $100k-200k, 7624.2% for AGIs over 200k)
Net capital gain/loss in AGI: +$31,491 (reported on 22.9% of returns)
Here:
+$31,491
State:
+$17,730
(% of AGI for various income ranges: 14.8% for AGIs below $25k, 45.4% for AGIs $25k-50k, 159.8% for AGIs $50k-75k, 362.7% for AGIs $75k-100k, 943.0% for AGIs $100k-200k, 22562.5% for AGIs over 200k)
Profit/loss from business: +$15,300 (reported on 15.8% of returns)
Here:
+$15,300
State:
+$12,144
(% of AGI for various income ranges: 90.8% for AGIs below $25k, 99.7% for AGIs $25k-50k, 199.8% for AGIs $50k-75k, 360.4% for AGIs $75k-100k, 1008.2% for AGIs $100k-200k, 3139.2% for AGIs over 200k)
Taxable individual retirement arrangement distribution: $21,507 (reported on 9.6% of returns)
46617:
$21,507
Indiana:
$18,302
(% of AGI for various income ranges: 48.1% for AGIs below $25k, 81.6% for AGIs $25k-50k, 141.5% for AGIs $50k-75k, 323.1% for AGIs $75k-100k, 981.2% for AGIs $100k-200k, 2707.5% for AGIs over 200k)
Self-employed (Keogh) retirement plans: $34,840 (reported on 1.1% of returns)
46617:
$34,840
Indiana:
$27,160
(% of AGI for various income ranges: 1451.7% for AGIs over 200k)
Total itemized deductions: $50,592 (reported on 8.7% of returns)
Here:
$50,592
State:
$35,601
(% of AGI for various income ranges: 76.6% for AGIs below $25k, 200.0% for AGIs $50k-75k, 276.2% for AGIs $75k-100k, 1128.5% for AGIs $100k-200k, 11252.5% for AGIs over 200k)
Charity contributions: $33,330 (reported on 7.3% of returns)
Here:
$33,330
State:
$15,596
(% of AGI for various income ranges: 60.2% for AGIs $50k-75k, 97.7% for AGIs $75k-100k, 409.4% for AGIs $100k-200k, 7597.5% for AGIs over 200k)
Taxes paid: $8,218 (reported on 8.7% of returns)
46617:
$8,218
State:
$7,542
(% of AGI for various income ranges: 10.1% for AGIs below $25k, 46.5% for AGIs $50k-75k, 71.5% for AGIs $75k-100k, 290.9% for AGIs $100k-200k, 1442.5% for AGIs over 200k)
Earned income credit: $2,190 (reported on 13.8% of returns)
Here:
$2,190
State:
$2,298
(% of AGI for various income ranges: 78.3% for AGIs below $25k, 53.1% for AGIs $25k-50k)
Percentage of individuals using paid preparers for their 2020 taxes: 91.8%
Here:
92%
State:
94%
(% for various income ranges: 90.6% for AGIs below $25k, 92.7% for AGIs $25k-50k, 93.5% for AGIs $50k-75k, 91.9% for AGIs $75k-100k, 89.7% for AGIs $100k-200k, 94.1% for AGIs over 200k)
Averages for the 2012 tax year for zip code 46617, filed in 2013:
Average Adjusted Gross Income (AGI) in 2012: $65,545 (Individual Income Tax Returns)
Here:
$65,545
State:
$52,932
Salary/wage: $52,029 (reported on 87.3% of returns)
Here:
$52,029
State:
$45,173
(% of AGI for various income ranges: 76.9% for AGIs below $25k, 84.7% for AGIs $25k-50k, 81.7% for AGIs $50k-75k, 78.3% for AGIs $75k-100k, 74.9% for AGIs $100k-200k, 52.4% for AGIs over 200k)
Taxable interest for individuals: $1,748 (reported on 36.6% of returns)
This zip code:
$1,748
Indiana:
$1,311
(% of AGI for various income ranges: 1.0% for AGIs below $25k, 0.6% for AGIs $25k-50k, 0.8% for AGIs $50k-75k, 1.0% for AGIs $75k-100k, 1.1% for AGIs $100k-200k, 1.1% for AGIs over 200k)
Ordinary dividends: $11,910 (reported on 24.8% of returns)
Here:
$11,910
State:
$4,690
(% of AGI for various income ranges: 1.6% for AGIs below $25k, 1.3% for AGIs $25k-50k, 1.9% for AGIs $50k-75k, 1.7% for AGIs $75k-100k, 3.3% for AGIs $100k-200k, 8.5% for AGIs over 200k)
Net capital gain/loss in AGI: +$10,874 (reported on 20.0% of returns)
Here:
+$10,874
State:
+$10,406
(% of AGI for various income ranges: 0.2% for AGIs $25k-50k, 0.6% for AGIs $50k-75k, 0.6% for AGIs $75k-100k, 1.8% for AGIs $100k-200k, 7.7% for AGIs over 200k)
Profit/loss from business: +$13,392 (reported on 15.3% of returns)
Here:
+$13,392
State:
+$11,105
(% of AGI for various income ranges: 5.6% for AGIs below $25k, 2.1% for AGIs $25k-50k, 1.5% for AGIs $50k-75k, 2.3% for AGIs $75k-100k, 4.2% for AGIs $100k-200k, 3.2% for AGIs over 200k)
Taxable individual retirement arrangement distribution: $13,976 (reported on 10.8% of returns)
46617:
$13,976
Indiana:
$13,841
(% of AGI for various income ranges: 2.7% for AGIs below $25k, 1.8% for AGIs $25k-50k, 2.7% for AGIs $50k-75k, 2.7% for AGIs $75k-100k, 3.8% for AGIs $100k-200k, 1.3% for AGIs over 200k)
Self-employment retirement plans: $23,540 (reported on 1.2% of returns)
46617:
$23,540
Indiana:
$21,482
(% of AGI for various income ranges: 0.7% for AGIs $50k-75k, 0.9% for AGIs over 200k)
Total itemized deductions: $29,105 (19% of AGI, reported on 28.3% of returns)
Here:
$29,105
State:
$20,913
Here:
18.9% of AGI
State:
18.2% of AGI
(% of AGI for various income ranges: 5.2% for AGIs below $25k, 6.6% for AGIs $25k-50k, 10.2% for AGIs $50k-75k, 11.3% for AGIs $75k-100k, 13.9% for AGIs $100k-200k, 16.6% for AGIs over 200k)
Charity contributions: $7,656 (reported on 24.5% of returns)
Here:
$7,656
State:
$4,697
(% of AGI for various income ranges: 0.6% for AGIs below $25k, 1.2% for AGIs $25k-50k, 1.8% for AGIs $50k-75k, 1.6% for AGIs $75k-100k, 3.2% for AGIs $100k-200k, 4.4% for AGIs over 200k)
Taxes paid: $11,271 (reported on 28.1% of returns)
46617:
$11,271
State:
$7,456
(% of AGI for various income ranges: 1.0% for AGIs below $25k, 1.8% for AGIs $25k-50k, 3.0% for AGIs $50k-75k, 3.7% for AGIs $75k-100k, 6.7% for AGIs $100k-200k, 6.5% for AGIs over 200k)
Earned income credit: $2,416 (reported on 17.7% of returns)
Here:
$2,416
State:
$2,265
(% of AGI for various income ranges: 7.4% for AGIs below $25k, 0.8% for AGIs $25k-50k)
Percentage of individuals using paid preparers for their 2012 taxes: 40.8%
Here:
41%
State:
53%
(% for various income ranges: 34.5% for AGIs below $25k, 34.0% for AGIs $25k-50k, 44.8% for AGIs $50k-75k, 51.6% for AGIs $75k-100k, 54.8% for AGIs $100k-200k, 73.7% for AGIs over 200k)
Averages for the 2004 tax year for zip code 46617, filed in 2005:
Average Adjusted Gross Income (AGI) in 2004: $48,551 (Individual Income Tax Returns)
Here:
$48,551
State:
$44,790
Salary/wage: $38,729 (reported on 84.7% of returns)
Here:
$38,729
State:
$39,615
(% of AGI for various income ranges: 101.5% for AGIs below $10k, 78.7% for AGIs $10k-25k, 82.5% for AGIs $25k-50k, 80.8% for AGIs $50k-75k, 78.1% for AGIs $75k-100k, 50.6% for AGIs over 100k)
Taxable interest for individuals: $2,704 (reported on 46.1% of returns)
This zip code:
$2,704
Indiana:
$1,535
(% of AGI for various income ranges: 6.5% for AGIs below $10k, 2.8% for AGIs $10k-25k, 2.0% for AGIs $25k-50k, 1.9% for AGIs $50k-75k, 1.5% for AGIs $75k-100k, 3.1% for AGIs over 100k)
Taxable dividends: $5,423 (reported on 27.5% of returns)
Here:
$5,423
State:
$2,998
(% of AGI for various income ranges: 4.1% for AGIs below $10k, 1.6% for AGIs $10k-25k, 1.5% for AGIs $25k-50k, 2.1% for AGIs $50k-75k, 2.4% for AGIs $75k-100k, 4.5% for AGIs over 100k)
Net capital gain/loss: +$9,086 (reported on 22.0% of returns)
Here:
+$9,086
State:
+$8,619
(% of AGI for various income ranges: -2.4% for AGIs below $10k, 0.7% for AGIs $10k-25k, 1.1% for AGIs $25k-50k, 0.7% for AGIs $50k-75k, 1.5% for AGIs $75k-100k, 8.1% for AGIs over 100k)
Profit/loss from business: +$14,818 (reported on 12.8% of returns)
Here:
+$14,818
State:
+$10,071
(% of AGI for various income ranges: 4.7% for AGIs below $10k, 2.4% for AGIs $10k-25k, 2.5% for AGIs $25k-50k, 2.2% for AGIs $50k-75k, 2.7% for AGIs $75k-100k, 5.6% for AGIs over 100k)
IRA payment deduction: $2,981 (reported on 2.4% of returns)
46617:
$2,981
Indiana:
$2,840
(% of AGI for various income ranges: 0.2% for AGIs $10k-25k, 0.4% for AGIs $25k-50k, 0.2% for AGIs $50k-75k, 0.2% for AGIs $75k-100k)
Self-employed pension: $18,176 (reported on 1.2% of returns)
Here:
$18,176
Indiana:
$15,305
Total itemized deductions: $20,727 (21% of AGI, reported on 34.4% of returns)
Here:
$20,727
State:
$17,065
Here:
21.3% of AGI
State:
19.5% of AGI
(% of AGI for various income ranges: 10.9% for AGIs below $10k, 10.3% for AGIs $10k-25k, 12.4% for AGIs $25k-50k, 14.2% for AGIs $50k-75k, 16.2% for AGIs $75k-100k, 16.4% for AGIs over 100k)
Charity contributions deductions: $7,393 (7% of AGI, reported on 29.9% of returns)
Here:
$7,393
State:
$3,550
Here:
7.1% of AGI
State:
3.8% of AGI
(% of AGI for various income ranges: 0.7% for AGIs below $10k, 1.4% for AGIs $10k-25k, 1.7% for AGIs $25k-50k, 2.7% for AGIs $50k-75k, 3.4% for AGIs $75k-100k, 7.4% for AGIs over 100k)
Total tax: $8,818 (reported on 70.3% of returns)
46617:
$8,818
State:
$6,914
(% of AGI for various income ranges: 2.3% for AGIs below $10k, 3.7% for AGIs $10k-25k, 7.2% for AGIs $25k-50k, 9.7% for AGIs $50k-75k, 10.5% for AGIs $75k-100k, 18.9% for AGIs over 100k)
Earned income credit: $1,881 (reported on 17.1% of returns)
Here:
$1,881
State:
$1,685
Percentage of individuals using paid preparers for their 2004 taxes: 50.4%
Here:
50%
State:
59%
(% for various income ranges: 47.4% for AGIs below $10k, 54.5% for AGIs $10k-25k, 47.4% for AGIs $25k-50k, 47.7% for AGIs $50k-75k, 47.9% for AGIs $75k-100k, 59.9% for AGIs over 100k)
Likely homosexual households (counted as self-reported same-sex unmarried-partner households)
Lesbian couples: 0.3% of all households
Gay men: 0.0% of all households
Household received Food Stamps/SNAP in the past 12 months: 211 Household did not receive Food Stamps/SNAP in the past 12 months: 4,371
Women who had a birth in the past 12 months: 133 (130 now married, 10 unmarried) Women who did not have a birth in the past 12 months: 2,622 (717 now married, 1,896 unmarried)
Housing units in zip code 46617 with a mortgage: 1,502 (215 second mortgage, 210 both second mortgage and home equity loan) Houses without a mortgage: 31
Median monthly owner costs for units with a mortgage: $1,312 Median monthly owner costs for units without a mortgage: $488
Residents with income below the poverty level in 2022:
This zip code:
15.6%
Whole state:
12.6%
Residents with income below 50% of the poverty level in 2022:
This zip code:
6.8%
Whole state:
6.3%
Median number of rooms in houses and condos:
Here:
6.7
State:
6.6
Median number of rooms in apartments:
Here:
4.3
State:
4.3
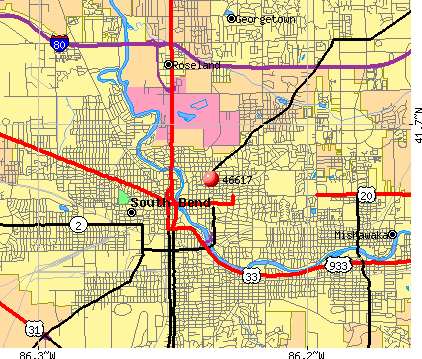
Notable locations in this zip code not listed on our city pages
Notable locations in zip code 46617: Madison Hospital and Care Center (A), Riverside Hospital and Care Center (B), South Bend Fire Department Station 3 (C). Display/hide their locations on the map
1,383 married couples with children.
466 single-parent households (108 men, 358 women).
89.0% of residents of 46617 zip code speak English at home.
5.7% of residents speak Spanish at home (84% very well, 3% well, 13% not well).
2.6% of residents speak other Indo-European language at home (92% very well, 8% well).
1.8% of residents speak Asian or Pacific Island language at home (56% very well, 17% well, 27% not well).
1.4% of residents speak other language at home (14% very well, 14% well, 71% not well).
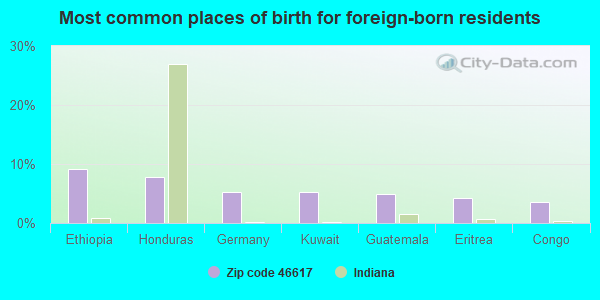
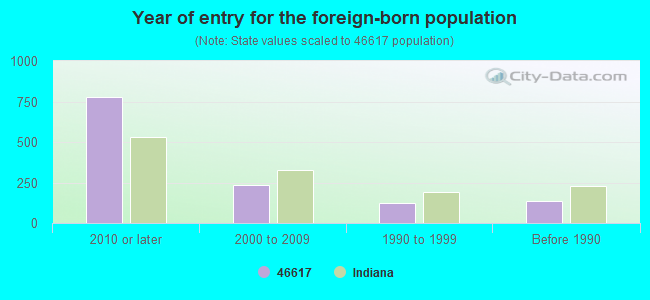
Foreign born population: 1,101 (10.3%) (39.8% of them are naturalized citizens)
Facilities with environmental interests located in this zip code:
PERLEY ELEMENTARY SCHOOL (740 N EDDY ST in SOUTH BEND, IN)
(Geographic Names Information System) STATE MASTER (Indiana facility tracking) - CRTK-8971, EPCRA (National Center for Education Statistics) - STATE ID-7613 Organizations: SOUTH BEND COMMUNITY SCH CORP (SCHOOL DISTRICT)
MCKINLEY ELEMENTARY SCHOOL (228 N GREENLAWN AVE in SOUTH BEND, IN)
(Geographic Names Information System) STATE MASTER (Indiana facility tracking) - CRTK-8966, EPCRA (National Center for Education Statistics) - STATE ID-7569 Organizations: SOUTH BEND COMMUNITY SCH CORP (SCHOOL DISTRICT)
MADISON CTR INC (701 N NILES AVE in SOUTH BEND, IN)
STATE MASTER (Indiana facility tracking) - UST-22315, UNDERGROUND STORAGE TANK PROGRAM (National Center for Education Statistics) - STATE ID-7627 Organizations: SOUTH BEND COMMUNITY SCH CORP (SCHOOL DISTRICT)
NORTHERN ELECTRIC CO INC (116 N HILL ST in SOUTH BEND, IN)
STATE MASTER (Indiana facility tracking) - ACES-OP-14100096, AIR PROGRAM Conditionally Exempt Small Quantity Generators, less than 100 kg/month of hazardous waste (Resource Conservation and Recovery Act (tracking hazardous waste)) - notification Organizations: HOWARD DOSMANN (CONTACT/OWNER)
SEVEN ELEVEN FOOD STORE 21387 (323 N EDDY ST in SOUTH BEND, IN)
STATE MASTER (Indiana facility tracking) - CRTK-4780, EPCRA, UST-15147, UNDERGROUND STORAGE TANK PROGRAM Conditionally Exempt Small Quantity Generators, less than 100 kg/month of hazardous waste (Resource Conservation and Recovery Act (tracking hazardous waste)) - notification Organizations: 7 ELEVEN INC (CONTACT/OWNER)
Alternative names: SEVEN ELEVEN 21387
RINK RIVERSIDE PRINTING INC (209 E COLFAX in SOUTH BEND, IN)
STATE MASTER (Indiana facility tracking) (Resource Conservation and Recovery Act (tracking hazardous waste)) Organizations: RINK MICHAEL S (CONTACT/OWNER)
CORBY FABRIC CTR (1015 CORBY BLVD in SOUTH BEND, IN)
STATE MASTER (Indiana facility tracking) Conditionally Exempt Small Quantity Generators, less than 100 kg/month of hazardous waste (Resource Conservation and Recovery Act (tracking hazardous waste)) - notification Organizations: SLATT PHIL (CONTACT/OWNER)
RUBIN CLEANERS (625 E JEFFERSON ST in SOUTH BEND, IN)
STATE MASTER (Indiana facility tracking) Small Quantity Generators, between 100 kg and 1000 kg of hazardous waste/month (Resource Conservation and Recovery Act (tracking hazardous waste)) - notification Organizations: WILTON MICHAEL (CONTACT/OWNER)
7 ELEVEN 32573 (501 E LASALLE in SOUTH BEND, IN)
STATE MASTER (Indiana facility tracking) Conditionally Exempt Small Quantity Generators, less than 100 kg/month of hazardous waste (Resource Conservation and Recovery Act (tracking hazardous waste)) - notification Organizations: SOUTHLAND CORP THE (CONTACT/OWNER)
Housing units lacking complete plumbing facilities: 1.4% Housing units lacking complete kitchen facilities: 0.5%
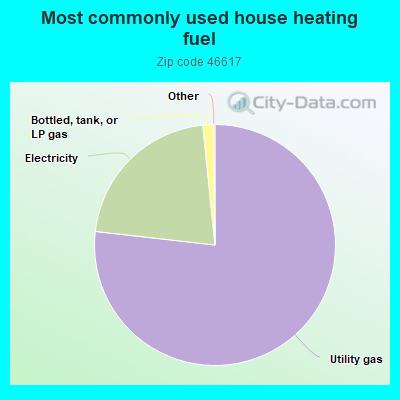
76.8%Utility gas
21.6%Electricity
1.4%Bottled, tank, or LP gas
Population in 1990: 11,057. Population change in the 1990s: +253 (+2.3%).
Place of birth for U.S.-born residents:
This state: 4,849
Northeast: 697
Midwest: 2,308
South: 922
West: 803
54% of the 46617 zip code residents lived in the same house 5 years ago. Out of people who lived in different houses, 57% lived in this county. Out of people who lived in different counties, 50% lived in Indiana.
87% of the 46617 zip code residents lived in the same house 1 year ago. Out of people who lived in different houses, 46% moved from this county. Out of people who lived in different houses, 9% moved from different county within same state. Out of people who lived in different houses, 28% moved from different state. Out of people who lived in different houses, 17% moved from abroad.
Private vs. public school enrollment:
Students in private schools in grades 1 to 8 (elementary and middle school): 245
Here:
31.4%
Indiana:
14.9%
Students in private schools in grades 9 to 12 (high school): 94
Here:
14.4%
Indiana:
11.4%
Students in private undergraduate colleges: 576
Here:
69.8%
Indiana:
22.3%
Occupation by median earnings in the past 12 months ($)
80,544Architecture and engineering occupations
71,309Management occupations
69,620Legal occupations
68,218Health diagnosing and treating practitioners and other technical occupations
57,793Arts, design, entertainment, sports, and media occupations
55,513Business and financial operations occupations
Companies with federal contracts located in this zip code (SOUTH BEND, IN):
AM GENERAL LLC (105 N NILES AVE) : $3,776,189,875 in 1103 contractsfrom 1999 to 2006
Contracts for Trucks and Truck Tractors, Wheeled, Passenger Motor Vehicles, Defense Tank - Automotive -- Engineering Development (R&D), Diesel Engines and Components, and moreby Army, ENERGY, Department of, U.S. Special Operations Command, Department of Defense, and others Signed by year:2000: $197,212,924; 2001: $215,638,077; 2002: $418,796,442; 2003: $459,615,292; 2004: $894,592,274; 2005: $880,156,141; 2006: $647,240,559.
Biggest contracts:
$215,590,918 with Army for Trucks and Truck Tractors, Wheeled. Signed on 2004-09-10. Completion date: 2007-12-31.
$163,370,186, same as above.Signed on 2004-11-10. Completion date: 2007-12-31.
$161,137,100, same as above.Signed on 2005-09-02. Completion date: 2007-12-31.
$120,817,716, same as above.Signed on 2005-06-13. Completion date: 2007-12-31.
UNDERWRITERS LABORATORIES INC (110 S HILL ST; small business) : $2,618,814 in 54 contractsfrom 2001 to 2006
Contracts for Technical Assistance, Environmental Studies and Assessments, Other Special Studies and Analyses, Chemical/Biological Studies and Analyses, and moreby EPA, Army, Geological Survey, Navy, and others Signed by year:2000: $0; 2001: $1,004,000; 2002: $914,000; 2003: $113,035; 2004: $367,764; 2005: $165,700; 2006: $54,315.
Biggest contracts:
$500,000 with EPA for Technical Assistance. Signed on 2001-09-15. Completion date: 2005-10-15.
$500,000, same as above.Signed on 2002-03-15. Completion date: 2005-10-15.
$500,000, same as above.Signed on 2002-09-15. Completion date: 2005-10-15.
$476,000, same as above.Signed on 2001-04-15. Completion date: 2005-10-15.
DONNELL SYSTEMS, INC (300 S ST LOUIS BLVD STE; small business) : $1,249,032 in 12 contractsfrom 2000 to 2006
Contracts for ADP Software, Automated Information System Design and Integration Services, ADP Supplies by Navy, U.S. Coast Guard Signed by year:2000: $115,200; 2001: $115,200; 2002: $152,624; 2003: $208,820; 2004: $273,592; 2005: $264,897; 2006: $118,699.
Biggest contracts:
$252,501 with Navy for ADP Software. Signed on 2005-09-12. Completion date: 2006-09-29.
$237,592 with Navy for Automated Information System Design and Integration Services. Signed on 2004-09-20. Completion date: 2005-09-30.
$208,820, same as above.Signed on 2003-09-25. Completion date: 2004-09-30.
$152,624, same as above.Signed on 2002-09-30. Completion date: 2003-09-30.
WESTERINK AND LUETTICH CONSULT (1204 NORTH ST JOSEPH STRE; small business) : $221,949 in 17 contractsfrom 2000 to 2005
Contracts for Education Services, Data Analyses (other than scientific), Environmental Sciences -- Applied Research and Exploratory Development (R&D), Other Professional Services, and moreby U.S. Army Corps of Engineers - civil program financing only, Navy, Army Signed by year:2000: $44,900; 2001: $0; 2002: $18,271; 2003: $54,000; 2004: $104,788; 2005: -$10; 2006: $0.
Biggest contracts:
$54,000 with U.S. Army Corps of Engineers - civil program financing only for Education Services. Signed on 2003-02-18. Completion date: 2003-01-28.
$44,900 with U.S. Army Corps of Engineers - civil program financing only for Data Analyses (other than scientific). Signed on 2000-08-07. Completion date: 2000-07-30.
$25,000 with Navy for Environmental Sciences -- Applied Research and Exploratory Development (R&D). Signed on 2004-06-25. Completion date: 2004-10-24.
$19,950 with Army for Other Professional Services. Taking place in LA. Signed on 2004-07-15. Completion date: 2004-08-10.
Top industries in this zip code by the number of employees in 2005:
Health Care and Social Assistance: Offices of Physicians (except Mental Health Specialists) (500-999 employees: 1 establishment, 250-499 employees: 1 establishment, 100-249 employees: 1 establishment, 50-99 employees: 1 establishment, 20-49 employees: 2 establishments, 10-19 employees: 7 establishments, 5-9 employees: 10 establishments, 1-4 employees: 13 establishments)
Health Care and Social Assistance: General Medical and Surgical Hospitals (over 1000: 1)
Administrative and Support and Waste Management and Remediation Services: Temporary Help Services (250-499: 1, 100-249: 1, 50-99: 2, 20-49: 1, 10-19: 1)
Health Care and Social Assistance: Other Individual and Family Services (250-499: 1, 20-49: 1, 5-9: 2, 1-4: 1)
Health Care and Social Assistance: Child and Youth Services (250-499: 1, 10-19: 1)
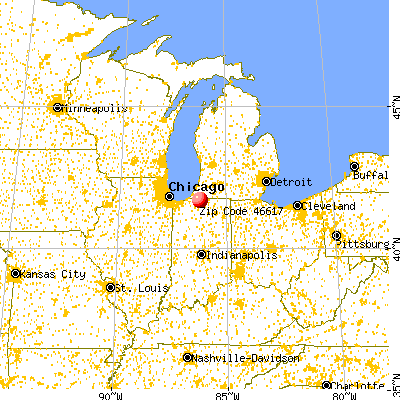


 Nearest zip codes: 46601, 46615, 46556, 46616, 46613, 46635.