Estimated zip code population in 2022: 14,253 Zip code population in 2010: 12,814 Zip code population in 2000: 15,080
Houses and condos: 9,736 Renter-occupied apartments: 6,733
% of renters here:
88%
State:
27%
March 2022 cost of living index in zip code 48201: 113.8 (more than average, U.S. average is 100)
Land area: 2.0 sq. mi. Water area: 0.0 sq. mi.
Population density: 7,108 people per square mile
(high).
OSM Map
General Map
Google Map
MSN Map
OSM Map
General Map
Google Map
MSN Map
OSM Map
General Map
Google Map
MSN Map
OSM Map
General Map
Google Map
MSN Map
Please wait while loading the map...
Real estate property taxes paid for housing units in 2022:
This zip code:
1.0% ($4,344)
Michigan:
1.2% ($2,746)
Median real estate property taxes paid for housing units with mortgages in 2022: $4,283 (0.9%) Median real estate property taxes paid for housing units with no mortgage in 2022: $4,352 (1.1%)
Averages for the 2020 tax year for zip code 48201, filed in 2021:
Average Adjusted Gross Income (AGI) in 2020: $62,776 (Individual Income Tax Returns)
Here:
$62,776
State:
$68,945
Salary/wage: $53,947 (reported on 80.4% of returns)
Here:
$53,947
State:
$57,142
(% of AGI for various income ranges: 956.6% for AGIs below $25k, 3249.6% for AGIs $25k-50k, 7088.2% for AGIs $50k-75k, 11618.6% for AGIs $75k-100k, 19662.9% for AGIs $100k-200k, 141152.0% for AGIs over 200k)
Taxable interest for individuals: $850 (reported on 16.2% of returns)
This zip code:
$850
Michigan:
$1,630
(% of AGI for various income ranges: 2.2% for AGIs below $25k, 1.4% for AGIs $25k-50k, 16.8% for AGIs $50k-75k, 11.4% for AGIs $75k-100k, 29.4% for AGIs $100k-200k, 880.0% for AGIs over 200k)
Ordinary dividends: $4,935 (reported on 11.5% of returns)
Here:
$4,935
State:
$6,972
(% of AGI for various income ranges: 8.2% for AGIs below $25k, 3.3% for AGIs $25k-50k, 15.6% for AGIs $50k-75k, 97.9% for AGIs $75k-100k, 139.4% for AGIs $100k-200k, 3850.0% for AGIs over 200k)
Net capital gain/loss in AGI: +$12,098 (reported on 10.6% of returns)
Here:
+$12,098
State:
+$20,064
(% of AGI for various income ranges: 5.3% for AGIs below $25k, 11.5% for AGIs $25k-50k, 60.9% for AGIs $50k-75k, 223.6% for AGIs $75k-100k, 404.1% for AGIs $100k-200k, 8556.0% for AGIs over 200k)
Profit/loss from business: +$4,892 (reported on 16.9% of returns)
Here:
+$4,892
State:
+$11,172
(% of AGI for various income ranges: 20.1% for AGIs below $25k, 50.7% for AGIs $25k-50k, 53.8% for AGIs $50k-75k, 283.6% for AGIs $75k-100k, 525.9% for AGIs $100k-200k, 2720.0% for AGIs over 200k)
Taxable individual retirement arrangement distribution: $25,812 (reported on 1.8% of returns)
48201:
$25,812
Michigan:
$19,803
(% of AGI for various income ranges: 11.4% for AGIs below $25k, 126.8% for AGIs $50k-75k, 852.9% for AGIs $100k-200k)
Total itemized deductions: $28,654 (reported on 6.3% of returns)
Here:
$28,654
State:
$34,117
(% of AGI for various income ranges: 64.3% for AGIs $25k-50k, 168.5% for AGIs $50k-75k, 540.7% for AGIs $75k-100k, 1331.2% for AGIs $100k-200k, 7562.0% for AGIs over 200k)
Charity contributions: $11,090 (reported on 4.7% of returns)
Here:
$11,090
State:
$13,548
(% of AGI for various income ranges: 6.6% for AGIs below $25k, 31.2% for AGIs $50k-75k, 65.7% for AGIs $75k-100k, 233.5% for AGIs $100k-200k, 3256.0% for AGIs over 200k)
Taxes paid: $8,311 (reported on 6.3% of returns)
48201:
$8,311
State:
$7,972
(% of AGI for various income ranges: 12.2% for AGIs $25k-50k, 60.0% for AGIs $50k-75k, 160.7% for AGIs $75k-100k, 542.4% for AGIs $100k-200k, 1706.0% for AGIs over 200k)
Earned income credit: $2,555 (reported on 27.5% of returns)
Here:
$2,555
State:
$2,251
(% of AGI for various income ranges: 133.9% for AGIs below $25k, 95.2% for AGIs $25k-50k)
Percentage of individuals using paid preparers for their 2020 taxes: 93.9%
Here:
94%
State:
93%
(% for various income ranges: 93.0% for AGIs below $25k, 95.0% for AGIs $25k-50k, 97.7% for AGIs $50k-75k, 95.2% for AGIs $75k-100k, 89.7% for AGIs $100k-200k, 93.8% for AGIs over 200k)
Averages for the 2012 tax year for zip code 48201, filed in 2013:
Average Adjusted Gross Income (AGI) in 2012: $31,598 (Individual Income Tax Returns)
Here:
$31,598
State:
$55,609
Salary/wage: $29,153 (reported on 83.4% of returns)
Here:
$29,153
State:
$46,782
(% of AGI for various income ranges: 76.9% for AGIs below $25k, 92.5% for AGIs $25k-50k, 87.5% for AGIs $50k-75k, 88.4% for AGIs $75k-100k, 83.0% for AGIs $100k-200k, 47.4% for AGIs over 200k)
Taxable interest for individuals: $1,386 (reported on 12.2% of returns)
This zip code:
$1,386
Michigan:
$1,491
(% of AGI for various income ranges: 0.2% for AGIs below $25k, 0.2% for AGIs $25k-50k, 0.2% for AGIs $75k-100k, 3.8% for AGIs $100k-200k)
Ordinary dividends: $2,155 (reported on 5.4% of returns)
Here:
$2,155
State:
$6,225
(% of AGI for various income ranges: 0.3% for AGIs $25k-50k, 0.3% for AGIs $50k-75k, 0.1% for AGIs $75k-100k, 2.0% for AGIs $100k-200k)
Net capital gain/loss in AGI: +$625 (reported on 3.9% of returns)
Here:
+$625
State:
+$9,326
(% of AGI for various income ranges: 0.1% for AGIs $50k-75k, 0.6% for AGIs $100k-200k)
Profit/loss from business: +$7,478 (reported on 19.1% of returns)
Here:
+$7,478
State:
+$11,523
(% of AGI for various income ranges: 13.9% for AGIs below $25k, 1.8% for AGIs $25k-50k, 1.9% for AGIs $50k-75k, 0.6% for AGIs $75k-100k, 4.0% for AGIs $100k-200k)
Taxable individual retirement arrangement distribution: $11,000 (reported on 1.7% of returns)
48201:
$11,000
Michigan:
$15,298
(% of AGI for various income ranges: 0.4% for AGIs below $25k, 0.8% for AGIs $25k-50k, 2.5% for AGIs $50k-75k)
Total itemized deductions: $19,125 (16% of AGI, reported on 10.8% of returns)
Here:
$19,125
State:
$21,628
Here:
16.4% of AGI
State:
18.4% of AGI
(% of AGI for various income ranges: 2.3% for AGIs below $25k, 4.6% for AGIs $25k-50k, 8.9% for AGIs $50k-75k, 13.3% for AGIs $75k-100k, 13.1% for AGIs $100k-200k, 5.7% for AGIs over 200k)
Charity contributions: $3,497 (reported on 8.6% of returns)
Here:
$3,497
State:
$4,225
(% of AGI for various income ranges: 0.2% for AGIs below $25k, 0.9% for AGIs $25k-50k, 1.4% for AGIs $50k-75k, 2.1% for AGIs $75k-100k, 1.9% for AGIs $100k-200k, 0.6% for AGIs over 200k)
Taxes paid: $8,052 (reported on 10.8% of returns)
48201:
$8,052
State:
$8,327
(% of AGI for various income ranges: 0.4% for AGIs below $25k, 1.2% for AGIs $25k-50k, 3.0% for AGIs $50k-75k, 4.8% for AGIs $75k-100k, 6.3% for AGIs $100k-200k, 4.1% for AGIs over 200k)
Earned income credit: $2,413 (reported on 38.6% of returns)
Here:
$2,413
State:
$2,306
(% of AGI for various income ranges: 11.1% for AGIs below $25k, 1.1% for AGIs $25k-50k)
Percentage of individuals using paid preparers for their 2012 taxes: 50.9%
Here:
51%
State:
57%
(% for various income ranges: 52.0% for AGIs below $25k, 48.1% for AGIs $25k-50k, 44.4% for AGIs $50k-75k, 53.8% for AGIs $75k-100k, 63.6% for AGIs $100k-200k)
Averages for the 2004 tax year for zip code 48201, filed in 2005:
Average Adjusted Gross Income (AGI) in 2004: $23,038 (Individual Income Tax Returns)
Here:
$23,038
State:
$48,204
Salary/wage: $21,647 (reported on 89.0% of returns)
Here:
$21,647
State:
$42,791
(% of AGI for various income ranges: 114.5% for AGIs below $10k, 88.2% for AGIs $10k-25k, 94.3% for AGIs $25k-50k, 91.9% for AGIs $50k-75k, 89.3% for AGIs $75k-100k, 45.7% for AGIs over 100k)
Taxable interest for individuals: $4,199 (reported on 15.1% of returns)
This zip code:
$4,199
Michigan:
$1,725
(% of AGI for various income ranges: 1.0% for AGIs below $10k, 0.3% for AGIs $10k-25k, 0.6% for AGIs $25k-50k, 0.4% for AGIs $50k-75k, 0.4% for AGIs $75k-100k, 12.0% for AGIs over 100k)
Taxable dividends: $968 (reported on 5.2% of returns)
Here:
$968
State:
$3,420
(% of AGI for various income ranges: 0.5% for AGIs below $10k, 0.0% for AGIs $10k-25k, 0.2% for AGIs $25k-50k, 0.2% for AGIs $50k-75k, 0.3% for AGIs $75k-100k, 0.3% for AGIs over 100k)
Net capital gain/loss: +$2,469 (reported on 3.6% of returns)
Here:
+$2,469
State:
+$8,532
(% of AGI for various income ranges: 0.1% for AGIs below $10k, -0.1% for AGIs $10k-25k, -0.2% for AGIs $25k-50k, -0.2% for AGIs $50k-75k, 0.0% for AGIs $75k-100k, 2.4% for AGIs over 100k)
Profit/loss from business: +$4,576 (reported on 10.1% of returns)
Here:
+$4,576
State:
+$9,547
(% of AGI for various income ranges: 12.5% for AGIs below $10k, 3.7% for AGIs $10k-25k, 0.7% for AGIs $25k-50k, -0.9% for AGIs $50k-75k, 1.3% for AGIs over 100k)
IRA payment deduction: $2,323 (reported on 0.9% of returns)
48201:
$2,323
Michigan:
$2,875
Total itemized deductions: $15,174 (23% of AGI, reported on 13.6% of returns)
Here:
$15,174
State:
$18,509
Here:
23.0% of AGI
State:
20.7% of AGI
(% of AGI for various income ranges: 6.0% for AGIs below $10k, 2.6% for AGIs $10k-25k, 6.5% for AGIs $25k-50k, 14.5% for AGIs $50k-75k, 16.9% for AGIs $75k-100k, 15.2% for AGIs over 100k)
Charity contributions deductions: $3,109 (4% of AGI, reported on 9.9% of returns)
Here:
$3,109
State:
$3,365
Here:
3.8% of AGI
State:
3.6% of AGI
(% of AGI for various income ranges: 0.4% for AGIs $10k-25k, 1.5% for AGIs $25k-50k, 2.3% for AGIs $50k-75k, 2.6% for AGIs $75k-100k, 1.5% for AGIs over 100k)
Total tax: $3,744 (reported on 53.2% of returns)
48201:
$3,744
State:
$7,691
(% of AGI for various income ranges: 2.7% for AGIs below $10k, 3.3% for AGIs $10k-25k, 7.1% for AGIs $25k-50k, 11.7% for AGIs $50k-75k, 13.0% for AGIs $75k-100k, 16.1% for AGIs over 100k)
Earned income credit: $1,831 (reported on 39.5% of returns)
Here:
$1,831
State:
$1,737
Percentage of individuals using paid preparers for their 2004 taxes: 57.3%
Here:
57%
State:
60%
(% for various income ranges: 54.6% for AGIs below $10k, 61.8% for AGIs $10k-25k, 53.6% for AGIs $25k-50k, 53.8% for AGIs $50k-75k, 55.4% for AGIs $75k-100k, 73.8% for AGIs over 100k)
Likely homosexual households (counted as self-reported same-sex unmarried-partner households)
Lesbian couples: 0.2% of all households
Gay men: 0.4% of all households
Household received Food Stamps/SNAP in the past 12 months: 3,231 Household did not receive Food Stamps/SNAP in the past 12 months: 4,719
Women who had a birth in the past 12 months: 151 (53 now married, 94 unmarried) Women who did not have a birth in the past 12 months: 3,609 (555 now married, 3,073 unmarried)
Housing units in zip code 48201 with a mortgage: 457 (30 second mortgage, 31 both second mortgage and home equity loan) Median monthly owner costs for units with a mortgage: $2,175 Median monthly owner costs for units without a mortgage: $824
Residents with income below the poverty level in 2022:
This zip code:
45.3%
Whole state:
13.4%
Residents with income below 50% of the poverty level in 2022:
This zip code:
26.4%
Whole state:
6.9%
Median number of rooms in houses and condos:
Here:
5.0
State:
6.5
Median number of rooms in apartments:
Here:
3.4
State:
4.3
Notable locations in this zip code not listed on our city pages
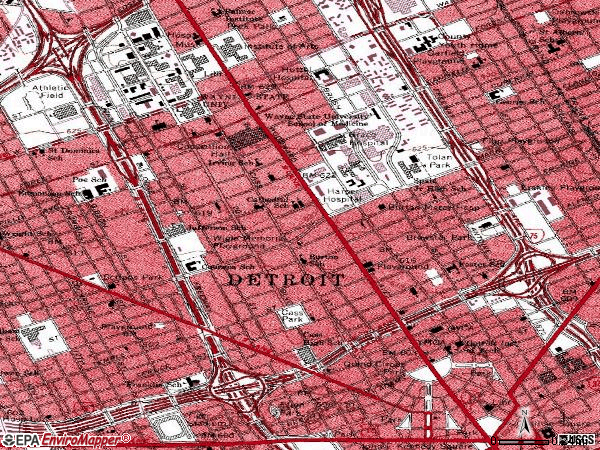
Notable locations in zip code 48201: The Fillmore Detroit (A), City of Detroit Fire Department Emergency Medical Services Medic 6 (B), University Health Care Center (C), Wertz Clinical Center Cancer Institute (D), Willis Warehouse (E), City of Detroit Fire Department Engine 1 (F), Harper Professional Building (G), Canfield Audio Visual Building (H), Precinct 13 Police Station (I), City of Detroit Fire Department Engine 5 Ladder 20 Squad 2 (J). Display/hide their locations on the map
Churches in zip code 48201 include: Cass Community United Methodist Church (A), Warren Avenue Missionary Baptist Church (B), Saint John's Episcopal Church of Detroit (C), Saint Patricks Parish (D), Hales Primitive Baptist Church (E), Cass Park Baptist Church (F). Display/hide their locations on the map
Parks in zip code 48201 include: Tolan Park (1), Wigle Memorial Playground (2), Brewster Park (3), Cass Park (4), American Academy of Pediatrics Historical Marker (5), Brewster Homes Historical Marker (6), Cass Community United Methodist Church Historical Marker (7), David Whitney Junior Residence Historical Marker (8), Detroit Medical College Historical Marker (9). Display/hide their locations on the map
Tourist attractions (not listed on the city page) : Conservation & Museum Services (Art Museums; 905 Henry St), Ecumenical Theological Seminary (Cultural Attractions- Events- & Facilities; 2930 Woodward Avenue).
307 married couples with children.
1,530 single-parent households (127 men, 1,403 women).
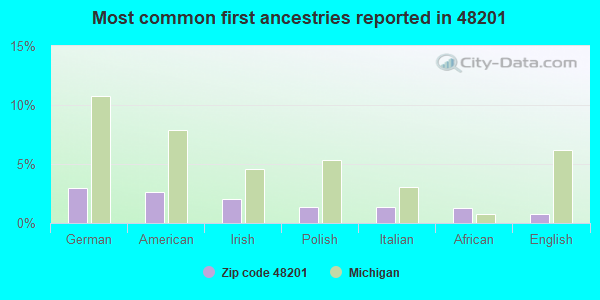
91.1% of residents of 48201 zip code speak English at home.
1.3% of residents speak Spanish at home (66% very well, 16% well, 4% not well, 14% not at all).
4.3% of residents speak other Indo-European language at home (78% very well, 11% well, 11% not well).
2.2% of residents speak Asian or Pacific Island language at home (58% very well, 39% well, 2% not well).
0.9% of residents speak other language at home (31% very well, 61% well, 8% not well).
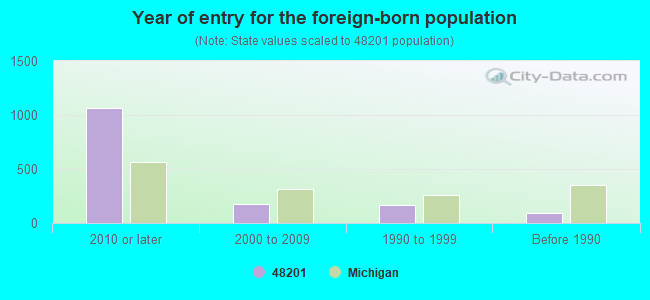
Foreign born population: 1,285 (9.0%) (18.8% of them are naturalized citizens)
Major facilities with environmental interests located in this zip code:
AMERICAN NATURAL RESOURCES BLD (1 WOODWARD AVE in DETROIT, MI)
(Integrated Compliance Information System) - ICIS-05-1992-0246, FORMAL ENFORCEMENT ACTION COMPLIANCE ACTIVITY (Tracking inspections of insecticide, fungicide, and rodenticide, and toxic substances) (Resource Conservation and Recovery Act (tracking hazardous waste)) Business SIC classification: NATURAL GAS TRANSMISSION Alternative names: ANR ONE WOODWARD CORP, ANR PIPELINE CO
EDMONSON ELEMENTARY SCHOOL (1300 W. CANFIELD STREET in DETROIT, MI)
(National Center for Education Statistics) - STATE ID-01087 Conditionally Exempt Small Quantity Generators, less than 100 kg/month of hazardous waste (Resource Conservation and Recovery Act (tracking hazardous waste)) Organizations: DETROIT PUBLIC SCHOOLS (CONTACT/OPERATOR)
, DETROIT CITY SCHOOL DISTRICT (SCHOOL DISTRICT)
Alternative names: EDMONSON ELEM SCHOOL
GOODYEAR AUTO SERVICE CTR 6537 (13955 TELEGRAPH in DETROIT, MI)
(Integrated Compliance Information System) - ICIS-05-2001-0534, FORMAL ENFORCEMENT ACTION Conditionally Exempt Small Quantity Generators, less than 100 kg/month of hazardous waste (Resource Conservation and Recovery Act (tracking hazardous waste)) Business SIC classification: AUTOMOTIVE REPAIR SHOPS Business NAICS classification: GENERAL AUTOMOTIVE REPAIR. Organizations: GOODYEAR TIRE AND REPAIR CO (CONTACT/OPERATOR)
CHEMICAL INDUSTRIAL SERVICES (2616 CLIFFORD ST in DETROIT, MI)
(Integrated Compliance Information System) - ICIS-05-1987-0520, FORMAL ENFORCEMENT ACTION COMPLIANCE ACTIVITY (Tracking inspections of insecticide, fungicide, and rodenticide, and toxic substances) Business SIC classification: BUSINESS SERVICES
BLANCHE KELSO BRUCE ACADEMY-ELIOT CENTER (3500 JOHN R in DETROIT, MI)
(National Center for Education Statistics) - STATE ID-08942
DETROIT DAY SCHOOL FOR THE DEAF (4555 JOHN C. LODGE FREEWAY in DETROIT, MI)
(National Center for Education Statistics) - STATE ID-00908 Organizations: DETROIT CITY SCHOOL DISTRICT (SCHOOL DISTRICT)
DETROIT HS-FINE & PERFORMING ARTS (4333 ROSA PARKS BOULEVARD in DETROIT, MI)
(National Center for Education Statistics) - STATE ID-07794 Organizations: DETROIT CITY SCHOOL DISTRICT (SCHOOL DISTRICT)
DEWEY CENTER FOR URBAN EDUCATION (3550 LODGE SERVICE DRIVE in DETROIT, MI)
(National Center for Education Statistics) - STATE ID-01877 Organizations: DETROIT CITY SCHOOL DISTRICT (SCHOOL DISTRICT)
EDISON PUBLIC SCHOOL ACADEMY (950 SELDEN STREET in DETROIT, MI)
(National Center for Education Statistics) - STATE ID-08651
FOREST HUMBOLDT DUMPING (FOREST & HUMBOLDT in DETROIT, MI)
(Integrated Compliance Information System) - ICIS-05-1993-1482, FORMAL ENFORCEMENT ACTION
ALTA RACK CO (1015 SPRUCE in DETROIT, MI)
(Resource Conservation and Recovery Act (tracking hazardous waste)) TRI REPORTER (Tracking of toxic chemicals releasing facilities) Business SIC classification: FABRICATED METAL PRODUCTS Organizations: JOAN C KING (CONTACT/OWNER)
DETROIT HOUSING COMMISSION (3511 JOHN C LODGE in DETROIT, MI)
HAZARDOUS WASTE BIENNIAL REPORTER (Resource Conservation and Recovery Act (tracking hazardous waste)) (Resource Conservation and Recovery Act (tracking hazardous waste)) Organizations: CITY OF DETROIT HOUSING DEPT (CONTACT/OWNER)
Alternative names: JEFFRIES HOMES
DIFCO LABORATORIES INCORPORATED (920 HENRY ST. in DETROIT, MI)
COMPLIANCE ACTIVITY (Tracking inspections of insecticide, fungicide, and rodenticide, and toxic substances) HAZARDOUS WASTE BIENNIAL REPORTER (Resource Conservation and Recovery Act (tracking hazardous waste)) Small Quantity Generators, between 100 kg and 1000 kg of hazardous waste/month (Resource Conservation and Recovery Act (tracking hazardous waste)) - notification TRI REPORTER (Tracking of toxic chemicals releasing facilities) Business SIC classification: IN VITRO AND IN VIVO DIAGNOSTIC SUBSTANCES Organizations: DIFCO LAB INC (CONTACT/OPERATOR)
Housing units lacking complete plumbing facilities: 6.6% Housing units lacking complete kitchen facilities: 7.1%
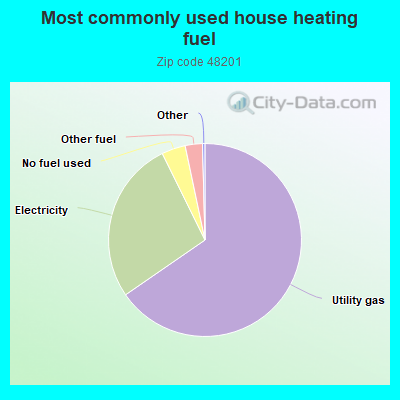
65.4%Utility gas
27.3%Electricity
4.0%No fuel used
2.9%Other fuel
Population in 1990: 15,920.
Place of birth for U.S.-born residents:
This state: 10,094
Northeast: 335
Midwest: 581
South: 1,499
West: 326
42% of the 48201 zip code residents lived in the same house 5 years ago. Out of people who lived in different houses, 78% lived in this county. Out of people who lived in different counties, 50% lived in Michigan.
81% of the 48201 zip code residents lived in the same house 1 year ago. Out of people who lived in different houses, 55% moved from this county. Out of people who lived in different houses, 20% moved from different county within same state. Out of people who lived in different houses, 18% moved from different state. Out of people who lived in different houses, 6% moved from abroad.
Private vs. public school enrollment:
Students in private schools in grades 1 to 8 (elementary and middle school): 65
Here:
7.4%
Michigan:
12.4%
Students in private schools in grades 9 to 12 (high school): 8
Here:
2.5%
Michigan:
9.8%
Students in private undergraduate colleges: 177
Here:
15.1%
Michigan:
14.9%
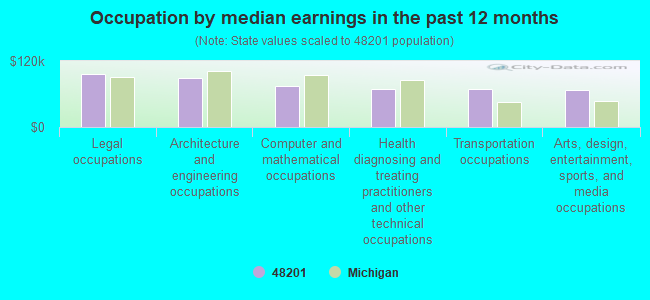
Occupation by median earnings in the past 12 months ($)
96,989Legal occupations
88,706Architecture and engineering occupations
74,961Computer and mathematical occupations
68,808Health diagnosing and treating practitioners and other technical occupations
68,467Transportation occupations
67,611Arts, design, entertainment, sports, and media occupations
Companies with federal contracts located in this zip code:
VERONICA CARTER (14406 FENTON in DETROIT, MI; small business) : $61,200 in 2 contractsin 2003
$31,200 with National Institutes of Health for Scientific Data Studies. Signed on 2003-10-23. Completion date: 2004-09-30.
$30,000, same as above.Signed on 2003-01-15. Completion date: 2003-09-15.
JJ & ASSOCIATES, INC. (2727 SECOND AVE. SUITE 141 in DETROIT, MI; small business)
$50,000 with Army for Other Professional Services. Signed on 2000-08-14. Completion date: 2001-09-30.
Top industries in this zip code by the number of employees in 2005:
Health Care and Social Assistance: General Medical and Surgical Hospitals (over 1000 employees: 4 establishments, 250-499 employees: 1 establishment)
Management of Companies and Enterprises: Corporate, Subsidiary, and Regional Managing Offices (over 1000: 1, 50-99: 1, 20-49: 2, 10-19: 1, 5-9: 6, 1-4: 1)
Health Care and Social Assistance: Offices of Physicians (except Mental Health Specialists) (250-499: 1, 100-249: 3, 50-99: 1, 20-49: 10, 10-19: 7, 5-9: 9, 1-4: 23)
Health Care and Social Assistance: Blood and Organ Banks (500-999: 1)
Health Care and Social Assistance: Other Individual and Family Services (250-499: 1, 20-49: 2, 10-19: 4, 1-4: 4)
Other Services (except Public Administration): Labor Unions and Similar Labor Organizations (250-499: 1, 50-99: 1, 10-19: 1, 5-9: 2, 1-4: 1)
2002 - 2018 National Fire Incident Reporting System (NFIRS) incidents
Based on the data from the years 2002 - 2018 the average number of fire incidents per year is 87. The highest number of fires - 202 took place in 2010, and the least - 1 in 2007. The data has a growing trend.
When looking into fire subcategories, the most incidents belonged to: Structure Fires (53.9%), and Outside Fires (24.8%).
Fire incident types reported to NFIRS in Zip Code 48201
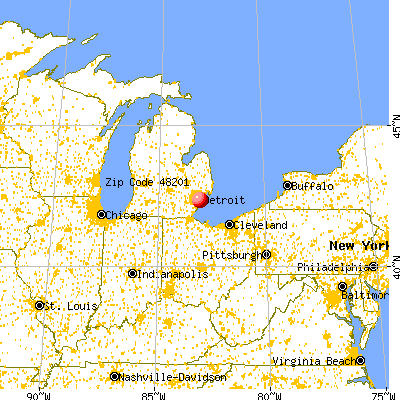


 Nearest zip codes: 48226, 48233, 48243, 48216, 48208, 48202.


 Based on the data from the years 2002 - 2018 the average number of fire incidents per year is 87. The highest number of fires - 202 took place in 2010, and the least - 1 in 2007. The data has a growing trend.
 When looking into fire subcategories, the most incidents belonged to: Structure Fires (53.9%), and Outside Fires (24.8%).