Estimated zip code population in 2022: 1,994 Zip code population in 2010: 2,231 Zip code population in 2000: 2,083
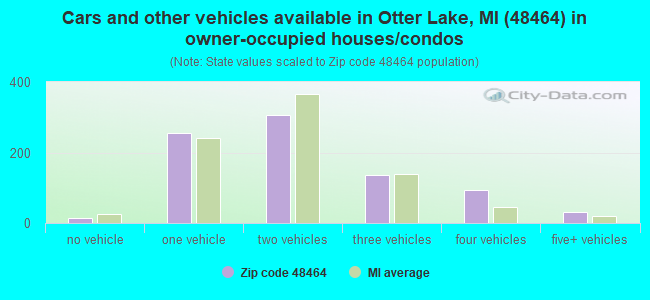
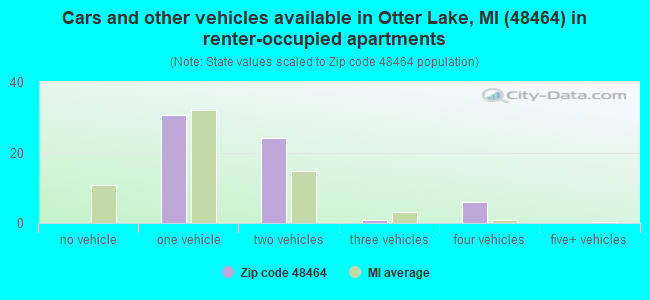
Houses and condos: 1,134 Renter-occupied apartments: 61
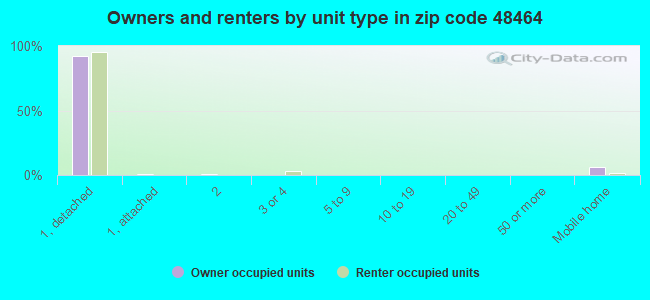
% of renters here:
7%
State:
27%
March 2022 cost of living index in zip code 48464: 91.8 (less than average, U.S. average is 100)
Land area: 18.5 sq. mi. Water area: 0.8 sq. mi.
Population density: 108 people per square mile
(very low).
OSM Map
General Map
Google Map
MSN Map
OSM Map
General Map
Google Map
MSN Map
OSM Map
General Map
Google Map
MSN Map
OSM Map
General Map
Google Map
MSN Map
Please wait while loading the map...
Real estate property taxes paid for housing units in 2022:
This zip code:
1.2% ($2,054)
Michigan:
1.2% ($2,746)
Median real estate property taxes paid for housing units with mortgages in 2022: $2,177 (1.2%) Median real estate property taxes paid for housing units with no mortgage in 2022: $1,934 (1.2%)
Business Search- 14 Million verified businesses
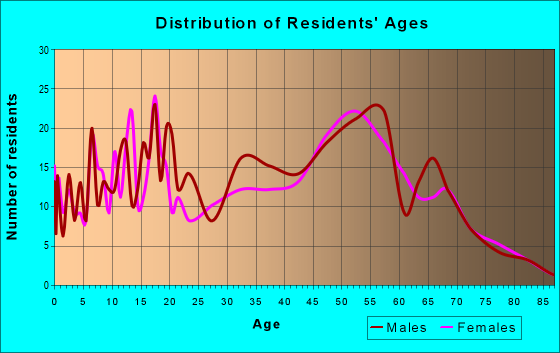
Males: 1,086
(54.5%)
Females: 907
(45.5%)
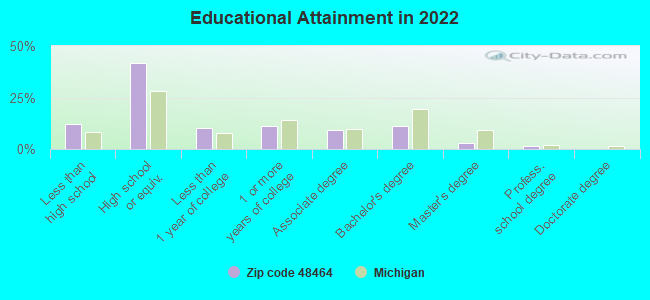
For population 25 years and over in 48464:
High school or higher: 86.9%
Bachelor's degree or higher: 15.7%
Graduate or professional degree: 4.8%
Unemployed: 5.2%
Mean travel time to work (commute): 40.5 minutes
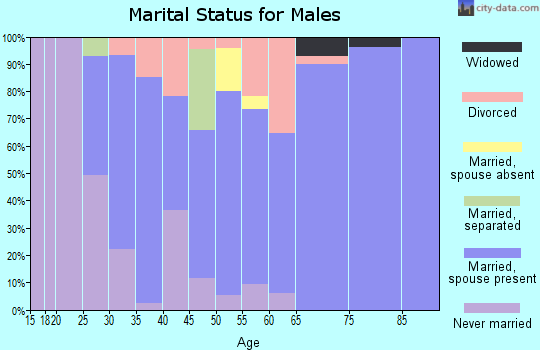
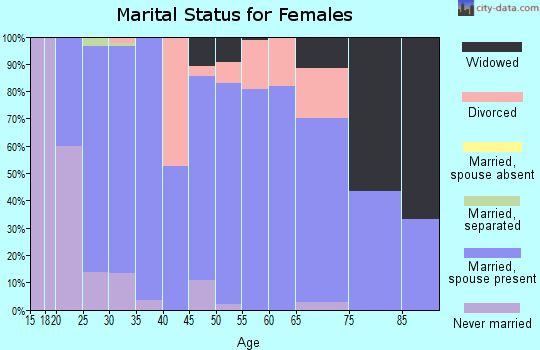
For population 15 years and over in 48464:
Never married: 18.8%
Now married: 58.7%
Separated: 0.6%
Widowed: 10.6%
Divorced: 11.3%
Zip code 48464 compared to state average:
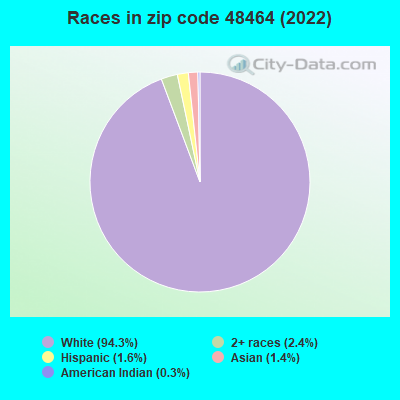
Black race population percentage significantly below state average.
Hispanic race population percentage significantly below state average.
Median age significantly above state average.
Foreign-born population percentage significantly below state average.
Renting percentage significantly below state average.
Length of stay since moving in significantly above state average.
Number of college students below state average.
Percentage of population with a bachelor's degree or higher below state average.
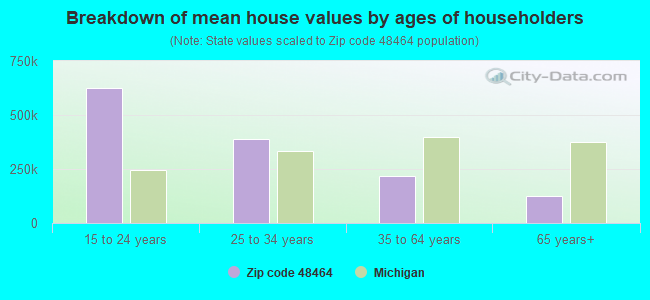
Estimated median house/condo value in 2022: $177,199
48464:
$177,199
Michigan:
$224,400
According to our research of Michigan and other state lists, there were 7 registered sex offenders living in 48464 zip code as of April 27, 2024. The ratio of all residents to sex offenders in zip code 48464 is 308 to 1. The ratio of registered sex offenders to all residents in this zip code is near the state average.
Median resident age:
This zip code:
55.8 years
Michigan median age:
40.3 years
Average household size:
This zip code:
2.2 people
Michigan:
2.4 people
Averages for the 2020 tax year for zip code 48464, filed in 2021:
Average Adjusted Gross Income (AGI) in 2020: $50,376 (Individual Income Tax Returns)
Here:
$50,376
State:
$68,945
Salary/wage: $46,253 (reported on 74.3% of returns)
Here:
$46,253
State:
$57,142
(% of AGI for various income ranges: 800.0% for AGIs below $25k, 2831.8% for AGIs $25k-50k, 5769.1% for AGIs $50k-75k, 9447.1% for AGIs $75k-100k, 16776.2% for AGIs $100k-200k)
Taxable interest for individuals: $425 (reported on 27.7% of returns)
This zip code:
$425
Michigan:
$1,630
(% of AGI for various income ranges: 11.5% for AGIs below $25k, 7.7% for AGIs $25k-50k, 19.1% for AGIs $50k-75k, 20.0% for AGIs $75k-100k, 46.2% for AGIs $100k-200k)
Ordinary dividends: $2,373 (reported on 10.9% of returns)
Here:
$2,373
State:
$6,972
(% of AGI for various income ranges: 11.5% for AGIs below $25k, 26.8% for AGIs $25k-50k, 27.1% for AGIs $75k-100k, 191.2% for AGIs $100k-200k)
Net capital gain/loss in AGI: +$2,580 (reported on 9.9% of returns)
Here:
+$2,580
State:
+$20,064
(% of AGI for various income ranges: 30.5% for AGIs $25k-50k, 52.7% for AGIs $50k-75k, 172.5% for AGIs $100k-200k)
Profit/loss from business: +$3,500 (reported on 13.9% of returns)
Here:
+$3,500
State:
+$11,172
(% of AGI for various income ranges: 72.3% for AGIs below $25k, 115.0% for AGIs $25k-50k, 11.8% for AGIs $50k-75k, 51.4% for AGIs $75k-100k)
Taxable individual retirement arrangement distribution: $9,362 (reported on 7.9% of returns)
48464:
$9,362
Michigan:
$19,803
(% of AGI for various income ranges: 56.2% for AGIs below $25k, 90.9% for AGIs $25k-50k, 575.7% for AGIs $75k-100k)
Total itemized deductions: $22,875 (reported on 4.0% of returns)
Here:
$22,875
State:
$34,117
(% of AGI for various income ranges: 1307.1% for AGIs $75k-100k)
Charity contributions: $5,800 (reported on 2.0% of returns)
Here:
$5,800
State:
$13,548
(% of AGI for various income ranges: 44.6% for AGIs below $25k)
Taxes paid: $7,367 (reported on 3.0% of returns)
48464:
$7,367
State:
$7,972
(% of AGI for various income ranges: 200.9% for AGIs $50k-75k)
Earned income credit: $2,080 (reported on 14.9% of returns)
Here:
$2,080
State:
$2,251
(% of AGI for various income ranges: 71.5% for AGIs below $25k, 57.3% for AGIs $25k-50k)
Percentage of individuals using paid preparers for their 2020 taxes: 94.1%
Here:
94%
State:
93%
(% for various income ranges: 91.9% for AGIs below $25k, 96.3% for AGIs $25k-50k, 92.9% for AGIs $50k-75k, 100.0% for AGIs $75k-100k, 92.3% for AGIs $100k-200k)
Averages for the 2012 tax year for zip code 48464, filed in 2013:
Average Adjusted Gross Income (AGI) in 2012: $40,456 (Individual Income Tax Returns)
Here:
$40,456
State:
$55,609
Salary/wage: $32,847 (reported on 87.1% of returns)
Here:
$32,847
State:
$46,782
(% of AGI for various income ranges: 59.3% for AGIs below $25k, 65.0% for AGIs $25k-50k, 71.4% for AGIs $50k-75k, 83.2% for AGIs $75k-100k, 69.7% for AGIs $100k-200k)
Taxable interest for individuals: $396 (reported on 29.0% of returns)
This zip code:
$396
Michigan:
$1,491
(% of AGI for various income ranges: 0.7% for AGIs below $25k, 0.3% for AGIs $25k-50k, 0.2% for AGIs $50k-75k, 0.4% for AGIs $100k-200k)
Ordinary dividends: $1,589 (reported on 9.7% of returns)
Here:
$1,589
State:
$6,225
(% of AGI for various income ranges: 0.7% for AGIs below $25k, 0.3% for AGIs $25k-50k, 0.4% for AGIs $50k-75k, 0.6% for AGIs $75k-100k)
Profit/loss from business: +$3,258 (reported on 12.9% of returns)
Here:
+$3,258
State:
+$11,523
(% of AGI for various income ranges: 5.1% for AGIs below $25k, 1.4% for AGIs $25k-50k, 0.6% for AGIs $75k-100k)
Taxable individual retirement arrangement distribution: $8,678 (reported on 9.7% of returns)
48464:
$8,678
Michigan:
$15,298
(% of AGI for various income ranges: 2.0% for AGIs below $25k, 2.0% for AGIs $25k-50k, 5.8% for AGIs $50k-75k)
Total itemized deductions: $17,277 (23% of AGI, reported on 23.7% of returns)
Here:
$17,277
State:
$21,628
Here:
23.5% of AGI
State:
18.4% of AGI
(% of AGI for various income ranges: 6.0% for AGIs below $25k, 8.2% for AGIs $25k-50k, 10.5% for AGIs $50k-75k, 11.4% for AGIs $75k-100k, 12.6% for AGIs $100k-200k)
Charity contributions: $2,106 (reported on 18.3% of returns)
Here:
$2,106
State:
$4,225
(% of AGI for various income ranges: 0.7% for AGIs $25k-50k, 1.1% for AGIs $50k-75k, 1.1% for AGIs $75k-100k, 1.5% for AGIs $100k-200k)
Taxes paid: $5,059 (reported on 23.7% of returns)
48464:
$5,059
State:
$8,327
(% of AGI for various income ranges: 1.6% for AGIs below $25k, 2.1% for AGIs $25k-50k, 2.9% for AGIs $50k-75k, 3.3% for AGIs $75k-100k, 4.3% for AGIs $100k-200k)
Earned income credit: $1,984 (reported on 20.4% of returns)
Here:
$1,984
State:
$2,306
(% of AGI for various income ranges: 6.2% for AGIs below $25k, 1.1% for AGIs $25k-50k)
Percentage of individuals using paid preparers for their 2012 taxes: 62.4%
Here:
62%
State:
57%
(% for various income ranges: 53.7% for AGIs below $25k, 59.1% for AGIs $25k-50k, 73.3% for AGIs $50k-75k, 77.8% for AGIs $75k-100k, 83.3% for AGIs $100k-200k)
Averages for the 2004 tax year for zip code 48464, filed in 2005:
Average Adjusted Gross Income (AGI) in 2004: $38,778 (Individual Income Tax Returns)
Here:
$38,778
State:
$48,204
Salary/wage: $35,087 (reported on 89.1% of returns)
Here:
$35,087
State:
$42,791
(% of AGI for various income ranges: 112.3% for AGIs below $10k, 61.8% for AGIs $10k-25k, 75.0% for AGIs $25k-50k, 81.6% for AGIs $50k-75k, 88.8% for AGIs $75k-100k, 84.6% for AGIs over 100k)
Taxable interest for individuals: $815 (reported on 41.8% of returns)
This zip code:
$815
Michigan:
$1,725
(% of AGI for various income ranges: 6.5% for AGIs below $10k, 2.1% for AGIs $10k-25k, 0.8% for AGIs $25k-50k, 0.8% for AGIs $50k-75k, 0.4% for AGIs $75k-100k, 0.4% for AGIs over 100k)
Taxable dividends: $792 (reported on 16.4% of returns)
Here:
$792
State:
$3,420
(% of AGI for various income ranges: 0.6% for AGIs below $10k, 1.2% for AGIs $10k-25k, 0.1% for AGIs $25k-50k, 0.2% for AGIs $50k-75k, 0.6% for AGIs $75k-100k, 0.1% for AGIs over 100k)
Net capital gain/loss: +$2,529 (reported on 10.0% of returns)
Here:
+$2,529
State:
+$8,532
(% of AGI for various income ranges: 0.0% for AGIs below $10k, 0.5% for AGIs $10k-25k, 0.4% for AGIs $25k-50k, 1.2% for AGIs $50k-75k, -0.0% for AGIs $75k-100k, 1.1% for AGIs over 100k)
Profit/loss from business: +$3,296 (reported on 13.9% of returns)
Here:
+$3,296
State:
+$9,547
(% of AGI for various income ranges: 7.3% for AGIs below $10k, 6.2% for AGIs $10k-25k, 2.7% for AGIs $25k-50k, -0.1% for AGIs $50k-75k, -0.6% for AGIs $75k-100k)
Total itemized deductions: $16,129 (25% of AGI, reported on 34.1% of returns)
Here:
$16,129
State:
$18,509
Here:
24.9% of AGI
State:
20.7% of AGI
(% of AGI for various income ranges: 7.9% for AGIs $10k-25k, 13.2% for AGIs $25k-50k, 15.2% for AGIs $50k-75k, 13.3% for AGIs $75k-100k, 20.2% for AGIs over 100k)
Charity contributions deductions: $1,905 (3% of AGI, reported on 27.9% of returns)
Here:
$1,905
State:
$3,365
Here:
2.8% of AGI
State:
3.6% of AGI
(% of AGI for various income ranges: 0.5% for AGIs $10k-25k, 1.0% for AGIs $25k-50k, 1.2% for AGIs $50k-75k, 1.7% for AGIs $75k-100k, 2.5% for AGIs over 100k)
Total tax: $4,325 (reported on 74.1% of returns)
48464:
$4,325
State:
$7,691
(% of AGI for various income ranges: 2.3% for AGIs below $10k, 3.8% for AGIs $10k-25k, 5.6% for AGIs $25k-50k, 8.3% for AGIs $50k-75k, 10.2% for AGIs $75k-100k, 12.9% for AGIs over 100k)
Earned income credit: $1,690 (reported on 15.2% of returns)
Here:
$1,690
State:
$1,737
Percentage of individuals using paid preparers for their 2004 taxes: 69.9%
Here:
70%
State:
60%
(% for various income ranges: 57.8% for AGIs below $10k, 69.2% for AGIs $10k-25k, 68.9% for AGIs $25k-50k, 77.0% for AGIs $50k-75k, 77.7% for AGIs $75k-100k, 85.7% for AGIs over 100k)
Likely homosexual households (counted as self-reported same-sex unmarried-partner households)
Lesbian couples: 0.1% of all households
Gay men: 0.0% of all households
Household received Food Stamps/SNAP in the past 12 months: 130 Household did not receive Food Stamps/SNAP in the past 12 months: 764
Women who had a birth in the past 12 months: 23 (17 now married, 6 unmarried) Women who did not have a birth in the past 12 months: 250 (140 now married, 108 unmarried)
Housing units in zip code 48464 with a mortgage: 446 (9 second mortgage, 2 home equity loan, 6 both second mortgage and home equity loan) Median monthly owner costs for units with a mortgage: $1,236 Median monthly owner costs for units without a mortgage: $455
Residents with income below the poverty level in 2022:
This zip code:
10.1%
Whole state:
13.4%
Residents with income below 50% of the poverty level in 2022:
This zip code:
3.9%
Whole state:
6.9%
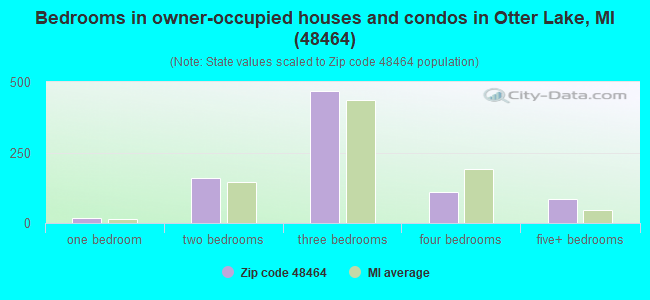
Median number of rooms in houses and condos:
Here:
6.2
State:
6.5
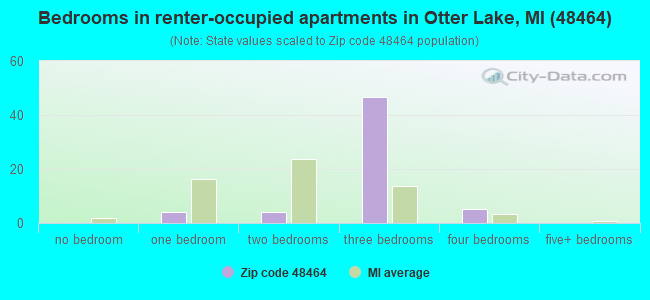
Median number of rooms in apartments:
Here:
6.4
State:
4.3
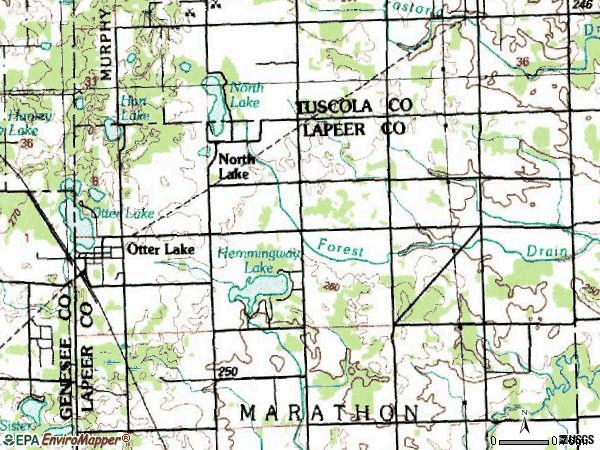
Notable locations in this zip code not listed on our city pages
Notable locations in zip code 48464: Otter Lake Village Campground (A), Genesee-Otter Lake Campground (B), Otter Lake Fire and Rescue (C), Otter Lake Branch Library (D), Village of Otter Lake Museum (E). Display/hide their locations on the map
Churches in zip code 48464 include: Church of Jesus Christ (A), Saint John's Episcopal Church (B), Otter Lake Seventh Day Church (C), Otter Lake United Methodist Church (D), Otter Lake Church of the Nazarene (E). Display/hide their locations on the map
Lakes and reservoirs: Otter Lake (A), North Lake (B), Mud Lake (C), Hemmingway Lake (D), Hart Lake (E), Lake Henson (F). Display/hide their locations on the map
In group quarters: 2 (-1 institutionalized population)
Size of family households: 416 2-persons, 129 3-persons, 53 4-persons, 31 5-persons, 10 6-persons, 14 7-or-more-persons
Size of nonfamily households: 223 1-person, 14 2-persons, 1 3-persons
121 married couples with children.
91 single-parent households (69 men, 22 women).
98.6% of residents of 48464 zip code speak English at home.
0.7% of residents speak other Indo-European language at home (100% very well).
1.3% of residents speak Asian or Pacific Island language at home (42% very well, 58% well).
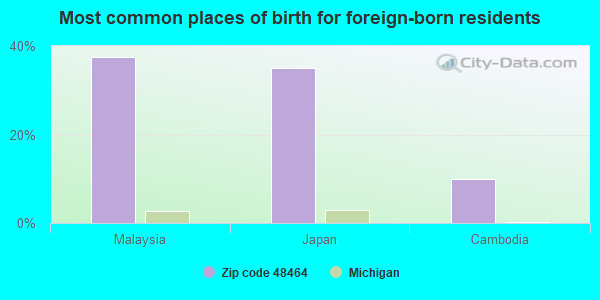
Foreign born population: 40 (2.0%) (73.5% of them are naturalized citizens)
This zip code:
2.0%
Whole state:
6.9%
38%Malaysia
35%Japan
10%Cambodia
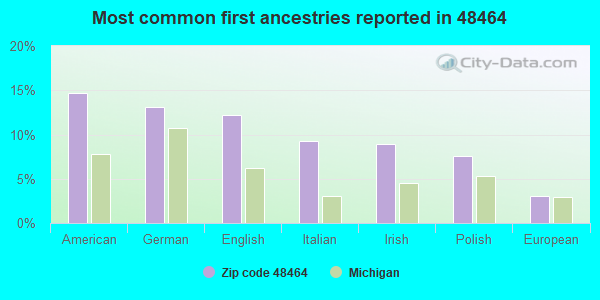
15%American
13%German
12%English
9%Italian
9%Irish
8%Polish
3%European
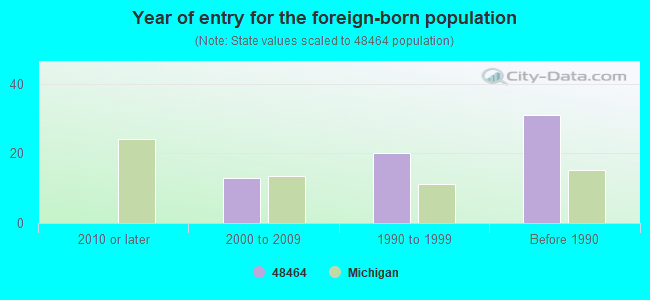
Year of entry for the foreign-born population
02010 or later
132000 to 2009
201990 to 1999
31Before 1990
Facilities with environmental interests located in this zip code:
FLEUR DAVID (13000 WASHBURN RD in OTTER LAKE, MI)
CRITERIA AND HAZARDOUS AIR POLLUTANT INVENTORY (Inventory of air pollution sources) Business SIC and NAICS classification: CRUDE PETROLEUM AND NATURAL GAS
Housing units lacking complete plumbing facilities: 2.0% Housing units lacking complete kitchen facilities: 2.0%
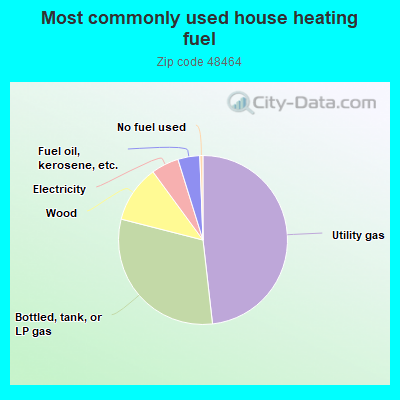
48.4%Utility gas
30.9%Bottled, tank, or LP gas
11.0%Wood
5.3%Electricity
4.2%Fuel oil, kerosene, etc.
0.6%No fuel used
Population in 1990: 2,442.
Place of birth for U.S.-born residents:
This state: 1,614
Northeast: 31
Midwest: 108
South: 125
West: 41
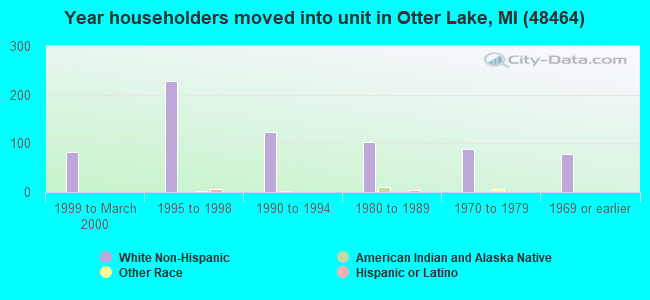
62% of the 48464 zip code residents lived in the same house 5 years ago. Out of people who lived in different houses, 29% lived in this county. Out of people who lived in different counties, 50% lived in Michigan.
96% of the 48464 zip code residents lived in the same house 1 year ago. Out of people who lived in different houses, 7% moved from this county. Out of people who lived in different houses, 93% moved from different county within same state. Out of people who lived in different houses, 5% moved from abroad.
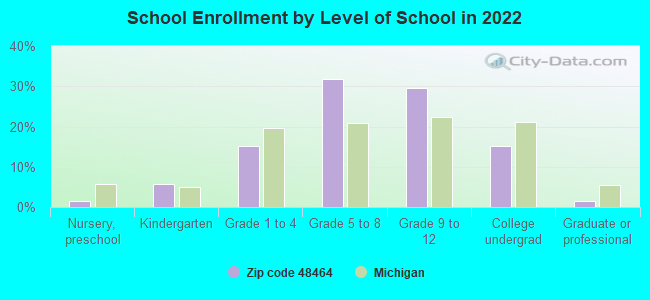
Private vs. public school enrollment:
Students in private schools in grades 1 to 8 (elementary and middle school): 24
Here:
17.7%
Michigan:
12.4%
Students in private schools in grades 9 to 12 (high school): 1
Here:
1.2%
Michigan:
9.8%
Students in private undergraduate colleges:
Here:
0.0%
Michigan:
14.9%
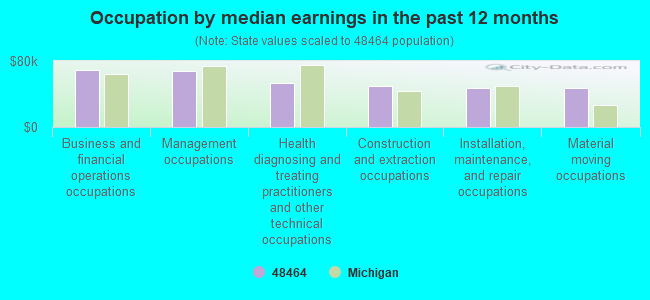
Occupation by median earnings in the past 12 months ($)
68,961Business and financial operations occupations
67,347Management occupations
53,655Health diagnosing and treating practitioners and other technical occupations
49,857Construction and extraction occupations
47,262Installation, maintenance, and repair occupations
47,094Material moving occupations
Top industries in this zip code by the number of employees in 2005:
Health Care and Social Assistance: Residential Mental Health and Substance Abuse Facilities (20-49 employees: 1 establishment)
Accommodation and Food Services: Drinking Places (Alcoholic Beverages) (5-9: 1)
Construction: Framing Contractors (5-9: 1)
Accommodation and Food Services: Limited-Service Restaurants (5-9: 1)
Construction: Residential Remodelers (1-4: 2)
Professional, Scientific, and Technical Services: Computer Systems Design Services (1-4: 1)
Other Services (except Public Administration): General Automotive Repair (1-4: 1)
Construction: Other Foundation, Structure, and Building Exterior Contractors (1-4: 1)
People in group quarters in 2010:
7 people in residential treatment centers for adults
People in group quarters in 2000:
35 people in homes or halfway houses for drug/alcohol abuse
Fatal accident statistics in 2011:
Fatal accident count: 2
Vehicles involved in fatal accidents: 3
Fatal accidents caused by drunken drivers: 0
Fatalities: 2
Persons involved in fatal accidents: 4
Pedestrians involved in fatal accidents: 0
Home Mortgage Disclosure Act Aggregated Statistics For Year 2009 (Based on 4 partial tracts)
A) FHA, FSA/RHS & VA Home Purchase Loans
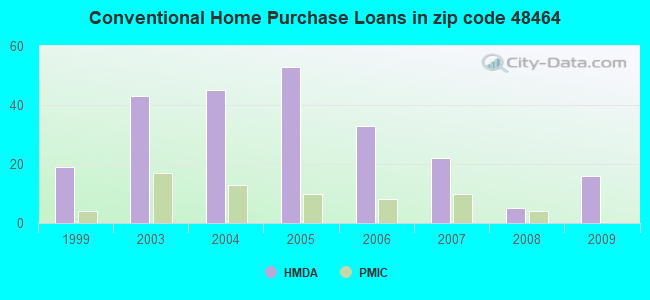
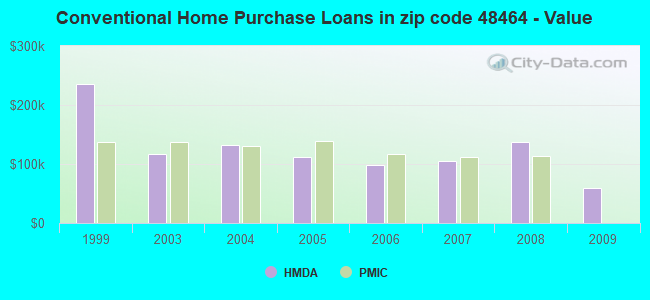
B) Conventional Home Purchase Loans
C) Refinancings
D) Home Improvement Loans
F) Non-occupant Loans on < 5 Family Dwellings (A B C & D)
G) Loans On Manufactured Home Dwelling (A B C & D)
Number
Average Value
Number
Average Value
Number
Average Value
Number
Average Value
Number
Average Value
Number
Average Value
LOANS ORIGINATED
8
$87,522
16
$58,609
54
$116,732
2
$17,240
12
$73,630
4
$81,868
APPLICATIONS APPROVED, NOT ACCEPTED
1
$123,860
0
$0
8
$117,399
0
$0
0
$0
1
$186,520
APPLICATIONS DENIED
5
$75,268
5
$28,152
21
$95,093
2
$5,075
2
$33,675
0
$0
APPLICATIONS WITHDRAWN
5
$99,498
0
$0
15
$111,665
0
$0
0
$0
0
$0
FILES CLOSED FOR INCOMPLETENESS
0
$0
0
$0
1
$66,860
0
$0
0
$0
0
$0
Aggregated Statistics For Year 2008 (Based on 4 partial tracts)
A) FHA, FSA/RHS & VA Home Purchase Loans
B) Conventional Home Purchase Loans
C) Refinancings
D) Home Improvement Loans
F) Non-occupant Loans on < 5 Family Dwellings (A B C & D)
G) Loans On Manufactured Home Dwelling (A B C & D)
Number
Average Value
Number
Average Value
Number
Average Value
Number
Average Value
Number
Average Value
Number
Average Value
LOANS ORIGINATED
13
$103,159
5
$137,876
50
$128,953
4
$76,730
2
$88,835
11
$89,550
APPLICATIONS APPROVED, NOT ACCEPTED
0
$0
1
$125,320
4
$154,578
3
$44,823
0
$0
0
$0
APPLICATIONS DENIED
5
$80,518
11
$84,447
28
$124,625
9
$40,961
5
$65,240
5
$76,282
APPLICATIONS WITHDRAWN
2
$127,245
1
$87,430
9
$133,727
0
$0
0
$0
0
$0
FILES CLOSED FOR INCOMPLETENESS
0
$0
0
$0
0
$0
0
$0
0
$0
0
$0
Aggregated Statistics For Year 2007 (Based on 4 partial tracts)
A) FHA, FSA/RHS & VA Home Purchase Loans
B) Conventional Home Purchase Loans
C) Refinancings
D) Home Improvement Loans
F) Non-occupant Loans on < 5 Family Dwellings (A B C & D)
G) Loans On Manufactured Home Dwelling (A B C & D)
Number
Average Value
Number
Average Value
Number
Average Value
Number
Average Value
Number
Average Value
Number
Average Value
LOANS ORIGINATED
7
$111,639
22
$105,010
66
$109,047
13
$53,558
8
$96,614
7
$111,693
APPLICATIONS APPROVED, NOT ACCEPTED
1
$141,350
2
$75,405
14
$108,134
0
$0
0
$0
1
$163,210
APPLICATIONS DENIED
0
$0
10
$68,773
78
$123,680
9
$76,454
6
$112,285
6
$117,302
APPLICATIONS WITHDRAWN
3
$69,960
3
$141,417
21
$110,238
2
$15,060
2
$51,960
0
$0
FILES CLOSED FOR INCOMPLETENESS
0
$0
2
$55,650
11
$133,604
0
$0
0
$0
0
$0
Aggregated Statistics For Year 2006 (Based on 4 partial tracts)
A) FHA, FSA/RHS & VA Home Purchase Loans
B) Conventional Home Purchase Loans
C) Refinancings
D) Home Improvement Loans
F) Non-occupant Loans on < 5 Family Dwellings (A B C & D)
G) Loans On Manufactured Home Dwelling (A B C & D)
Number
Average Value
Number
Average Value
Number
Average Value
Number
Average Value
Number
Average Value
Number
Average Value
LOANS ORIGINATED
7
$147,819
33
$98,535
106
$107,133
24
$59,705
11
$79,787
14
$104,683
APPLICATIONS APPROVED, NOT ACCEPTED
0
$0
12
$81,208
42
$97,585
2
$12,135
1
$102,000
3
$153,090
APPLICATIONS DENIED
0
$0
3
$51,763
90
$118,465
9
$75,252
4
$157,518
5
$87,206
APPLICATIONS WITHDRAWN
2
$65,380
7
$73,577
47
$124,587
1
$21,950
3
$78,037
0
$0
FILES CLOSED FOR INCOMPLETENESS
0
$0
2
$73,820
20
$114,277
0
$0
0
$0
0
$0
Aggregated Statistics For Year 2005 (Based on 4 partial tracts)
A) FHA, FSA/RHS & VA Home Purchase Loans
B) Conventional Home Purchase Loans
C) Refinancings
D) Home Improvement Loans
F) Non-occupant Loans on < 5 Family Dwellings (A B C & D)
G) Loans On Manufactured Home Dwelling (A B C & D)
Number
Average Value
Number
Average Value
Number
Average Value
Number
Average Value
Number
Average Value
Number
Average Value
LOANS ORIGINATED
9
$135,979
53
$112,707
132
$114,143
16
$51,632
17
$81,465
14
$88,129
APPLICATIONS APPROVED, NOT ACCEPTED
0
$0
4
$173,848
25
$99,196
1
$55,790
6
$89,748
0
$0
APPLICATIONS DENIED
2
$89,710
12
$91,148
112
$131,581
10
$74,268
8
$76,869
6
$146,043
APPLICATIONS WITHDRAWN
1
$192,350
5
$108,714
41
$133,924
10
$158,068
6
$185,150
3
$155,080
FILES CLOSED FOR INCOMPLETENESS
0
$0
2
$118,280
34
$119,551
0
$0
1
$72,860
3
$115,187
Aggregated Statistics For Year 2004 (Based on 4 partial tracts)
A) FHA, FSA/RHS & VA Home Purchase Loans
B) Conventional Home Purchase Loans
C) Refinancings
D) Home Improvement Loans
F) Non-occupant Loans on < 5 Family Dwellings (A B C & D)
G) Loans On Manufactured Home Dwelling (A B C & D)
Number
Average Value
Number
Average Value
Number
Average Value
Number
Average Value
Number
Average Value
Number
Average Value
LOANS ORIGINATED
10
$115,680
45
$131,628
149
$141,220
18
$58,972
15
$98,404
8
$86,106
APPLICATIONS APPROVED, NOT ACCEPTED
0
$0
9
$82,530
45
$119,492
2
$12,540
2
$139,220
5
$99,104
APPLICATIONS DENIED
2
$59,180
13
$113,949
108
$114,714
13
$45,442
4
$47,975
9
$115,482
APPLICATIONS WITHDRAWN
1
$70,890
8
$137,610
68
$116,768
2
$98,940
0
$0
1
$63,640
FILES CLOSED FOR INCOMPLETENESS
0
$0
1
$158,830
24
$115,687
0
$0
0
$0
0
$0
Aggregated Statistics For Year 2003 (Based on 4 partial tracts)
A) FHA, FSA/RHS & VA Home Purchase Loans
B) Conventional Home Purchase Loans
C) Refinancings
D) Home Improvement Loans
F) Non-occupant Loans on < 5 Family Dwellings (A B C & D)
Number
Average Value
Number
Average Value
Number
Average Value
Number
Average Value
Number
Average Value
LOANS ORIGINATED
5
$131,524
43
$116,574
245
$110,147
20
$20,005
12
$112,371
APPLICATIONS APPROVED, NOT ACCEPTED
2
$89,785
3
$130,127
24
$120,665
5
$16,612
0
$0
APPLICATIONS DENIED
0
$0
10
$94,310
125
$108,458
12
$24,550
6
$131,910
APPLICATIONS WITHDRAWN
2
$58,590
5
$66,334
76
$123,485
2
$60,215
2
$49,545
FILES CLOSED FOR INCOMPLETENESS
0
$0
2
$68,405
19
$101,772
0
$0
0
$0
Aggregated Statistics For Year 1999 (Based on 1 partial tract)
A) FHA, FSA/RHS & VA Home Purchase Loans
B) Conventional Home Purchase Loans
C) Refinancings
D) Home Improvement Loans
F) Non-occupant Loans on < 5 Family Dwellings (A B C & D)
Detailed PMIC statistics for the following Tracts:3310.00
, 3315.00
2002 - 2018 National Fire Incident Reporting System (NFIRS) incidents
Based on the data from the years 2002 - 2018 the average number of fire incidents per year is 9. The highest number of fires - 17 took place in 2003, and the least - 2 in 2011. The data has a growing trend.
When looking into fire subcategories, the most reports belonged to: Structure Fires (56.9%), and Outside Fires (25.5%).
Fire incident types reported to NFIRS in Zip Code 48464


 Nearest zip codes: 48435, 48421, 48463, 48746, 48744, 48446.


 Based on the data from the years 2002 - 2018 the average number of fire incidents per year is 9. The highest number of fires - 17 took place in 2003, and the least - 2 in 2011. The data has a growing trend.
 When looking into fire subcategories, the most reports belonged to: Structure Fires (56.9%), and Outside Fires (25.5%).