Estimated zip code population in 2022: 4,315 Zip code population in 2010: 4,615 Zip code population in 2000: 5,018
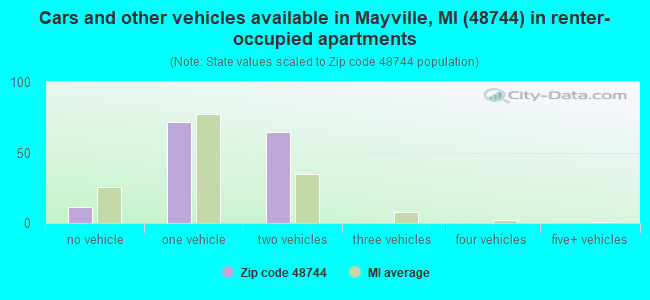
Houses and condos: 2,154 Renter-occupied apartments: 148
% of renters here:
8%
State:
27%
March 2022 cost of living index in zip code 48744: 81.1 (low, U.S. average is 100)
Land area: 64.7 sq. mi. Water area: 1.3 sq. mi.
Population density: 67 people per square mile
(very low).
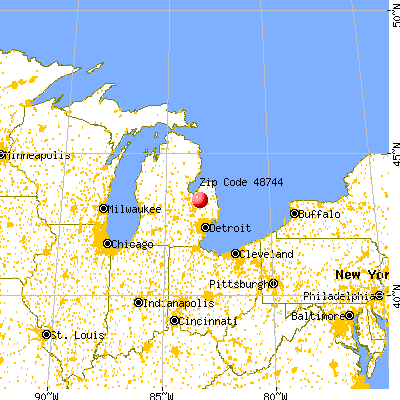
OSM Map
General Map
Google Map
MSN Map
OSM Map
General Map
Google Map
MSN Map
OSM Map
General Map
Google Map
MSN Map
OSM Map
General Map
Google Map
MSN Map
Please wait while loading the map...
Real estate property taxes paid for housing units in 2022:
This zip code:
1.1% ($1,569)
Michigan:
1.2% ($2,746)
Median real estate property taxes paid for housing units with mortgages in 2022: $1,680 (1.2%) Median real estate property taxes paid for housing units with no mortgage in 2022: $1,495 (1.0%)
Business Search- 14 Million verified businesses
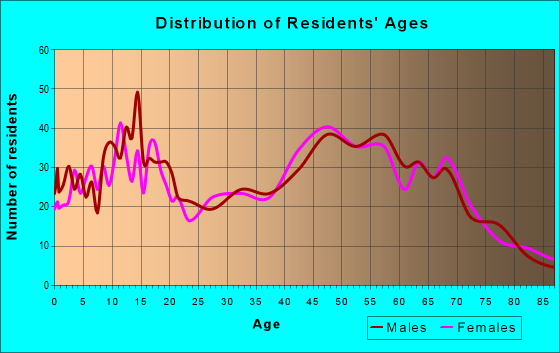
Males: 2,206
(51.1%)
Females: 2,109
(48.9%)
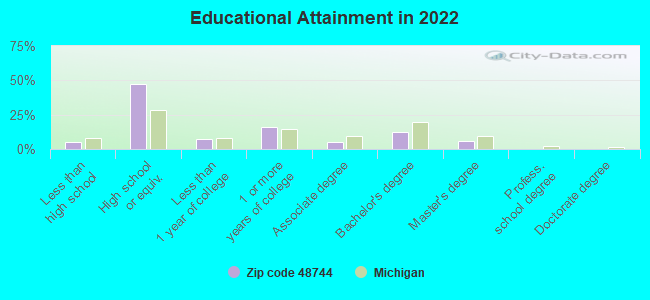
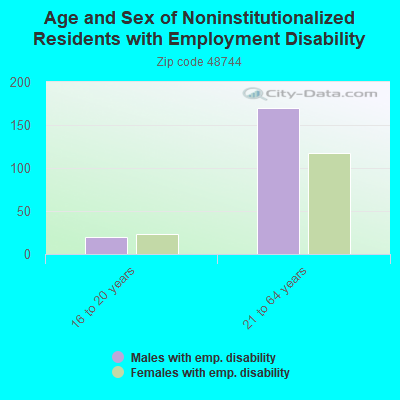
For population 25 years and over in 48744:
High school or higher: 94.1%
Bachelor's degree or higher: 19.2%
Graduate or professional degree: 6.5%
Unemployed: 4.1%
Mean travel time to work (commute): 40.3 minutes
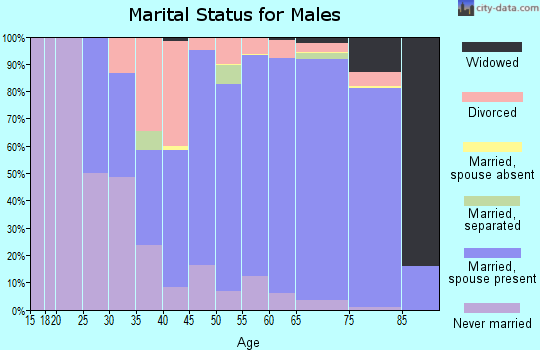
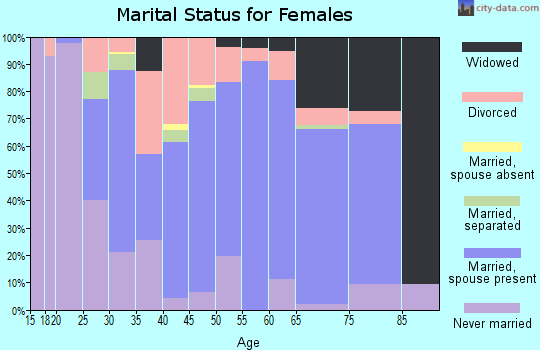
For population 15 years and over in 48744:
Never married: 22.9%
Now married: 55.3%
Separated: 4.1%
Widowed: 7.6%
Divorced: 10.2%
Zip code 48744 compared to state average:
Median house value below state average.
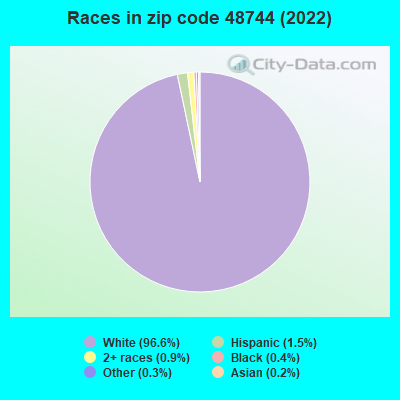
Black race population percentage significantly below state average.
Hispanic race population percentage significantly below state average.
Median age significantly above state average.
Foreign-born population percentage significantly below state average.
Renting percentage significantly below state average.
Length of stay since moving in significantly above state average.
Averages for the 2020 tax year for zip code 48744, filed in 2021:
Average Adjusted Gross Income (AGI) in 2020: $47,786 (Individual Income Tax Returns)
Here:
$47,786
State:
$68,945
Salary/wage: $41,768 (reported on 74.2% of returns)
Here:
$41,768
State:
$57,142
(% of AGI for various income ranges: 945.6% for AGIs below $25k, 2900.2% for AGIs $25k-50k, 5399.6% for AGIs $50k-75k, 8509.2% for AGIs $75k-100k, 16373.1% for AGIs $100k-200k)
Taxable interest for individuals: $840 (reported on 24.9% of returns)
This zip code:
$840
Michigan:
$1,630
(% of AGI for various income ranges: 10.6% for AGIs below $25k, 24.6% for AGIs $25k-50k, 27.7% for AGIs $50k-75k, 13.8% for AGIs $75k-100k, 134.6% for AGIs $100k-200k)
Ordinary dividends: $2,131 (reported on 12.2% of returns)
Here:
$2,131
State:
$6,972
(% of AGI for various income ranges: 13.0% for AGIs below $25k, 33.8% for AGIs $25k-50k, 31.2% for AGIs $50k-75k, 16.2% for AGIs $75k-100k, 163.8% for AGIs $100k-200k)
Net capital gain/loss in AGI: +$10,155 (reported on 10.3% of returns)
Here:
+$10,155
State:
+$20,064
(% of AGI for various income ranges: 11.9% for AGIs below $25k, 16.2% for AGIs $25k-50k, 97.7% for AGIs $50k-75k, 1411.5% for AGIs $100k-200k)
Profit/loss from business: +$6,980 (reported on 14.1% of returns)
Here:
+$6,980
State:
+$11,172
(% of AGI for various income ranges: 82.6% for AGIs below $25k, 74.4% for AGIs $25k-50k, 136.5% for AGIs $50k-75k, 14.6% for AGIs $75k-100k, 693.8% for AGIs $100k-200k)
Taxable individual retirement arrangement distribution: $11,239 (reported on 8.5% of returns)
48744:
$11,239
Michigan:
$19,803
(% of AGI for various income ranges: 46.9% for AGIs below $25k, 63.4% for AGIs $25k-50k, 109.6% for AGIs $50k-75k, 390.8% for AGIs $75k-100k, 507.7% for AGIs $100k-200k)
Total itemized deductions: $31,333 (reported on 1.4% of returns)
Here:
$31,333
State:
$34,117
(% of AGI for various income ranges: 361.5% for AGIs $50k-75k)
Charity contributions: $6,050 (reported on 0.9% of returns)
Here:
$6,050
State:
$13,548
(% of AGI for various income ranges: 24.2% for AGIs $25k-50k)
Taxes paid: $5,725 (reported on 1.9% of returns)
48744:
$5,725
State:
$7,972
(% of AGI for various income ranges: 176.2% for AGIs $75k-100k)
Earned income credit: $2,254 (reported on 16.4% of returns)
Here:
$2,254
State:
$2,251
(% of AGI for various income ranges: 72.8% for AGIs below $25k, 79.2% for AGIs $25k-50k)
Percentage of individuals using paid preparers for their 2020 taxes: 94.8%
Here:
95%
State:
93%
(% for various income ranges: 93.6% for AGIs below $25k, 95.1% for AGIs $25k-50k, 97.1% for AGIs $50k-75k, 94.4% for AGIs $75k-100k, 95.0% for AGIs $100k-200k, 100.0% for AGIs over 200k)
Averages for the 2012 tax year for zip code 48744, filed in 2013:
Average Adjusted Gross Income (AGI) in 2012: $39,449 (Individual Income Tax Returns)
Here:
$39,449
State:
$55,609
Salary/wage: $31,910 (reported on 81.7% of returns)
Here:
$31,910
State:
$46,782
(% of AGI for various income ranges: 59.3% for AGIs below $25k, 63.2% for AGIs $25k-50k, 66.3% for AGIs $50k-75k, 70.1% for AGIs $75k-100k, 70.5% for AGIs $100k-200k)
Taxable interest for individuals: $1,123 (reported on 30.2% of returns)
This zip code:
$1,123
Michigan:
$1,491
(% of AGI for various income ranges: 1.9% for AGIs below $25k, 1.0% for AGIs $25k-50k, 0.3% for AGIs $50k-75k, 1.0% for AGIs $75k-100k, 0.5% for AGIs $100k-200k)
Ordinary dividends: $1,603 (reported on 14.9% of returns)
Here:
$1,603
State:
$6,225
(% of AGI for various income ranges: 0.8% for AGIs below $25k, 0.8% for AGIs $25k-50k, 0.4% for AGIs $50k-75k, 0.6% for AGIs $75k-100k, 0.5% for AGIs $100k-200k)
Net capital gain/loss in AGI: +$1,619 (reported on 10.4% of returns)
Here:
+$1,619
State:
+$9,326
(% of AGI for various income ranges: 0.2% for AGIs $25k-50k, 0.4% for AGIs $50k-75k, 0.5% for AGIs $75k-100k, 1.3% for AGIs $100k-200k)
Profit/loss from business: +$9,457 (reported on 13.9% of returns)
Here:
+$9,457
State:
+$11,523
(% of AGI for various income ranges: 4.8% for AGIs below $25k, 3.9% for AGIs $25k-50k, 2.4% for AGIs $50k-75k, 6.8% for AGIs $75k-100k)
Taxable individual retirement arrangement distribution: $9,574 (reported on 9.4% of returns)
48744:
$9,574
Michigan:
$15,298
(% of AGI for various income ranges: 2.1% for AGIs below $25k, 2.2% for AGIs $25k-50k, 2.0% for AGIs $50k-75k, 5.8% for AGIs $75k-100k)
Total itemized deductions: $16,967 (26% of AGI, reported on 20.8% of returns)
Here:
$16,967
State:
$21,628
Here:
25.8% of AGI
State:
18.4% of AGI
(% of AGI for various income ranges: 7.0% for AGIs below $25k, 9.4% for AGIs $25k-50k, 8.1% for AGIs $50k-75k, 9.3% for AGIs $75k-100k, 10.4% for AGIs $100k-200k)
Charity contributions: $2,752 (reported on 15.3% of returns)
Here:
$2,752
State:
$4,225
(% of AGI for various income ranges: 0.4% for AGIs below $25k, 1.0% for AGIs $25k-50k, 0.9% for AGIs $50k-75k, 1.2% for AGIs $75k-100k, 1.6% for AGIs $100k-200k)
Taxes paid: $4,412 (reported on 20.8% of returns)
48744:
$4,412
State:
$8,327
(% of AGI for various income ranges: 1.0% for AGIs below $25k, 2.0% for AGIs $25k-50k, 1.9% for AGIs $50k-75k, 2.7% for AGIs $75k-100k, 3.8% for AGIs $100k-200k)
Earned income credit: $2,241 (reported on 19.3% of returns)
Here:
$2,241
State:
$2,306
(% of AGI for various income ranges: 5.3% for AGIs below $25k, 1.5% for AGIs $25k-50k)
Percentage of individuals using paid preparers for their 2012 taxes: 63.9%
Here:
64%
State:
57%
(% for various income ranges: 58.0% for AGIs below $25k, 67.3% for AGIs $25k-50k, 71.9% for AGIs $50k-75k, 66.7% for AGIs $75k-100k, 66.7% for AGIs $100k-200k)
Averages for the 2004 tax year for zip code 48744, filed in 2005:
Average Adjusted Gross Income (AGI) in 2004: $37,344 (Individual Income Tax Returns)
Here:
$37,344
State:
$48,204
Salary/wage: $32,393 (reported on 85.6% of returns)
Here:
$32,393
State:
$42,791
(% of AGI for various income ranges: 88.9% for AGIs below $10k, 64.1% for AGIs $10k-25k, 70.8% for AGIs $25k-50k, 79.8% for AGIs $50k-75k, 84.0% for AGIs $75k-100k, 65.7% for AGIs over 100k)
Taxable interest for individuals: $1,293 (reported on 45.9% of returns)
This zip code:
$1,293
Michigan:
$1,725
(% of AGI for various income ranges: 7.3% for AGIs below $10k, 3.7% for AGIs $10k-25k, 1.6% for AGIs $25k-50k, 1.0% for AGIs $50k-75k, 0.4% for AGIs $75k-100k, 1.6% for AGIs over 100k)
Taxable dividends: $1,671 (reported on 19.4% of returns)
Here:
$1,671
State:
$3,420
(% of AGI for various income ranges: 2.5% for AGIs below $10k, 1.4% for AGIs $10k-25k, 1.4% for AGIs $25k-50k, 0.6% for AGIs $50k-75k, 0.3% for AGIs $75k-100k, 0.5% for AGIs over 100k)
Net capital gain/loss: +$4,446 (reported on 12.4% of returns)
Here:
+$4,446
State:
+$8,532
(% of AGI for various income ranges: 2.3% for AGIs below $10k, 0.7% for AGIs $10k-25k, 1.0% for AGIs $25k-50k, 0.8% for AGIs $50k-75k, -0.1% for AGIs $75k-100k, 5.4% for AGIs over 100k)
Profit/loss from business: +$4,147 (reported on 15.5% of returns)
Here:
+$4,147
State:
+$9,547
(% of AGI for various income ranges: -8.5% for AGIs below $10k, 5.8% for AGIs $10k-25k, 1.1% for AGIs $25k-50k, 2.3% for AGIs $50k-75k, 0.9% for AGIs $75k-100k, 1.4% for AGIs over 100k)
IRA payment deduction: $2,511 (reported on 2.1% of returns)
48744:
$2,511
Michigan:
$2,875
Total itemized deductions: $15,195 (24% of AGI, reported on 31.3% of returns)
Here:
$15,195
State:
$18,509
Here:
24.3% of AGI
State:
20.7% of AGI
(% of AGI for various income ranges: 14.1% for AGIs below $10k, 9.4% for AGIs $10k-25k, 12.8% for AGIs $25k-50k, 13.8% for AGIs $50k-75k, 13.9% for AGIs $75k-100k, 11.7% for AGIs over 100k)
Charity contributions deductions: $2,372 (4% of AGI, reported on 26.3% of returns)
Here:
$2,372
State:
$3,365
Here:
3.7% of AGI
State:
3.6% of AGI
(% of AGI for various income ranges: 1.1% for AGIs $10k-25k, 1.7% for AGIs $25k-50k, 1.8% for AGIs $50k-75k, 2.2% for AGIs $75k-100k, 1.4% for AGIs over 100k)
Total tax: $4,202 (reported on 74.3% of returns)
48744:
$4,202
State:
$7,691
(% of AGI for various income ranges: 2.8% for AGIs below $10k, 3.9% for AGIs $10k-25k, 5.6% for AGIs $25k-50k, 8.0% for AGIs $50k-75k, 10.5% for AGIs $75k-100k, 14.7% for AGIs over 100k)
Earned income credit: $1,740 (reported on 15.4% of returns)
Here:
$1,740
State:
$1,737
Percentage of individuals using paid preparers for their 2004 taxes: 68.8%
Here:
69%
State:
60%
(% for various income ranges: 58.7% for AGIs below $10k, 70.0% for AGIs $10k-25k, 71.2% for AGIs $25k-50k, 73.5% for AGIs $50k-75k, 67.9% for AGIs $75k-100k, 78.5% for AGIs over 100k)
Likely homosexual households (counted as self-reported same-sex unmarried-partner households)
Lesbian couples: 0.2% of all households
Gay men: 0.0% of all households
Household received Food Stamps/SNAP in the past 12 months: 147 Household did not receive Food Stamps/SNAP in the past 12 months: 1,778
Women who had a birth in the past 12 months: 46 (39 now married, 8 unmarried) Women who did not have a birth in the past 12 months: 688 (314 now married, 373 unmarried)
Housing units in zip code 48744 with a mortgage: 908 (122 second mortgage, 65 both second mortgage and home equity loan) Houses without a mortgage: 13
Median monthly owner costs for units with a mortgage: $1,173 Median monthly owner costs for units without a mortgage: $479
Residents with income below the poverty level in 2022:
This zip code:
12.6%
Whole state:
13.4%
Residents with income below 50% of the poverty level in 2022:
This zip code:
4.9%
Whole state:
6.9%
Median number of rooms in houses and condos:
Here:
6.2
State:
6.5
Median number of rooms in apartments:
Here:
5.3
State:
4.3
Notable locations in this zip code not listed on our city pages
Notable locations in zip code 48744: Mayville Station (A), Greenbrier Golf Club (B), Juniata Station (C), Mayville Area Ambulance Service (D), Mayville District Public Library (E), Mayville Museum (F), Mayville Village Police Department (G), Mayville Fire Department (H). Display/hide their locations on the map
Churches in zip code 48744 include: Cass River Bible Church (A), Saint Joseph Church (B), Mayville United Methodist Church (C), Saint Paul Lutheran Church (D), Mills Memorial Baptist Church (E), Spring of Life Community Church (F), Pleasant View Free Methodist Church (G). Display/hide their locations on the map
In group quarters: 63 (-1 institutionalized population)
Size of family households: 718 2-persons, 180 3-persons, 113 4-persons, 142 5-persons, 33 6-persons
Size of nonfamily households: 647 1-person, 89 2-persons, 18 4-persons
423 married couples with children.
179 single-parent households (69 men, 110 women).
99.0% of residents of 48744 zip code speak English at home.
0.8% of residents speak Spanish at home (100% very well).
0.1% of residents speak Asian or Pacific Island language at home (100% very well).
0.5% of residents speak other language at home (47% very well, 53% not well).
Foreign born population: 24 (0.6%) (53.3% of them are naturalized citizens)
This zip code:
0.6%
Whole state:
6.9%
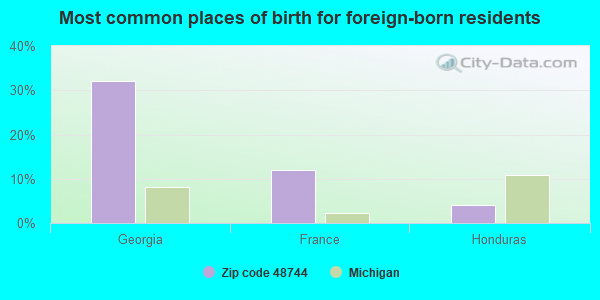
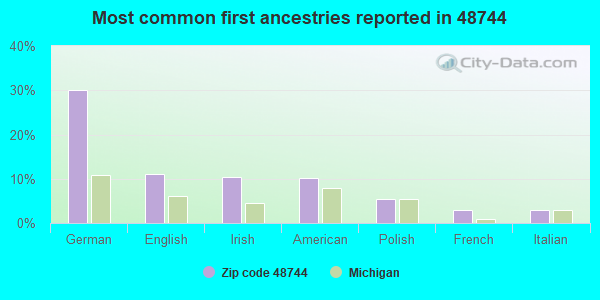
32%Georgia
12%France
4%Honduras
30%German
11%English
10%Irish
10%American
5%Polish
3%French
3%Italian
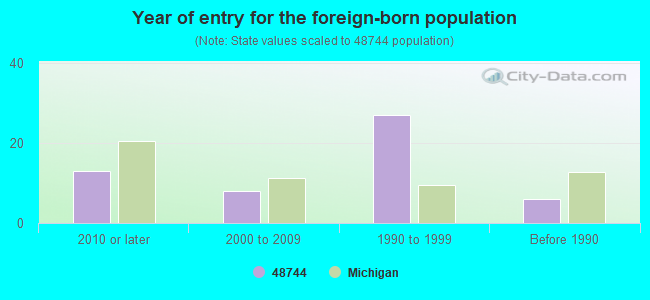
Year of entry for the foreign-born population
132010 or later
82000 to 2009
271990 to 1999
6Before 1990
Facilities with environmental interests located in this zip code:
MI DEPT/ENVIRONMENTAL QUALITY (HUNT RD 1/4 M W CEMETARY RD in MAYVILLE, MI)
(Resource Conservation and Recovery Act (tracking hazardous waste)) Alternative names: MI DEPT/DEQ
DETROIT EDISON COMPANY PUTNAM PEAKING UNIT (5660 MERTZ ROAD in MAYVILLE, MI)
Conditionally Exempt Small Quantity Generators, less than 100 kg/month of hazardous waste (Resource Conservation and Recovery Act (tracking hazardous waste)) - notification Business NAICS classification: FOSSIL FUEL ELECTRIC POWER GENERATION. Alternative names: PUTNAM PEAKERS
Housing units lacking complete plumbing facilities: 2.3% Housing units lacking complete kitchen facilities: 2.4%
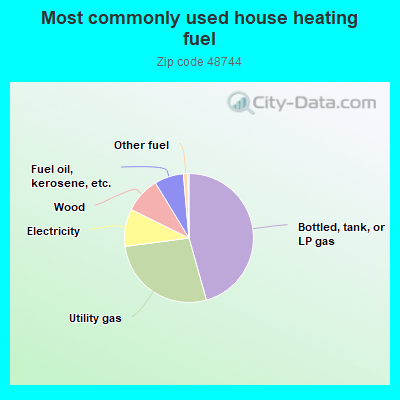
45.7%Bottled, tank, or LP gas
27.3%Utility gas
9.4%Electricity
9.0%Wood
7.3%Fuel oil, kerosene, etc.
1.1%Other fuel
Population in 1990: 4,271. Population change in the 1990s: +747 (+17.5%).
Place of birth for U.S.-born residents:
This state: 3,778
Northeast: 24
Midwest: 69
South: 271
West: 104
64% of the 48744 zip code residents lived in the same house 5 years ago. Out of people who lived in different houses, 46% lived in this county. Out of people who lived in different counties, 50% lived in Michigan.
93% of the 48744 zip code residents lived in the same house 1 year ago. Out of people who lived in different houses, 16% moved from this county. Out of people who lived in different houses, 64% moved from different county within same state. Out of people who lived in different houses, 23% moved from different state. Out of people who lived in different houses, 1% moved from abroad.
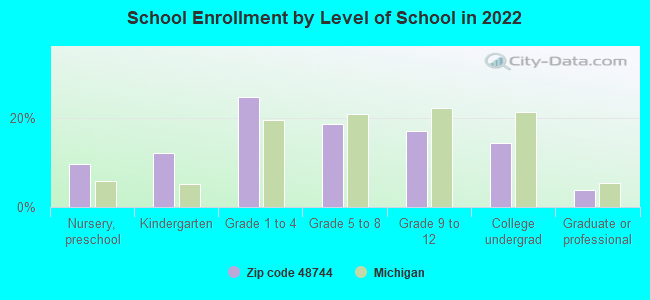
Private vs. public school enrollment:
Students in private schools in grades 1 to 8 (elementary and middle school): 20
Here:
7.1%
Michigan:
12.4%
Students in private schools in grades 9 to 12 (high school): 36
Here:
32.0%
Michigan:
9.8%
Students in private undergraduate colleges: 58
Here:
66.3%
Michigan:
14.9%
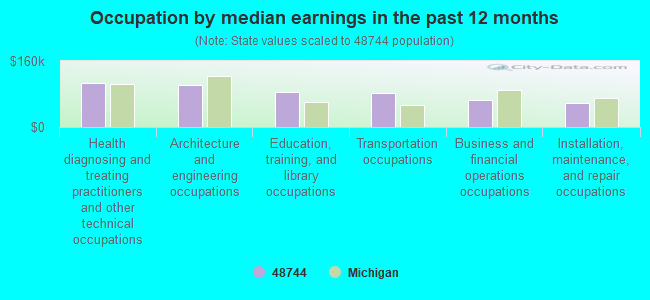
Occupation by median earnings in the past 12 months ($)
107,799Health diagnosing and treating practitioners and other technical occupations
101,910Architecture and engineering occupations
85,917Education, training, and library occupations
81,418Transportation occupations
66,058Business and financial operations occupations
58,603Installation, maintenance, and repair occupations
Top industries in this zip code by the number of employees in 2005:
Health Care and Social Assistance: Nursing Care Facilities (50-99 employees: 1 establishment)
Finance and Insurance: Commercial Banking (20-49: 1, 5-9: 1)
Accommodation and Food Services: Recreational and Vacation Camps (except Campgrounds) (20-49: 1)
Construction: New Single-Family Housing Construction (except Operative Builders) (5-9: 1, 1-4: 5)
Construction: Poured Concrete Foundation and Structure Contractors (5-9: 1, 1-4: 1)
Other Services (except Public Administration): Religious Organizations (1-4: 4)
Health Care and Social Assistance: All Other Outpatient Care Centers (5-9: 1)
Health Care and Social Assistance: Offices of Physicians (except Mental Health Specialists) (5-9: 1)
People in group quarters in 2010:
51 people in nursing facilities/skilled-nursing facilities
15 people in workers' group living quarters and job corps centers
8 people in group homes intended for adults
People in group quarters in 2000:
42 people in nursing homes
8 people in other noninstitutional group quarters
5 people in other group homes
2 people in homes for the mentally retarded
Fatal accident statistics in 2014:
Fatal accident count: 2
Vehicles involved in fatal accidents: 4
Fatal accidents caused by drunken drivers: 1
Fatalities: 3
Persons involved in fatal accidents: 4
Pedestrians involved in fatal accidents: 0
Fatal accident statistics in 2013:
Fatal accident count: 1
Vehicles involved in fatal accidents: 1
Fatal accidents caused by drunken drivers: 0
Fatalities: 1
Persons involved in fatal accidents: 1
Pedestrians involved in fatal accidents: 0
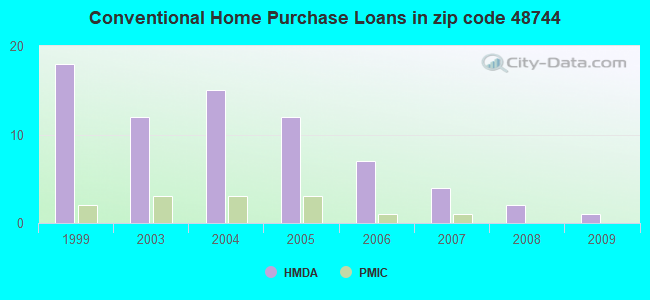
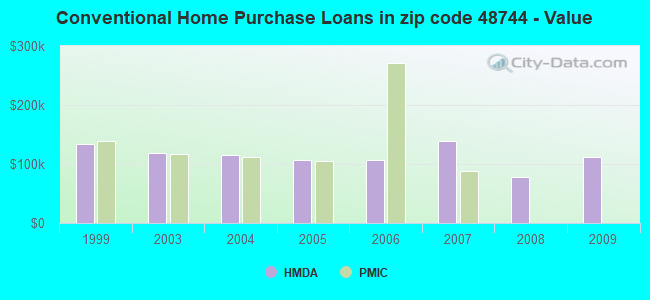
Home Mortgage Disclosure Act Aggregated Statistics For Year 2009 (Based on 2 partial tracts)
A) FHA, FSA/RHS & VA Home Purchase Loans
B) Conventional Home Purchase Loans
C) Refinancings
D) Home Improvement Loans
F) Non-occupant Loans on < 5 Family Dwellings (A B C & D)
G) Loans On Manufactured Home Dwelling (A B C & D)
Number
Average Value
Number
Average Value
Number
Average Value
Number
Average Value
Number
Average Value
Number
Average Value
LOANS ORIGINATED
3
$88,823
1
$111,300
11
$110,516
1
$17,900
1
$55,200
1
$92,500
APPLICATIONS APPROVED, NOT ACCEPTED
0
$0
0
$0
1
$155,470
0
$0
0
$0
0
$0
APPLICATIONS DENIED
1
$33,120
0
$0
7
$127,417
1
$18,200
0
$0
1
$68,630
APPLICATIONS WITHDRAWN
0
$0
0
$0
3
$130,500
0
$0
0
$0
1
$28,940
FILES CLOSED FOR INCOMPLETENESS
0
$0
0
$0
0
$0
0
$0
0
$0
0
$0
Aggregated Statistics For Year 2008 (Based on 2 partial tracts)
A) FHA, FSA/RHS & VA Home Purchase Loans
B) Conventional Home Purchase Loans
C) Refinancings
D) Home Improvement Loans
F) Non-occupant Loans on < 5 Family Dwellings (A B C & D)
G) Loans On Manufactured Home Dwelling (A B C & D)
Number
Average Value
Number
Average Value
Number
Average Value
Number
Average Value
Number
Average Value
Number
Average Value
LOANS ORIGINATED
4
$95,115
2
$77,435
10
$123,687
2
$30,140
1
$48,940
1
$102,950
APPLICATIONS APPROVED, NOT ACCEPTED
0
$0
0
$0
1
$159,050
0
$0
0
$0
0
$0
APPLICATIONS DENIED
1
$61,770
1
$68,040
11
$127,118
3
$50,530
0
$0
1
$43,270
APPLICATIONS WITHDRAWN
0
$0
0
$0
4
$139,278
0
$0
0
$0
1
$87,730
FILES CLOSED FOR INCOMPLETENESS
1
$100,260
0
$0
0
$0
0
$0
0
$0
0
$0
Aggregated Statistics For Year 2007 (Based on 2 partial tracts)
A) FHA, FSA/RHS & VA Home Purchase Loans
B) Conventional Home Purchase Loans
C) Refinancings
D) Home Improvement Loans
F) Non-occupant Loans on < 5 Family Dwellings (A B C & D)
G) Loans On Manufactured Home Dwelling (A B C & D)
Number
Average Value
Number
Average Value
Number
Average Value
Number
Average Value
Number
Average Value
Number
Average Value
LOANS ORIGINATED
2
$112,945
4
$139,578
16
$107,294
3
$48,240
1
$89,820
3
$81,263
APPLICATIONS APPROVED, NOT ACCEPTED
0
$0
0
$0
5
$114,944
1
$21,190
0
$0
0
$0
APPLICATIONS DENIED
0
$0
1
$281,690
19
$122,799
4
$43,865
1
$72,810
3
$118,663
APPLICATIONS WITHDRAWN
1
$95,790
1
$70,420
5
$111,662
1
$84,450
0
$0
1
$48,040
FILES CLOSED FOR INCOMPLETENESS
0
$0
1
$71,320
1
$100,860
0
$0
0
$0
0
$0
Aggregated Statistics For Year 2006 (Based on 2 partial tracts)
A) FHA, FSA/RHS & VA Home Purchase Loans
B) Conventional Home Purchase Loans
C) Refinancings
D) Home Improvement Loans
F) Non-occupant Loans on < 5 Family Dwellings (A B C & D)
G) Loans On Manufactured Home Dwelling (A B C & D)
Number
Average Value
Number
Average Value
Number
Average Value
Number
Average Value
Number
Average Value
Number
Average Value
LOANS ORIGINATED
2
$147,560
7
$106,529
19
$108,351
5
$32,406
2
$56,995
3
$81,860
APPLICATIONS APPROVED, NOT ACCEPTED
0
$0
1
$87,130
4
$106,155
1
$16,710
0
$0
1
$73,410
APPLICATIONS DENIED
0
$0
3
$95,290
24
$115,879
5
$43,506
1
$70,120
4
$85,192
APPLICATIONS WITHDRAWN
0
$0
1
$45,060
9
$129,771
1
$92,500
0
$0
1
$85,940
FILES CLOSED FOR INCOMPLETENESS
0
$0
1
$61,770
1
$172,770
0
$0
0
$0
0
$0
Aggregated Statistics For Year 2005 (Based on 2 partial tracts)
A) FHA, FSA/RHS & VA Home Purchase Loans
B) Conventional Home Purchase Loans
C) Refinancings
D) Home Improvement Loans
F) Non-occupant Loans on < 5 Family Dwellings (A B C & D)
G) Loans On Manufactured Home Dwelling (A B C & D)
Number
Average Value
Number
Average Value
Number
Average Value
Number
Average Value
Number
Average Value
Number
Average Value
LOANS ORIGINATED
2
$150,690
12
$107,324
24
$117,222
6
$35,212
4
$103,248
5
$81,284
APPLICATIONS APPROVED, NOT ACCEPTED
1
$127,420
1
$105,340
8
$142,486
1
$15,820
1
$125,330
1
$54,910
APPLICATIONS DENIED
0
$0
4
$94,295
19
$138,709
3
$93,597
0
$0
1
$120,260
APPLICATIONS WITHDRAWN
1
$69,230
2
$102,200
12
$136,592
1
$35,810
0
$0
0
$0
FILES CLOSED FOR INCOMPLETENESS
0
$0
0
$0
6
$137,165
0
$0
0
$0
0
$0
Aggregated Statistics For Year 2004 (Based on 2 partial tracts)
A) FHA, FSA/RHS & VA Home Purchase Loans
B) Conventional Home Purchase Loans
C) Refinancings
D) Home Improvement Loans
F) Non-occupant Loans on < 5 Family Dwellings (A B C & D)
G) Loans On Manufactured Home Dwelling (A B C & D)
Number
Average Value
Number
Average Value
Number
Average Value
Number
Average Value
Number
Average Value
Number
Average Value
LOANS ORIGINATED
2
$116,375
15
$115,680
30
$120,534
6
$40,333
2
$96,980
6
$91,658
APPLICATIONS APPROVED, NOT ACCEPTED
0
$0
2
$92,505
7
$125,499
1
$35,510
1
$72,810
1
$41,480
APPLICATIONS DENIED
0
$0
5
$104,978
21
$127,843
5
$55,562
1
$44,760
4
$93,100
APPLICATIONS WITHDRAWN
0
$0
1
$157,560
9
$140,314
0
$0
0
$0
1
$125,920
FILES CLOSED FOR INCOMPLETENESS
0
$0
1
$85,340
6
$141,342
0
$0
0
$0
1
$165,610
Aggregated Statistics For Year 2003 (Based on 2 partial tracts)
A) FHA, FSA/RHS & VA Home Purchase Loans
B) Conventional Home Purchase Loans
C) Refinancings
D) Home Improvement Loans
F) Non-occupant Loans on < 5 Family Dwellings (A B C & D)
Number
Average Value
Number
Average Value
Number
Average Value
Number
Average Value
Number
Average Value
LOANS ORIGINATED
2
$125,475
12
$118,390
55
$112,708
5
$26,976
4
$59,605
APPLICATIONS APPROVED, NOT ACCEPTED
0
$0
1
$106,830
10
$111,661
1
$19,990
0
$0
APPLICATIONS DENIED
0
$0
2
$108,915
21
$114,401
1
$24,770
0
$0
APPLICATIONS WITHDRAWN
1
$92,800
1
$44,760
8
$141,031
1
$30,140
0
$0
FILES CLOSED FOR INCOMPLETENESS
0
$0
0
$0
3
$132,987
0
$0
0
$0
Aggregated Statistics For Year 1999 (Based on 1 partial tract)
A) FHA, FSA/RHS & VA Home Purchase Loans
B) Conventional Home Purchase Loans
C) Refinancings
D) Home Improvement Loans
F) Non-occupant Loans on < 5 Family Dwellings (A B C & D)
Detailed PMIC statistics for the following Tracts:3305.00
2002 - 2018 National Fire Incident Reporting System (NFIRS) incidents
Based on the data from the years 2002 - 2018 the average number of fire incidents per year is 24. The highest number of reported fires - 51 took place in 2004, and the least - 2 in 2014. The data has a decreasing trend.
When looking into fire subcategories, the most incidents belonged to: Structure Fires (63.4%), and Outside Fires (22.4%).
Fire incident types reported to NFIRS in Zip Code 48744


 Nearest zip codes: 48435, 48760, 48723, 48464, 48741, 48727.


 Based on the data from the years 2002 - 2018 the average number of fire incidents per year is 24. The highest number of reported fires - 51 took place in 2004, and the least - 2 in 2014. The data has a decreasing trend.
 When looking into fire subcategories, the most incidents belonged to: Structure Fires (63.4%), and Outside Fires (22.4%).