Estimated zip code population in 2022: 7,488 Zip code population in 2010: 7,981 Zip code population in 2000: 8,150
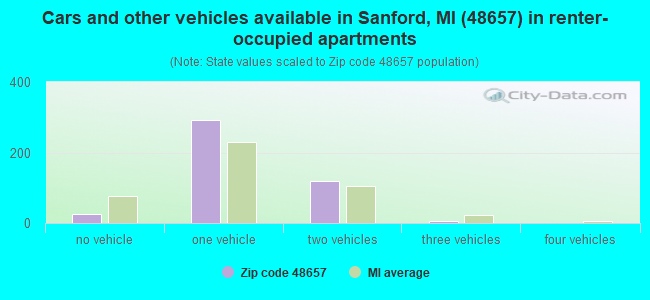
Houses and condos: 3,453 Renter-occupied apartments: 438
% of renters here:
14%
State:
27%
March 2022 cost of living index in zip code 48657: 81.3 (low, U.S. average is 100)
Land area: 61.8 sq. mi. Water area: 5.1 sq. mi.
Population density: 121 people per square mile
(very low).
OSM Map
General Map
Google Map
MSN Map
OSM Map
General Map
Google Map
MSN Map
OSM Map
General Map
Google Map
MSN Map
OSM Map
General Map
Google Map
MSN Map
Please wait while loading the map...
Real estate property taxes paid for housing units in 2022:
This zip code:
1.4% ($2,640)
Michigan:
1.2% ($2,746)
Median real estate property taxes paid for housing units with mortgages in 2022: $2,707 (1.4%) Median real estate property taxes paid for housing units with no mortgage in 2022: $2,551 (1.5%)
Business Search- 14 Million verified businesses
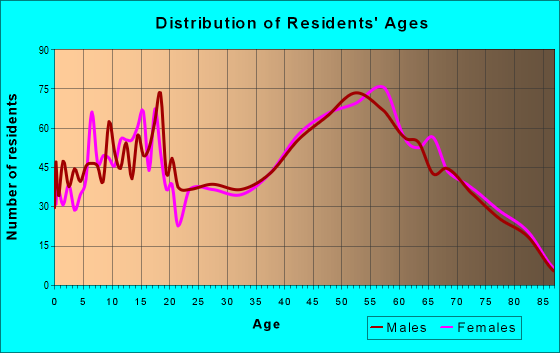
Males: 3,673
(49.1%)
Females: 3,815
(50.9%)
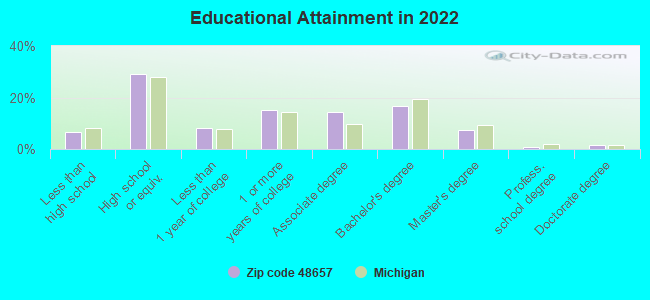
For population 25 years and over in 48657:
High school or higher: 92.9%
Bachelor's degree or higher: 26.2%
Graduate or professional degree: 9.6%
Unemployed: 3.2%
Mean travel time to work (commute): 29.4 minutes
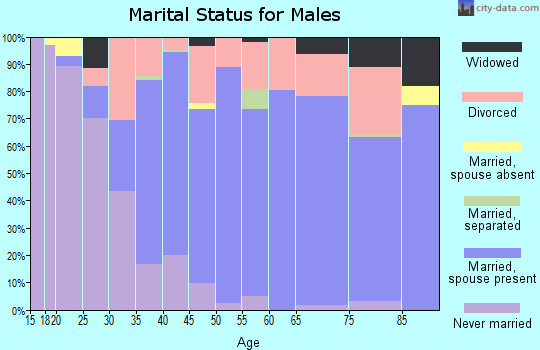
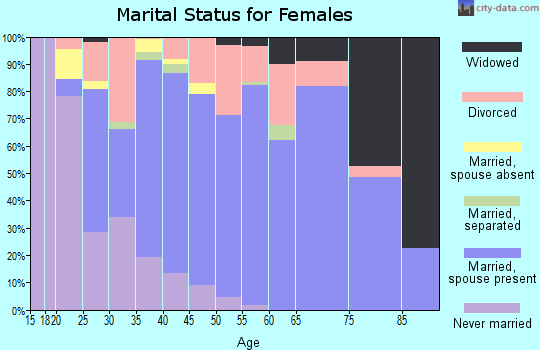
For population 15 years and over in 48657:
Never married: 20.8%
Now married: 60.7%
Separated: 1.3%
Widowed: 7.2%
Divorced: 10.1%
Zip code 48657 compared to state average:
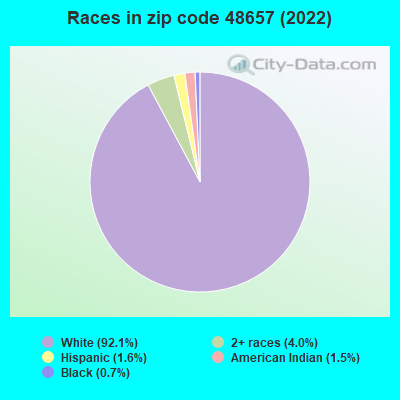
Black race population percentage significantly below state average.
Hispanic race population percentage significantly below state average.
Median age above state average.
Foreign-born population percentage significantly below state average.
Renting percentage below state average.
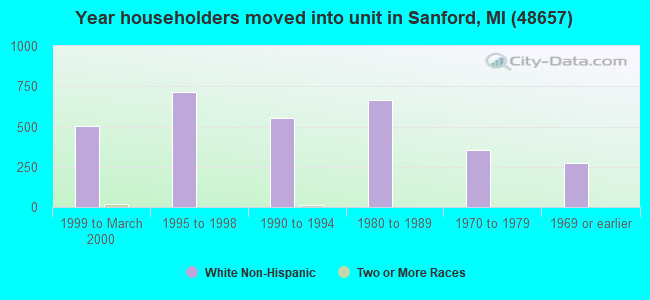
Length of stay since moving in above state average.
Averages for the 2020 tax year for zip code 48657, filed in 2021:
Average Adjusted Gross Income (AGI) in 2020: $66,257 (Individual Income Tax Returns)
Here:
$66,257
State:
$68,945
Salary/wage: $54,233 (reported on 72.7% of returns)
Here:
$54,233
State:
$57,142
(% of AGI for various income ranges: 886.0% for AGIs below $25k, 2790.5% for AGIs $25k-50k, 5311.6% for AGIs $50k-75k, 7571.2% for AGIs $75k-100k, 13743.2% for AGIs $100k-200k, 55878.3% for AGIs over 200k)
Taxable interest for individuals: $1,204 (reported on 42.1% of returns)
This zip code:
$1,204
Michigan:
$1,630
(% of AGI for various income ranges: 30.0% for AGIs below $25k, 37.8% for AGIs $25k-50k, 65.1% for AGIs $50k-75k, 88.8% for AGIs $75k-100k, 124.5% for AGIs $100k-200k, 808.3% for AGIs over 200k)
Ordinary dividends: $6,361 (reported on 21.2% of returns)
Here:
$6,361
State:
$6,972
(% of AGI for various income ranges: 39.4% for AGIs below $25k, 36.4% for AGIs $25k-50k, 82.2% for AGIs $50k-75k, 155.0% for AGIs $75k-100k, 342.1% for AGIs $100k-200k, 4410.0% for AGIs over 200k)
Net capital gain/loss in AGI: +$12,153 (reported on 17.3% of returns)
Here:
+$12,153
State:
+$20,064
(% of AGI for various income ranges: 25.1% for AGIs below $25k, 18.6% for AGIs $25k-50k, 40.8% for AGIs $50k-75k, 140.0% for AGIs $75k-100k, 505.0% for AGIs $100k-200k, 9111.7% for AGIs over 200k)
Profit/loss from business: +$11,975 (reported on 13.5% of returns)
Here:
+$11,975
State:
+$11,172
(% of AGI for various income ranges: 70.5% for AGIs below $25k, 102.1% for AGIs $25k-50k, 149.7% for AGIs $50k-75k, 209.6% for AGIs $75k-100k, 441.6% for AGIs $100k-200k, 3601.7% for AGIs over 200k)
Taxable individual retirement arrangement distribution: $20,902 (reported on 13.5% of returns)
48657:
$20,902
Michigan:
$19,803
(% of AGI for various income ranges: 70.6% for AGIs below $25k, 164.4% for AGIs $25k-50k, 235.1% for AGIs $50k-75k, 536.2% for AGIs $75k-100k, 1092.6% for AGIs $100k-200k, 4610.0% for AGIs over 200k)
Total itemized deductions: $65,827 (reported on 9.4% of returns)
Here:
$65,827
State:
$34,117
(% of AGI for various income ranges: 360.0% for AGIs $25k-50k, 755.9% for AGIs $50k-75k, 991.2% for AGIs $75k-100k, 2512.4% for AGIs $100k-200k, 11045.0% for AGIs over 200k)
Charity contributions: $12,447 (reported on 4.3% of returns)
Here:
$12,447
State:
$13,548
(% of AGI for various income ranges: 10.6% for AGIs $25k-50k, 33.2% for AGIs $50k-75k, 128.4% for AGIs $100k-200k, 2370.0% for AGIs over 200k)
Taxes paid: $7,618 (reported on 5.6% of returns)
48657:
$7,618
State:
$7,972
(% of AGI for various income ranges: 19.9% for AGIs $25k-50k, 36.5% for AGIs $50k-75k, 64.2% for AGIs $75k-100k, 167.4% for AGIs $100k-200k, 971.7% for AGIs over 200k)
Earned income credit: $2,009 (reported on 11.5% of returns)
Here:
$2,009
State:
$2,251
(% of AGI for various income ranges: 58.7% for AGIs below $25k, 50.4% for AGIs $25k-50k)
Percentage of individuals using paid preparers for their 2020 taxes: 94.6%
Here:
95%
State:
93%
(% for various income ranges: 93.1% for AGIs below $25k, 94.9% for AGIs $25k-50k, 94.1% for AGIs $50k-75k, 97.2% for AGIs $75k-100k, 96.6% for AGIs $100k-200k, 94.1% for AGIs over 200k)
Averages for the 2012 tax year for zip code 48657, filed in 2013:
Average Adjusted Gross Income (AGI) in 2012: $55,775 (Individual Income Tax Returns)
Here:
$55,775
State:
$55,609
Salary/wage: $49,582 (reported on 77.6% of returns)
Here:
$49,582
State:
$46,782
(% of AGI for various income ranges: 62.6% for AGIs below $25k, 63.9% for AGIs $25k-50k, 69.0% for AGIs $50k-75k, 70.1% for AGIs $75k-100k, 71.1% for AGIs $100k-200k, 71.8% for AGIs over 200k)
Taxable interest for individuals: $1,196 (reported on 40.6% of returns)
This zip code:
$1,196
Michigan:
$1,491
(% of AGI for various income ranges: 1.3% for AGIs below $25k, 1.2% for AGIs $25k-50k, 0.4% for AGIs $50k-75k, 0.9% for AGIs $75k-100k, 1.0% for AGIs $100k-200k, 0.6% for AGIs over 200k)
Ordinary dividends: $5,038 (reported on 22.6% of returns)
Here:
$5,038
State:
$6,225
(% of AGI for various income ranges: 1.4% for AGIs below $25k, 1.7% for AGIs $25k-50k, 1.0% for AGIs $50k-75k, 1.1% for AGIs $75k-100k, 1.9% for AGIs $100k-200k, 3.9% for AGIs over 200k)
Net capital gain/loss in AGI: +$3,385 (reported on 15.9% of returns)
Here:
+$3,385
State:
+$9,326
(% of AGI for various income ranges: 0.3% for AGIs $25k-50k, 0.3% for AGIs $75k-100k, 1.1% for AGIs $100k-200k, 2.8% for AGIs over 200k)
Profit/loss from business: +$8,329 (reported on 13.1% of returns)
Here:
+$8,329
State:
+$11,523
(% of AGI for various income ranges: 5.4% for AGIs below $25k, 2.4% for AGIs $25k-50k, 1.6% for AGIs $50k-75k, 1.5% for AGIs $75k-100k, 2.8% for AGIs $100k-200k)
Taxable individual retirement arrangement distribution: $13,965 (reported on 13.4% of returns)
48657:
$13,965
Michigan:
$15,298
(% of AGI for various income ranges: 3.1% for AGIs below $25k, 3.5% for AGIs $25k-50k, 3.5% for AGIs $50k-75k, 2.9% for AGIs $75k-100k, 6.6% for AGIs $100k-200k)
Total itemized deductions: $21,000 (17% of AGI, reported on 27.8% of returns)
Here:
$21,000
State:
$21,628
Here:
17.3% of AGI
State:
18.4% of AGI
(% of AGI for various income ranges: 6.8% for AGIs below $25k, 6.9% for AGIs $25k-50k, 10.0% for AGIs $50k-75k, 12.2% for AGIs $75k-100k, 13.4% for AGIs $100k-200k, 10.1% for AGIs over 200k)
Charity contributions: $3,882 (reported on 22.6% of returns)
Here:
$3,882
State:
$4,225
(% of AGI for various income ranges: 0.7% for AGIs below $25k, 0.8% for AGIs $25k-50k, 1.2% for AGIs $50k-75k, 2.1% for AGIs $75k-100k, 2.2% for AGIs $100k-200k, 1.7% for AGIs over 200k)
Taxes paid: $8,306 (reported on 27.8% of returns)
48657:
$8,306
State:
$8,327
(% of AGI for various income ranges: 1.3% for AGIs below $25k, 2.0% for AGIs $25k-50k, 3.3% for AGIs $50k-75k, 4.5% for AGIs $75k-100k, 5.6% for AGIs $100k-200k, 5.4% for AGIs over 200k)
Earned income credit: $1,966 (reported on 15.7% of returns)
Here:
$1,966
State:
$2,306
(% of AGI for various income ranges: 4.9% for AGIs below $25k, 0.8% for AGIs $25k-50k)
Percentage of individuals using paid preparers for their 2012 taxes: 54.2%
Here:
54%
State:
57%
(% for various income ranges: 47.0% for AGIs below $25k, 56.6% for AGIs $25k-50k, 60.7% for AGIs $50k-75k, 57.6% for AGIs $75k-100k, 62.5% for AGIs $100k-200k, 77.8% for AGIs over 200k)
Averages for the 2004 tax year for zip code 48657, filed in 2005:
Average Adjusted Gross Income (AGI) in 2004: $45,988 (Individual Income Tax Returns)
Here:
$45,988
State:
$48,204
Salary/wage: $41,429 (reported on 83.2% of returns)
Here:
$41,429
State:
$42,791
(% of AGI for various income ranges: 80.1% for AGIs below $10k, 63.4% for AGIs $10k-25k, 71.2% for AGIs $25k-50k, 77.3% for AGIs $50k-75k, 78.5% for AGIs $75k-100k, 76.6% for AGIs over 100k)
Taxable interest for individuals: $1,198 (reported on 51.8% of returns)
This zip code:
$1,198
Michigan:
$1,725
(% of AGI for various income ranges: 4.7% for AGIs below $10k, 2.6% for AGIs $10k-25k, 1.6% for AGIs $25k-50k, 1.1% for AGIs $50k-75k, 1.1% for AGIs $75k-100k, 1.0% for AGIs over 100k)
Taxable dividends: $2,567 (reported on 25.0% of returns)
Here:
$2,567
State:
$3,420
(% of AGI for various income ranges: 2.4% for AGIs below $10k, 1.9% for AGIs $10k-25k, 0.9% for AGIs $25k-50k, 0.9% for AGIs $50k-75k, 1.2% for AGIs $75k-100k, 1.8% for AGIs over 100k)
Net capital gain/loss: +$5,317 (reported on 18.2% of returns)
Here:
+$5,317
State:
+$8,532
(% of AGI for various income ranges: -0.6% for AGIs below $10k, 0.8% for AGIs $10k-25k, 0.6% for AGIs $25k-50k, 0.7% for AGIs $50k-75k, 1.7% for AGIs $75k-100k, 4.3% for AGIs over 100k)
Profit/loss from business: +$5,067 (reported on 15.2% of returns)
Here:
+$5,067
State:
+$9,547
(% of AGI for various income ranges: 5.2% for AGIs below $10k, 5.8% for AGIs $10k-25k, 2.1% for AGIs $25k-50k, 0.9% for AGIs $50k-75k, 0.5% for AGIs $75k-100k, 1.2% for AGIs over 100k)
IRA payment deduction: $2,695 (reported on 2.2% of returns)
48657:
$2,695
Michigan:
$2,875
(% of AGI for various income ranges: 0.2% for AGIs $10k-25k, 0.2% for AGIs $25k-50k, 0.1% for AGIs $50k-75k, 0.3% for AGIs $75k-100k)
Self-employed pension: $9,100 (reported on 0.3% of returns)
Here:
$9,100
Michigan:
$13,826
Total itemized deductions: $17,506 (20% of AGI, reported on 32.6% of returns)
Here:
$17,506
State:
$18,509
Here:
20.1% of AGI
State:
20.7% of AGI
(% of AGI for various income ranges: 8.6% for AGIs below $10k, 9.0% for AGIs $10k-25k, 11.0% for AGIs $25k-50k, 15.0% for AGIs $50k-75k, 13.3% for AGIs $75k-100k, 12.4% for AGIs over 100k)
Charity contributions deductions: $2,940 (3% of AGI, reported on 29.0% of returns)
Here:
$2,940
State:
$3,365
Here:
3.2% of AGI
State:
3.6% of AGI
(% of AGI for various income ranges: 0.5% for AGIs below $10k, 0.9% for AGIs $10k-25k, 1.2% for AGIs $25k-50k, 2.0% for AGIs $50k-75k, 2.2% for AGIs $75k-100k, 2.3% for AGIs over 100k)
Total tax: $6,960 (reported on 75.2% of returns)
48657:
$6,960
State:
$7,691
(% of AGI for various income ranges: 2.2% for AGIs below $10k, 3.8% for AGIs $10k-25k, 6.2% for AGIs $25k-50k, 8.4% for AGIs $50k-75k, 10.1% for AGIs $75k-100k, 18.6% for AGIs over 100k)
Earned income credit: $1,542 (reported on 15.4% of returns)
Here:
$1,542
State:
$1,737
Percentage of individuals using paid preparers for their 2004 taxes: 60.0%
Here:
60%
State:
60%
(% for various income ranges: 53.0% for AGIs below $10k, 58.7% for AGIs $10k-25k, 63.5% for AGIs $25k-50k, 62.0% for AGIs $50k-75k, 61.4% for AGIs $75k-100k, 65.7% for AGIs over 100k)
Likely homosexual households (counted as self-reported same-sex unmarried-partner households)
Lesbian couples: 0.3% of all households
Gay men: 0.0% of all households
Household received Food Stamps/SNAP in the past 12 months: 416 Household did not receive Food Stamps/SNAP in the past 12 months: 2,744
Women who had a birth in the past 12 months: 130 (118 now married, 14 unmarried) Women who did not have a birth in the past 12 months: 1,177 (620 now married, 553 unmarried)
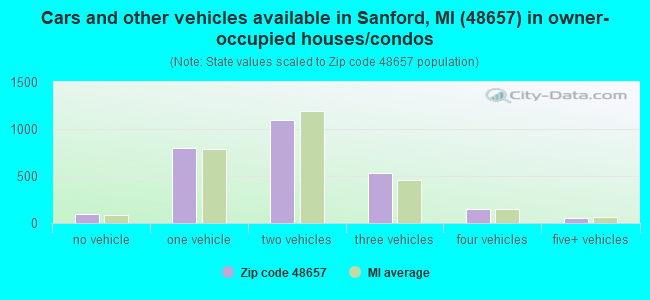
Housing units in zip code 48657 with a mortgage: 1,486 (129 second mortgage, 4 home equity loan, 124 both second mortgage and home equity loan) Houses without a mortgage: 6
Median monthly owner costs for units with a mortgage: $1,324 Median monthly owner costs for units without a mortgage: $544
Residents with income below the poverty level in 2022:
This zip code:
16.6%
Whole state:
13.4%
Residents with income below 50% of the poverty level in 2022:
This zip code:
5.0%
Whole state:
6.9%
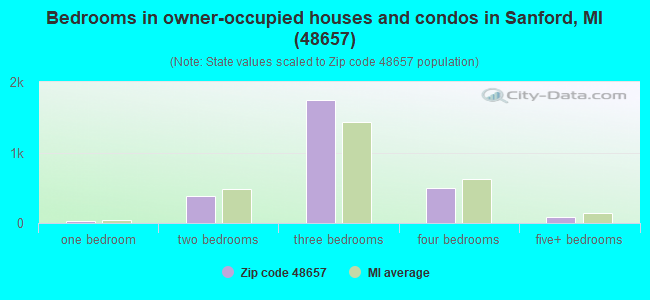
Median number of rooms in houses and condos:
Here:
6.2
State:
6.5
Median number of rooms in apartments:
Here:
4.0
State:
4.3
Notable locations in this zip code not listed on our city pages
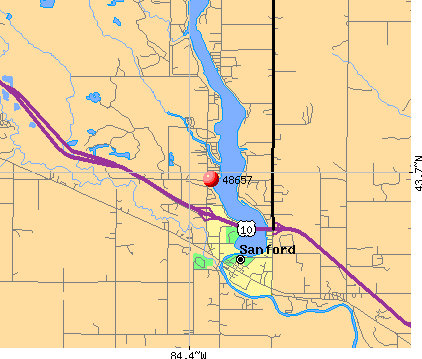
Notable locations in zip code 48657: Black Creek Forest Campground (A), Sanford Lake Marina (B), Michigan Department of Natural Resources Sanford Field Office (C), Jerome Township Hall (D), Sanford Historical Museum (E), MidMichigan Medical Center Emergency Medical Services Station 9 (F), Jerome Township Fire Department Station 1 (G), Lincoln Township Fire Department (H), Jerome Township Fire Department Station 2 (I), Edenville Fire and Rescue Station 2 (J). Display/hide their locations on the map
Churches in zip code 48657 include: Olson Community Church (A), Abundant Life Church (B), Meridian Church of God (C), Saint Paul Lutheran Church (D), Church of Jesus Christ of Latter Day Saints (E), Cleft of the Rock Family Church (F), Lighthouse Bible Baptist Church (G), Sanford United Methodist Church (H), Saint Agnes Roman Catholic Church (I). Display/hide their locations on the map
Rivers and creeks: Averill Creek (A), Varity Creek (B), Black Creek (C), Bluff Creek (D), Salt River (E), Mud Creek (F). Display/hide their locations on the map
Parks in zip code 48657 include: Veterans Memorial Park (1), State Salt Well Number 1 Historical Marker (2), Origins of the Salt Industry Historical Marker (3), Sanford Lake Park (4). Display/hide their locations on the map
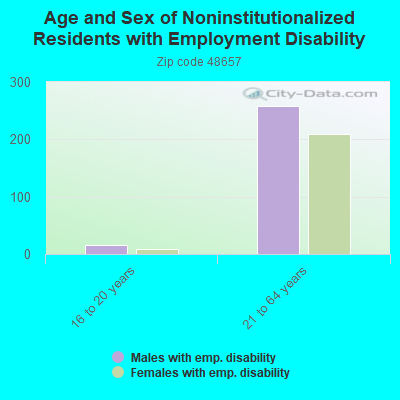
In group quarters: 6 (-1 institutionalized population)
Size of family households: 1,210 2-persons, 450 3-persons, 340 4-persons, 166 5-persons, 49 6-persons, 18 7-or-more-persons
Size of nonfamily households: 787 1-person, 124 2-persons, 10 3-persons
825 married couples with children.
404 single-parent households (159 men, 245 women).
98.7% of residents of 48657 zip code speak English at home.
0.3% of residents speak Spanish at home (100% very well).
0.3% of residents speak other Indo-European language at home (42% very well, 58% well).
0.1% of residents speak Asian or Pacific Island language at home (100% well).
0.7% of residents speak other language at home (79% very well, 10% well, 12% not well).
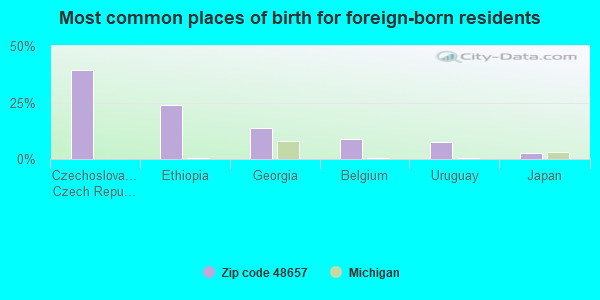
Foreign born population: 78 (1.1%) (55.7% of them are naturalized citizens)
This zip code:
1.1%
Whole state:
6.9%
39%Czechoslovakia (includes Czech Republic and Slovakia)
24%Ethiopia
14%Georgia
9%Belgium
8%Uruguay
3%Japan
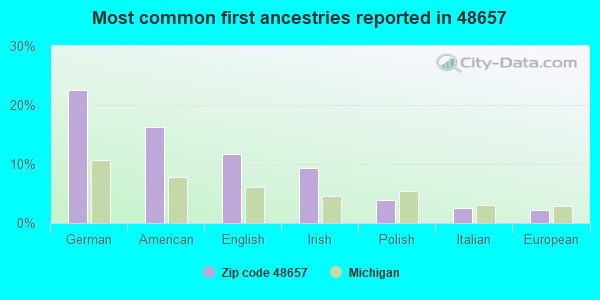
22%German
16%American
12%English
9%Irish
4%Polish
3%Italian
2%European
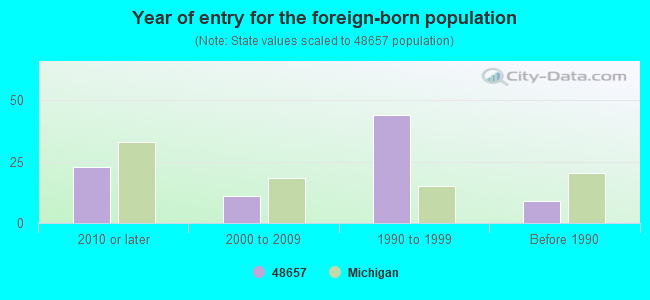
Year of entry for the foreign-born population
232010 or later
112000 to 2009
441990 to 1999
9Before 1990
Facilities with environmental interests located in this zip code:
MERIDIAN ELEMENTARY SCHOOL (3353 NORTH M-30 in SANFORD, MI)
(National Center for Education Statistics) - STATE ID-02515 Organizations: MERIDIAN PUBLIC SCHOOLS (SCHOOL DISTRICT)
MERIDIAN HIGH SCHOOL (3303 NORTH HIGHWAY M-30 in SANFORD, MI)
(National Center for Education Statistics) - STATE ID-05814 Organizations: MERIDIAN PUBLIC SCHOOLS (SCHOOL DISTRICT)
MERIDIAN JUNIOR HIGH SCHOOL (3475 NORTH M-30 in SANFORD, MI)
(National Center for Education Statistics) - STATE ID-02516 Organizations: MERIDIAN PUBLIC SCHOOLS (SCHOOL DISTRICT)
MI DEPT/TRANSPORTATION BRIDGE B01-56011 (BRIDGE M-18 OVER BUFF CREEK in SANFORD, MI)
(Resource Conservation and Recovery Act (tracking hazardous waste)) Organizations: MICH DEPT OF TRANSPORTATION (CONTACT/OPERATOR)
MI DEPT/TRANSPORTATION BRIDGE B01-56044 (US-10 OVER BUFF CREEK in SANFORD, MI)
(Resource Conservation and Recovery Act (tracking hazardous waste)) Organizations: MICH DEPT OF TRANSPORTATION (CONTACT/OPERATOR)
Alternative names: MIDOT BRIDGE US-10 OVER BUFF CREEK
DOLA INC (60 W SAGINAW RD in SANFORD, MI)
(Resource Conservation and Recovery Act (tracking hazardous waste))
ADVANCE AUTOMOTIVE (3090 N MERIDIAN ROAD in SANFORD, MI)
Conditionally Exempt Small Quantity Generators, less than 100 kg/month of hazardous waste (Resource Conservation and Recovery Act (tracking hazardous waste)) TRANSPORTER (Resource Conservation and Recovery Act (tracking hazardous waste)) Organizations: WALLY HEINRICH JR (CONTACT/OPERATOR)
MERIDAN BODY SHOP (2894 N M30 in SANFORD, MI)
(Resource Conservation and Recovery Act (tracking hazardous waste))
MERIDIAN ROAD PAC PRIDE FUELING (2278 N MERIDIAN ROAD in SANFORD, MI)
Small Quantity Generators, between 100 kg and 1000 kg of hazardous waste/month (Resource Conservation and Recovery Act (tracking hazardous waste)) Organizations: FOSTER PAC PRIDE (CONTACT/OPERATOR)
GOLD CROWN DEVELOPMENT CO INC (278 W SAGINAW RD in SANFORD, MI)
Conditionally Exempt Small Quantity Generators, less than 100 kg/month of hazardous waste (Resource Conservation and Recovery Act (tracking hazardous waste)) Organizations: MICHAEL L ELLIS (CONTACT/OPERATOR)
Housing units lacking complete plumbing facilities: 2.7% Housing units lacking complete kitchen facilities: 2.4%
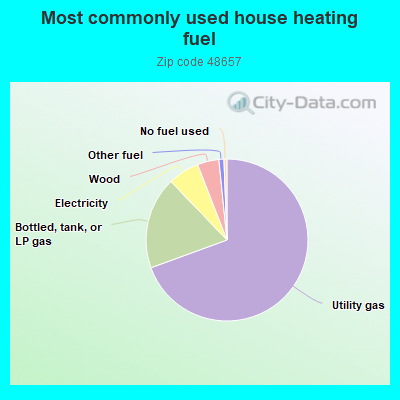
69.5%Utility gas
18.4%Bottled, tank, or LP gas
6.3%Electricity
4.3%Wood
1.0%Other fuel
0.6%No fuel used
Population in 1990: 5,154. Population change in the 1990s: +2,996 (+58.1%).
Place of birth for U.S.-born residents:
This state: 6,685
Northeast: 68
Midwest: 352
South: 187
West: 89
62% of the 48657 zip code residents lived in the same house 5 years ago. Out of people who lived in different houses, 61% lived in this county. Out of people who lived in different counties, 50% lived in Michigan.
92% of the 48657 zip code residents lived in the same house 1 year ago. Out of people who lived in different houses, 53% moved from this county. Out of people who lived in different houses, 34% moved from different county within same state. Out of people who lived in different houses, 14% moved from different state.
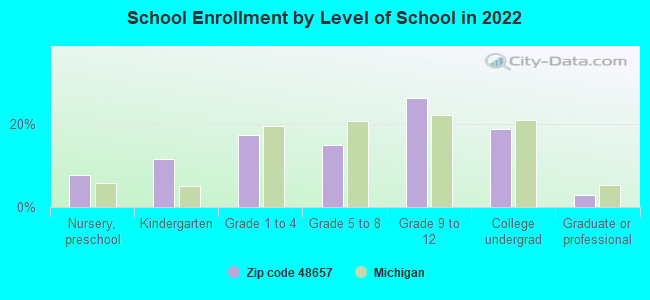
Private vs. public school enrollment:
Students in private schools in grades 1 to 8 (elementary and middle school): 44
Here:
9.7%
Michigan:
12.4%
Students in private schools in grades 9 to 12 (high school):
Here:
0.0%
Michigan:
9.8%
Students in private undergraduate colleges: 25
Here:
9.3%
Michigan:
14.9%
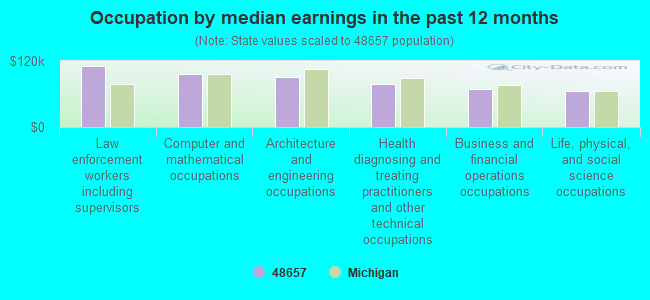
Occupation by median earnings in the past 12 months ($)
110,731Law enforcement workers including supervisors
96,989Computer and mathematical occupations
91,055Architecture and engineering occupations
77,658Health diagnosing and treating practitioners and other technical occupations
68,521Business and financial operations occupations
65,847Life, physical, and social science occupations
Top industries in this zip code by the number of employees in 2005:
2002 - 2018 National Fire Incident Reporting System (NFIRS) incidents
Based on the data from the years 2002 - 2018 the average number of fires per year is 38. The highest number of fires - 57 took place in 2007, and the least - 14 in 2014. The data has a declining trend.
When looking into fire subcategories, the most incidents belonged to: Structure Fires (47.3%), and Outside Fires (31.0%).
Fire incident types reported to NFIRS in Zip Code 48657
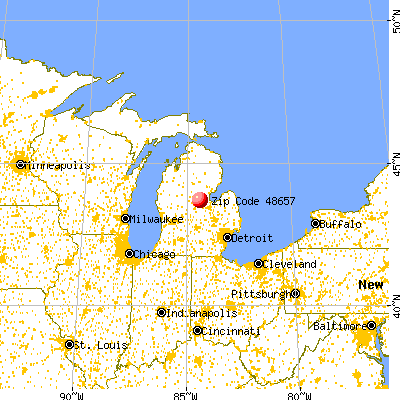


 Nearest zip codes: 48628, 48618, 48640, 48612, 48642, 48667.
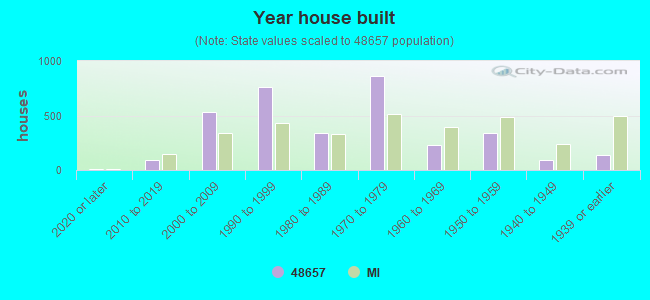


 Based on the data from the years 2002 - 2018 the average number of fires per year is 38. The highest number of fires - 57 took place in 2007, and the least - 14 in 2014. The data has a declining trend.
 When looking into fire subcategories, the most incidents belonged to: Structure Fires (47.3%), and Outside Fires (31.0%).