Estimated zip code population in 2022: 4,900 Zip code population in 2010: 5,393 Zip code population in 2000: 5,213
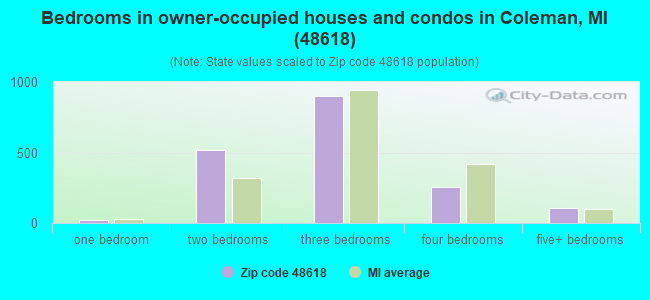
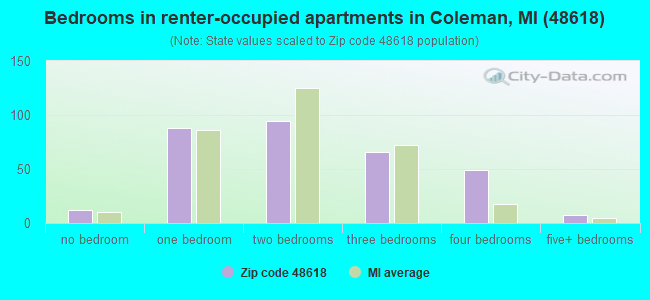
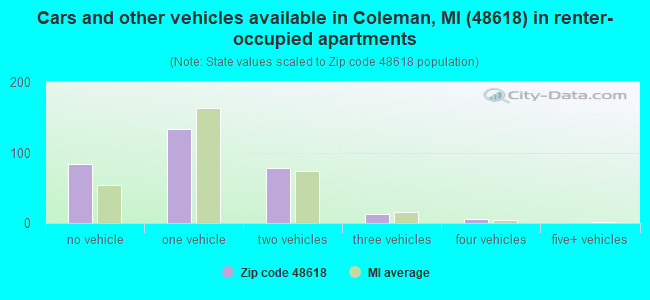
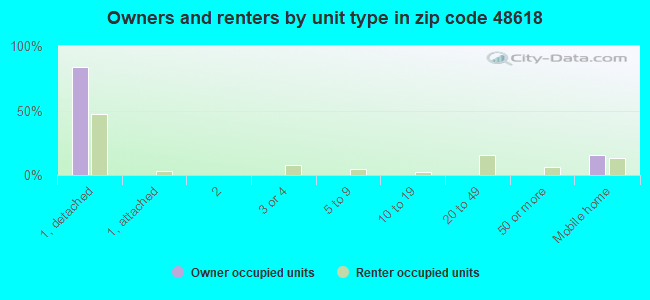
Houses and condos: 2,370 Renter-occupied apartments: 314
% of renters here:
15%
State:
27%
March 2022 cost of living index in zip code 48618: 80.3 (low, U.S. average is 100)
Land area: 103.8 sq. mi. Water area: 0.7 sq. mi.
Population density: 47 people per square mile
(very low).
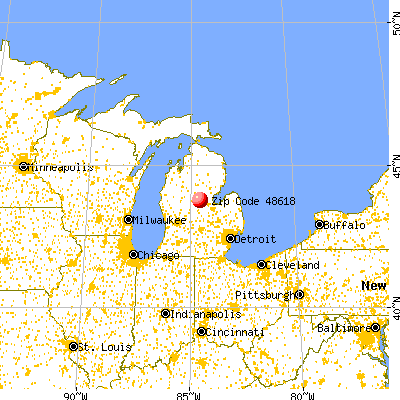
OSM Map
General Map
Google Map
MSN Map
OSM Map
General Map
Google Map
MSN Map
OSM Map
General Map
Google Map
MSN Map
OSM Map
General Map
Google Map
MSN Map
Please wait while loading the map...
Real estate property taxes paid for housing units in 2022:
This zip code:
1.3% ($1,631)
Michigan:
1.2% ($2,746)
Median real estate property taxes paid for housing units with mortgages in 2022: $1,750 (1.2%) Median real estate property taxes paid for housing units with no mortgage in 2022: $1,570 (1.4%)
Business Search- 14 Million verified businesses
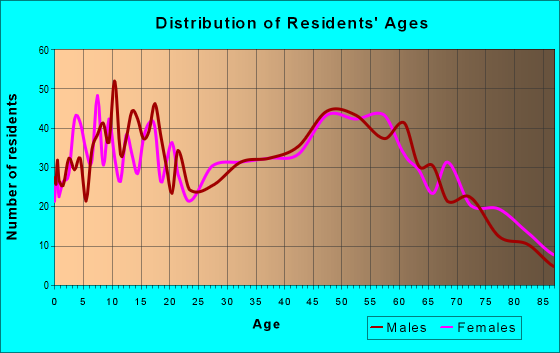
Males: 2,307
(47.1%)
Females: 2,593
(52.9%)
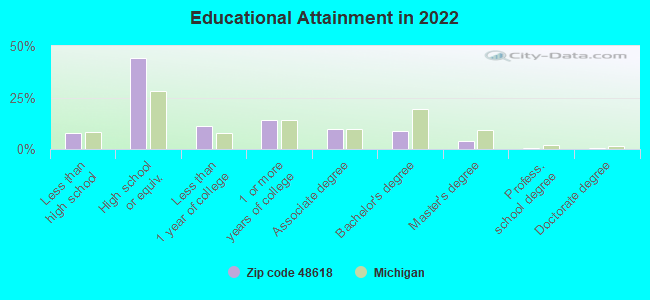
For population 25 years and over in 48618:
High school or higher: 91.1%
Bachelor's degree or higher: 13.4%
Graduate or professional degree: 4.6%
Unemployed: 6.6%
Mean travel time to work (commute): 27.0 minutes
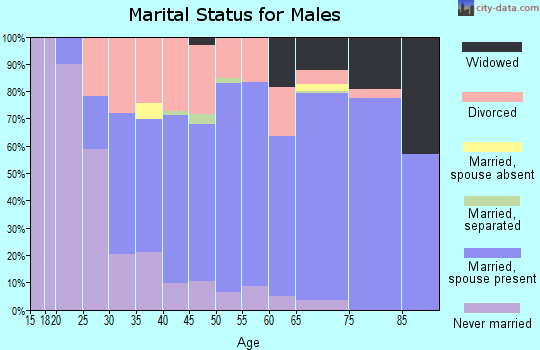
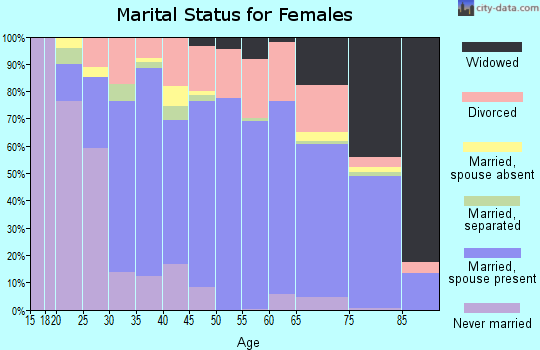
For population 15 years and over in 48618:
Never married: 25.9%
Now married: 48.9%
Separated: 1.1%
Widowed: 8.1%
Divorced: 16.0%
Zip code 48618 compared to state average:
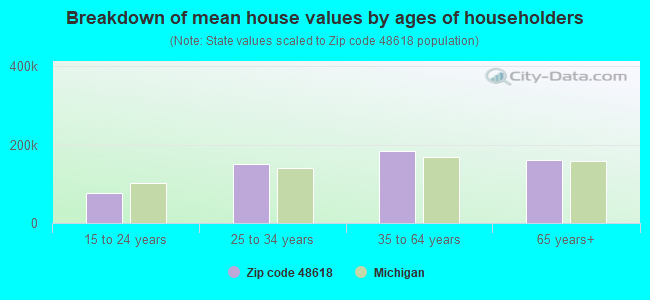
Median house value below state average.
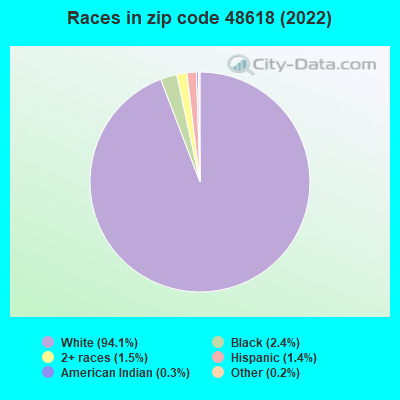
Black race population percentage significantly below state average.
Hispanic race population percentage significantly below state average.
Median age above state average.
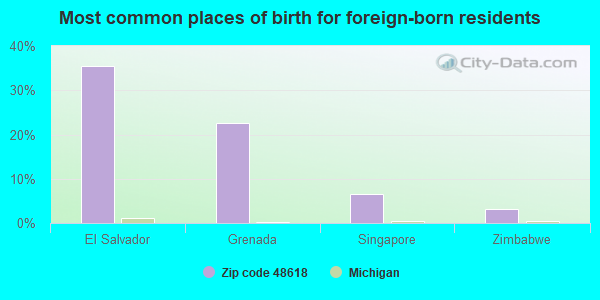
Foreign-born population percentage significantly below state average.
Renting percentage below state average.
Length of stay since moving in significantly above state average.
Number of college students below state average.
Percentage of population with a bachelor's degree or higher below state average.
Averages for the 2020 tax year for zip code 48618, filed in 2021:
Average Adjusted Gross Income (AGI) in 2020: $50,166 (Individual Income Tax Returns)
Here:
$50,166
State:
$68,945
Salary/wage: $44,968 (reported on 75.6% of returns)
Here:
$44,968
State:
$57,142
(% of AGI for various income ranges: 962.0% for AGIs below $25k, 2990.9% for AGIs $25k-50k, 5615.0% for AGIs $50k-75k, 8622.2% for AGIs $75k-100k, 12527.2% for AGIs $100k-200k)
Taxable interest for individuals: $880 (reported on 35.4% of returns)
This zip code:
$880
Michigan:
$1,630
(% of AGI for various income ranges: 31.2% for AGIs below $25k, 21.0% for AGIs $25k-50k, 46.1% for AGIs $50k-75k, 56.1% for AGIs $75k-100k, 118.9% for AGIs $100k-200k)
Ordinary dividends: $2,614 (reported on 14.2% of returns)
Here:
$2,614
State:
$6,972
(% of AGI for various income ranges: 29.5% for AGIs below $25k, 32.1% for AGIs $25k-50k, 62.9% for AGIs $50k-75k, 54.4% for AGIs $75k-100k, 161.1% for AGIs $100k-200k)
Net capital gain/loss in AGI: +$3,700 (reported on 10.2% of returns)
Here:
+$3,700
State:
+$20,064
(% of AGI for various income ranges: 17.7% for AGIs below $25k, 11.0% for AGIs $25k-50k, 36.1% for AGIs $50k-75k, 118.3% for AGIs $75k-100k, 248.9% for AGIs $100k-200k)
Profit/loss from business: +$8,693 (reported on 11.0% of returns)
Here:
+$8,693
State:
+$11,172
(% of AGI for various income ranges: 81.2% for AGIs below $25k, 100.7% for AGIs $25k-50k, 170.7% for AGIs $50k-75k, 85.0% for AGIs $75k-100k, 376.1% for AGIs $100k-200k)
Taxable individual retirement arrangement distribution: $12,142 (reported on 10.6% of returns)
48618:
$12,142
Michigan:
$19,803
(% of AGI for various income ranges: 60.4% for AGIs below $25k, 92.4% for AGIs $25k-50k, 218.6% for AGIs $50k-75k, 271.1% for AGIs $75k-100k, 657.2% for AGIs $100k-200k)
Total itemized deductions: $37,050 (reported on 1.6% of returns)
Here:
$37,050
State:
$34,117
(% of AGI for various income ranges: 823.3% for AGIs $100k-200k)
Taxes paid: $5,800 (reported on 2.0% of returns)
48618:
$5,800
State:
$7,972
(% of AGI for various income ranges: 14.1% for AGIs below $25k, 117.2% for AGIs $100k-200k)
Earned income credit: $2,369 (reported on 14.6% of returns)
Here:
$2,369
State:
$2,251
(% of AGI for various income ranges: 72.7% for AGIs below $25k, 76.9% for AGIs $25k-50k)
Percentage of individuals using paid preparers for their 2020 taxes: 94.7%
Here:
95%
State:
93%
(% for various income ranges: 93.9% for AGIs below $25k, 95.9% for AGIs $25k-50k, 94.9% for AGIs $50k-75k, 92.0% for AGIs $75k-100k, 95.8% for AGIs $100k-200k, 100.0% for AGIs over 200k)
Averages for the 2012 tax year for zip code 48618, filed in 2013:
Average Adjusted Gross Income (AGI) in 2012: $40,367 (Individual Income Tax Returns)
Here:
$40,367
State:
$55,609
Salary/wage: $36,437 (reported on 78.9% of returns)
Here:
$36,437
State:
$46,782
(% of AGI for various income ranges: 63.9% for AGIs below $25k, 73.0% for AGIs $25k-50k, 71.6% for AGIs $50k-75k, 77.5% for AGIs $75k-100k, 67.2% for AGIs $100k-200k, 73.1% for AGIs over 200k)
Taxable interest for individuals: $760 (reported on 35.9% of returns)
This zip code:
$760
Michigan:
$1,491
(% of AGI for various income ranges: 1.4% for AGIs below $25k, 0.6% for AGIs $25k-50k, 0.7% for AGIs $50k-75k, 0.5% for AGIs $75k-100k, 0.5% for AGIs $100k-200k)
Ordinary dividends: $2,331 (reported on 16.5% of returns)
Here:
$2,331
State:
$6,225
(% of AGI for various income ranges: 1.2% for AGIs below $25k, 1.0% for AGIs $25k-50k, 0.9% for AGIs $50k-75k, 0.7% for AGIs $75k-100k, 1.3% for AGIs $100k-200k)
Net capital gain/loss in AGI: +$1,612 (reported on 10.1% of returns)
Here:
+$1,612
State:
+$9,326
(% of AGI for various income ranges: 0.9% for AGIs $75k-100k, 1.7% for AGIs $100k-200k)
Profit/loss from business: +$4,518 (reported on 11.8% of returns)
Here:
+$4,518
State:
+$11,523
(% of AGI for various income ranges: 4.2% for AGIs below $25k, 1.7% for AGIs $25k-50k, 1.0% for AGIs $50k-75k, 0.8% for AGIs $75k-100k)
Taxable individual retirement arrangement distribution: $8,821 (reported on 10.1% of returns)
48618:
$8,821
Michigan:
$15,298
(% of AGI for various income ranges: 2.7% for AGIs below $25k, 1.5% for AGIs $25k-50k, 2.9% for AGIs $50k-75k, 1.6% for AGIs $75k-100k, 3.4% for AGIs $100k-200k)
Total itemized deductions: $17,452 (23% of AGI, reported on 18.6% of returns)
Here:
$17,452
State:
$21,628
Here:
23.2% of AGI
State:
18.4% of AGI
(% of AGI for various income ranges: 5.5% for AGIs below $25k, 6.4% for AGIs $25k-50k, 7.9% for AGIs $50k-75k, 9.0% for AGIs $75k-100k, 10.0% for AGIs $100k-200k, 11.5% for AGIs over 200k)
Charity contributions: $3,029 (reported on 13.1% of returns)
Here:
$3,029
State:
$4,225
(% of AGI for various income ranges: 0.4% for AGIs below $25k, 0.6% for AGIs $25k-50k, 0.7% for AGIs $50k-75k, 1.6% for AGIs $75k-100k, 2.1% for AGIs $100k-200k)
Taxes paid: $5,016 (reported on 18.6% of returns)
48618:
$5,016
State:
$8,327
(% of AGI for various income ranges: 0.9% for AGIs below $25k, 1.5% for AGIs $25k-50k, 2.1% for AGIs $50k-75k, 2.6% for AGIs $75k-100k, 3.5% for AGIs $100k-200k, 5.2% for AGIs over 200k)
Earned income credit: $2,066 (reported on 19.8% of returns)
Here:
$2,066
State:
$2,306
(% of AGI for various income ranges: 5.5% for AGIs below $25k, 1.2% for AGIs $25k-50k)
Percentage of individuals using paid preparers for their 2012 taxes: 58.6%
Here:
59%
State:
57%
(% for various income ranges: 53.8% for AGIs below $25k, 59.7% for AGIs $25k-50k, 62.9% for AGIs $50k-75k, 63.2% for AGIs $75k-100k, 69.2% for AGIs $100k-200k, 100.0% for AGIs over 200k)
Averages for the 2004 tax year for zip code 48618, filed in 2005:
Average Adjusted Gross Income (AGI) in 2004: $36,250 (Individual Income Tax Returns)
Here:
$36,250
State:
$48,204
Salary/wage: $34,172 (reported on 83.1% of returns)
Here:
$34,172
State:
$42,791
(% of AGI for various income ranges: 92.8% for AGIs below $10k, 72.4% for AGIs $10k-25k, 78.4% for AGIs $25k-50k, 86.5% for AGIs $50k-75k, 80.1% for AGIs $75k-100k, 66.0% for AGIs over 100k)
Taxable interest for individuals: $957 (reported on 44.8% of returns)
This zip code:
$957
Michigan:
$1,725
(% of AGI for various income ranges: 6.3% for AGIs below $10k, 2.1% for AGIs $10k-25k, 1.0% for AGIs $25k-50k, 1.0% for AGIs $50k-75k, 0.7% for AGIs $75k-100k, 0.8% for AGIs over 100k)
Taxable dividends: $2,223 (reported on 18.1% of returns)
Here:
$2,223
State:
$3,420
(% of AGI for various income ranges: 2.3% for AGIs below $10k, 1.2% for AGIs $10k-25k, 1.2% for AGIs $25k-50k, 0.7% for AGIs $50k-75k, 1.1% for AGIs $75k-100k, 1.4% for AGIs over 100k)
Net capital gain/loss: +$6,067 (reported on 11.3% of returns)
Here:
+$6,067
State:
+$8,532
(% of AGI for various income ranges: 1.7% for AGIs below $10k, 0.2% for AGIs $10k-25k, 0.7% for AGIs $25k-50k, 0.7% for AGIs $50k-75k, 0.4% for AGIs $75k-100k, 9.1% for AGIs over 100k)
Profit/loss from business: +$3,863 (reported on 14.1% of returns)
Here:
+$3,863
State:
+$9,547
(% of AGI for various income ranges: 13.3% for AGIs below $10k, 4.6% for AGIs $10k-25k, 1.6% for AGIs $25k-50k, 0.8% for AGIs $50k-75k, 0.4% for AGIs $75k-100k, -0.4% for AGIs over 100k)
IRA payment deduction: $2,447 (reported on 2.0% of returns)
48618:
$2,447
Michigan:
$2,875
Total itemized deductions: $14,901 (24% of AGI, reported on 22.9% of returns)
Here:
$14,901
State:
$18,509
Here:
24.0% of AGI
State:
20.7% of AGI
(% of AGI for various income ranges: 8.7% for AGIs below $10k, 5.8% for AGIs $10k-25k, 9.1% for AGIs $25k-50k, 9.7% for AGIs $50k-75k, 12.0% for AGIs $75k-100k, 9.9% for AGIs over 100k)
Charity contributions deductions: $2,287 (3% of AGI, reported on 17.7% of returns)
Here:
$2,287
State:
$3,365
Here:
3.4% of AGI
State:
3.6% of AGI
(% of AGI for various income ranges: 0.6% for AGIs $10k-25k, 1.0% for AGIs $25k-50k, 1.1% for AGIs $50k-75k, 1.3% for AGIs $75k-100k, 1.6% for AGIs over 100k)
Total tax: $4,292 (reported on 72.7% of returns)
48618:
$4,292
State:
$7,691
(% of AGI for various income ranges: 3.6% for AGIs below $10k, 3.9% for AGIs $10k-25k, 6.0% for AGIs $25k-50k, 8.3% for AGIs $50k-75k, 10.6% for AGIs $75k-100k, 16.4% for AGIs over 100k)
Earned income credit: $1,749 (reported on 16.5% of returns)
Here:
$1,749
State:
$1,737
Percentage of individuals using paid preparers for their 2004 taxes: 63.0%
Here:
63%
State:
60%
(% for various income ranges: 56.9% for AGIs below $10k, 65.3% for AGIs $10k-25k, 64.6% for AGIs $25k-50k, 63.4% for AGIs $50k-75k, 60.9% for AGIs $75k-100k, 69.7% for AGIs over 100k)
Likely homosexual households (counted as self-reported same-sex unmarried-partner households)
Lesbian couples: 0.1% of all households
Gay men: 0.0% of all households
Household received Food Stamps/SNAP in the past 12 months: 351 Household did not receive Food Stamps/SNAP in the past 12 months: 1,765
Women who had a birth in the past 12 months: 58 (51 now married, 7 unmarried) Women who did not have a birth in the past 12 months: 1,001 (425 now married, 574 unmarried)
Housing units in zip code 48618 with a mortgage: 865 (53 second mortgage, 47 both second mortgage and home equity loan) Houses without a mortgage: 11
Median monthly owner costs for units with a mortgage: $1,064 Median monthly owner costs for units without a mortgage: $468
Residents with income below the poverty level in 2022:
This zip code:
12.0%
Whole state:
13.4%
Residents with income below 50% of the poverty level in 2022:
This zip code:
5.4%
Whole state:
6.9%
Median number of rooms in houses and condos:
Here:
6.1
State:
6.5
Median number of rooms in apartments:
Here:
4.1
State:
4.3
Notable locations in this zip code not listed on our city pages
Notable locations in zip code 48618: Coleman Police Department (A), Coleman Area Library (B), MidMichigan Medical Center Emergency Medical Services Station 10 (C), Coleman Community Fire Department (D). Display/hide their locations on the map
Churches in zip code 48618 include: North Bradley Church of God (A), Saint Philip Neri Church (B), Coleman Assembly of God Church (C), Community of Christ Church (D), Faith United Methodist Church (E), Grace Baptist Church (F), Coleman Wesleyan Church (G), Geneva Hope Church (H), Holley Chapel (I). Display/hide their locations on the map
Streams, rivers, and creeks: Howard Creek (A), South Branch Salt River (B), Menery Drain (C), Curtis Drain (D), North Branch Salt River (E). Display/hide their locations on the map
510 married couples with children.
226 single-parent households (64 men, 162 women).
99.1% of residents of 48618 zip code speak English at home.
0.3% of residents speak Spanish at home (85% very well, 8% well, 8% not well).
0.3% of residents speak other Indo-European language at home (73% very well, 27% well).
0.1% of residents speak Asian or Pacific Island language at home (100% very well).
Foreign born population: 31 (0.6%) (81.4% of them are naturalized citizens)
This zip code:
0.6%
Whole state:
6.9%
35%El Salvador
23%Grenada
6%Singapore
3%Zimbabwe
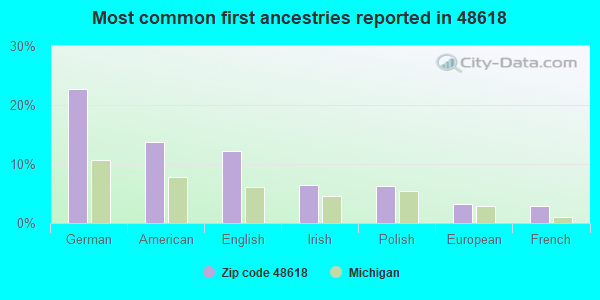
23%German
14%American
12%English
6%Irish
6%Polish
3%European
3%French
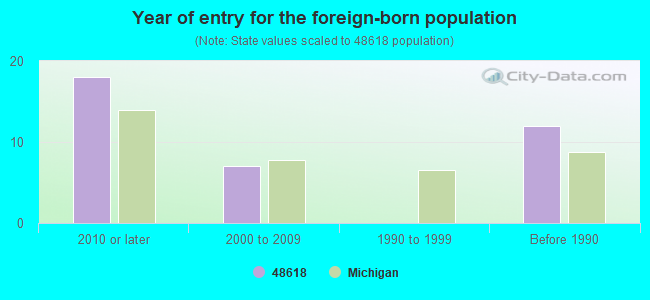
Year of entry for the foreign-born population
182010 or later
72000 to 2009
01990 to 1999
12Before 1990
Facilities with environmental interests located in this zip code:
BLODGETT 41-SUNOCO (6506 NORTH M-18 in COLEMAN, MI)
National Pollutant Discharge Elimination System NON-MAJOR (Tracking pollutant discharge elimination systems) - permit Organizations: BLODGETT OIL COMPANY INC (CONTACT/OWNER)
BLODGETT OIL CO (5246 N COLEMAN RD in COLEMAN, MI)
(Resource Conservation and Recovery Act (tracking hazardous waste)) Alternative names: BLODGETT OIL CO (E)
BLODGETT OIL CO (NEAR 6506 N M-18 in COLEMAN, MI)
(Resource Conservation and Recovery Act (tracking hazardous waste))
DJ S MOLDING INC (4610 W SAGINAW RD in COLEMAN, MI)
AIR MINOR (AIRS/AFS) Business SIC classification: NONCLASSIFIABLE ESTABLISHMENTS
Housing units lacking complete plumbing facilities: 0.7% Housing units lacking complete kitchen facilities: 0.7%
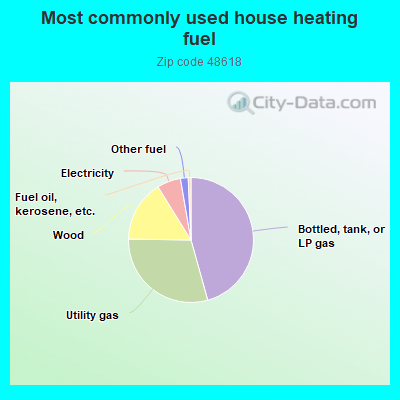
45.6%Bottled, tank, or LP gas
29.5%Utility gas
15.9%Wood
6.1%Electricity
2.0%Other fuel
0.7%Fuel oil, kerosene, etc.
Population in 1990: 5,866.
Place of birth for U.S.-born residents:
This state: 4,539
Northeast: 46
Midwest: 142
South: 77
West: 47
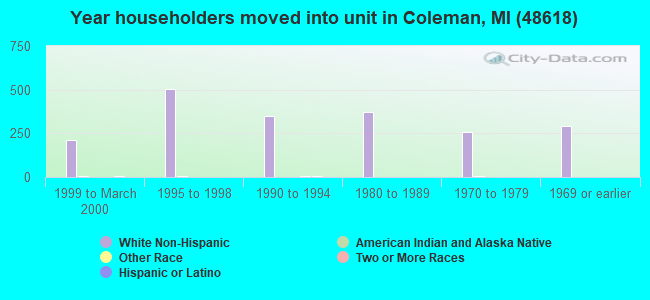
67% of the 48618 zip code residents lived in the same house 5 years ago. Out of people who lived in different houses, 49% lived in this county. Out of people who lived in different counties, 50% lived in Michigan.
92% of the 48618 zip code residents lived in the same house 1 year ago. Out of people who lived in different houses, 26% moved from this county. Out of people who lived in different houses, 58% moved from different county within same state. Out of people who lived in different houses, 15% moved from different state. Out of people who lived in different houses, 3% moved from abroad.
Private vs. public school enrollment:
Students in private schools in grades 1 to 8 (elementary and middle school): 14
Here:
3.0%
Michigan:
12.4%
Students in private schools in grades 9 to 12 (high school):
Here:
0.0%
Michigan:
9.8%
Students in private undergraduate colleges: 31
Here:
29.5%
Michigan:
14.9%
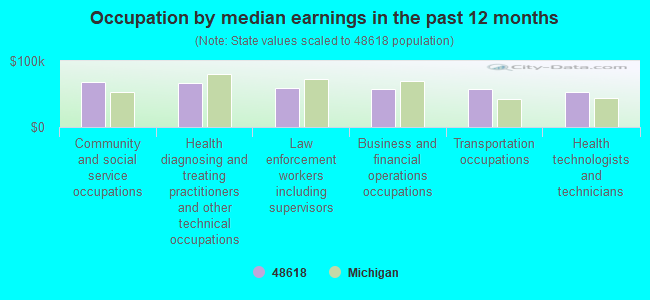
Occupation by median earnings in the past 12 months ($)
68,138Community and social service occupations
67,203Health diagnosing and treating practitioners and other technical occupations
59,189Law enforcement workers including supervisors
58,073Business and financial operations occupations
57,055Transportation occupations
53,585Health technologists and technicians
Companies with federal contracts located in this zip code:
ROBINSON INDUSTRIES INC (3051 W CURTIS RD in COLEMAN, MI; small business)
$12,790 with Defense Logistics Agency for Motor Vehicle Maintenance and Repair Shop Specialized Equipment. Signed on 2005-08-04. Completion date: 2005-09-19.
Top industries in this zip code by the number of employees in 2005:
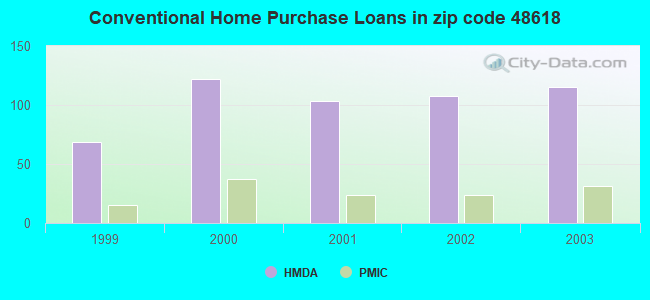
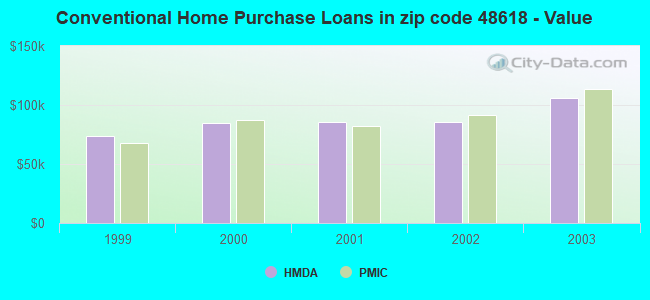
Detailed PMIC statistics for the following Tracts:2916.00
, 2917.00
2002 - 2018 National Fire Incident Reporting System (NFIRS) incidents
Based on the data from the years 2002 - 2018 the average number of fires per year is 8. The highest number of fires - 32 took place in 2002, and the least - 0 in 2013. The data has a dropping trend.
When looking into fire subcategories, the most reports belonged to: Structure Fires (50.0%), and Outside Fires (25.4%).
Fire incident types reported to NFIRS in Zip Code 48618


 Nearest zip codes: 48657, 48612, 48617, 48878, 48883, 48628.


 Based on the data from the years 2002 - 2018 the average number of fires per year is 8. The highest number of fires - 32 took place in 2002, and the least - 0 in 2013. The data has a dropping trend.
 When looking into fire subcategories, the most reports belonged to: Structure Fires (50.0%), and Outside Fires (25.4%).