Estimated zip code population in 2022: 25,795 Zip code population in 2010: 27,262 Zip code population in 2000: 28,961
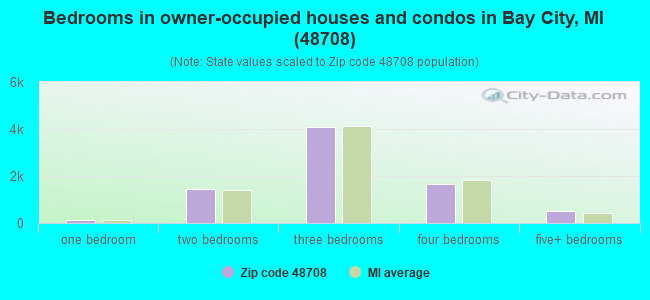
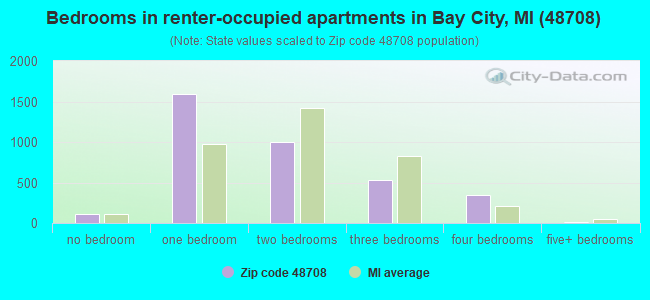
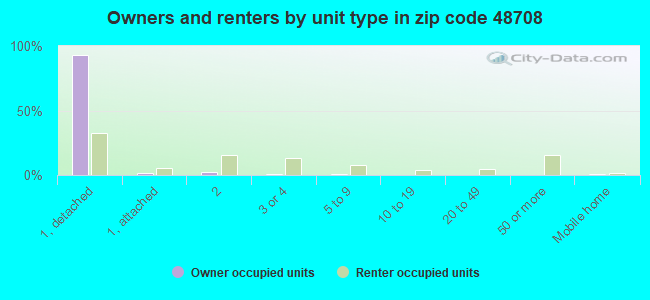
Houses and condos: 12,491 Renter-occupied apartments: 3,552
% of renters here:
31%
State:
27%
March 2022 cost of living index in zip code 48708: 79.7 (low, U.S. average is 100)
Land area: 27.9 sq. mi. Water area: 0.8 sq. mi.
Population density: 926 people per square mile
(low).
OSM Map
General Map
Google Map
MSN Map
OSM Map
General Map
Google Map
MSN Map
OSM Map
General Map
Google Map
MSN Map
OSM Map
General Map
Google Map
MSN Map
Please wait while loading the map...
Real estate property taxes paid for housing units in 2022:
This zip code:
1.8% ($1,778)
Michigan:
1.2% ($2,746)
Median real estate property taxes paid for housing units with mortgages in 2022: $1,834 (1.8%) Median real estate property taxes paid for housing units with no mortgage in 2022: $1,728 (1.7%)
Business Search- 14 Million verified businesses
Males: 12,655
(49.1%)
Females: 13,140
(50.9%)
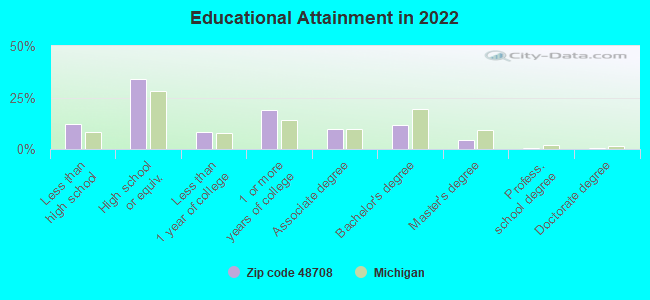
For population 25 years and over in 48708:
High school or higher: 87.3%
Bachelor's degree or higher: 16.9%
Graduate or professional degree: 5.2%
Unemployed: 5.2%
Mean travel time to work (commute): 22.4 minutes
For population 15 years and over in 48708:
Never married: 36.6%
Now married: 40.5%
Separated: 2.1%
Widowed: 6.6%
Divorced: 14.2%
Zip code 48708 compared to state average:
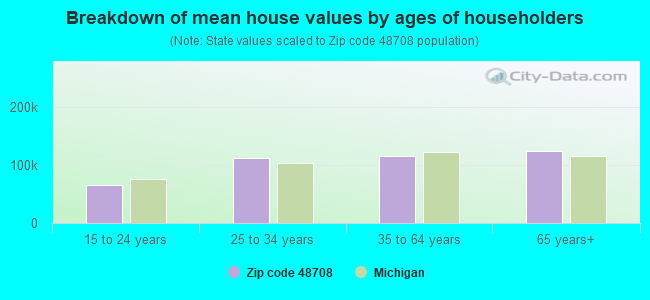
Median house value below state average.
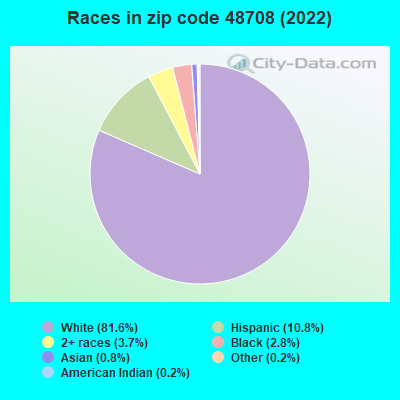
Black race population percentage significantly below state average.
Hispanic race population percentage above state average.
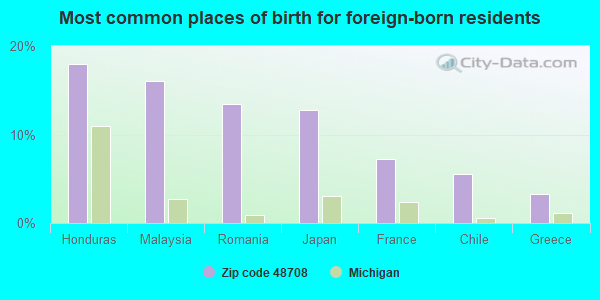
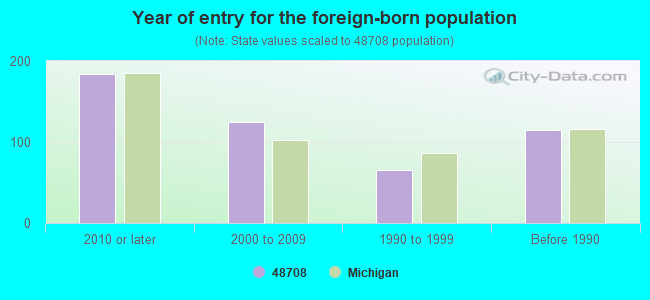
Foreign-born population percentage significantly below state average.
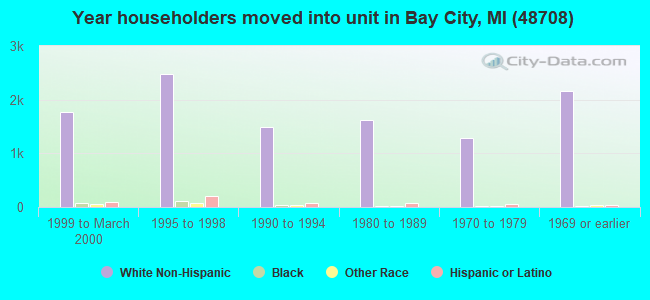
Length of stay since moving in significantly above state average.
House age above state average.
Percentage of population with a bachelor's degree or higher below state average.
Averages for the 2020 tax year for zip code 48708, filed in 2021:
Average Adjusted Gross Income (AGI) in 2020: $45,662 (Individual Income Tax Returns)
Here:
$45,662
State:
$68,945
Salary/wage: $39,778 (reported on 76.6% of returns)
Here:
$39,778
State:
$57,142
(% of AGI for various income ranges: 1002.1% for AGIs below $25k, 3004.5% for AGIs $25k-50k, 5747.1% for AGIs $50k-75k, 8623.1% for AGIs $75k-100k, 15176.7% for AGIs $100k-200k, 63700.0% for AGIs over 200k)
Taxable interest for individuals: $1,125 (reported on 25.0% of returns)
This zip code:
$1,125
Michigan:
$1,630
(% of AGI for various income ranges: 13.9% for AGIs below $25k, 17.4% for AGIs $25k-50k, 31.2% for AGIs $50k-75k, 74.9% for AGIs $75k-100k, 116.7% for AGIs $100k-200k, 1588.3% for AGIs over 200k)
Ordinary dividends: $4,409 (reported on 13.3% of returns)
Here:
$4,409
State:
$6,972
(% of AGI for various income ranges: 19.8% for AGIs below $25k, 23.1% for AGIs $25k-50k, 66.9% for AGIs $50k-75k, 150.3% for AGIs $75k-100k, 239.8% for AGIs $100k-200k, 4645.0% for AGIs over 200k)
Net capital gain/loss in AGI: +$6,307 (reported on 11.4% of returns)
Here:
+$6,307
State:
+$20,064
(% of AGI for various income ranges: 5.9% for AGIs below $25k, 16.8% for AGIs $25k-50k, 62.9% for AGIs $50k-75k, 174.2% for AGIs $75k-100k, 410.5% for AGIs $100k-200k, 6721.7% for AGIs over 200k)
Profit/loss from business: +$7,885 (reported on 9.8% of returns)
Here:
+$7,885
State:
+$11,172
(% of AGI for various income ranges: 44.9% for AGIs below $25k, 76.9% for AGIs $25k-50k, 84.0% for AGIs $50k-75k, 115.1% for AGIs $75k-100k, 455.9% for AGIs $100k-200k, 2156.7% for AGIs over 200k)
Taxable individual retirement arrangement distribution: $16,221 (reported on 9.0% of returns)
48708:
$16,221
Michigan:
$19,803
(% of AGI for various income ranges: 42.4% for AGIs below $25k, 98.1% for AGIs $25k-50k, 219.2% for AGIs $50k-75k, 375.1% for AGIs $75k-100k, 847.5% for AGIs $100k-200k, 6128.3% for AGIs over 200k)
Total itemized deductions: $33,759 (reported on 2.2% of returns)
Here:
$33,759
State:
$34,117
(% of AGI for various income ranges: 28.1% for AGIs below $25k, 27.7% for AGIs $25k-50k, 107.9% for AGIs $50k-75k, 167.8% for AGIs $75k-100k, 344.9% for AGIs $100k-200k, 5318.3% for AGIs over 200k)
Charity contributions: $11,332 (reported on 1.7% of returns)
Here:
$11,332
State:
$13,548
(% of AGI for various income ranges: 5.7% for AGIs $25k-50k, 10.2% for AGIs $50k-75k, 18.4% for AGIs $75k-100k, 109.7% for AGIs $100k-200k, 2285.0% for AGIs over 200k)
Taxes paid: $7,154 (reported on 2.0% of returns)
48708:
$7,154
State:
$7,972
(% of AGI for various income ranges: 1.9% for AGIs below $25k, 3.6% for AGIs $25k-50k, 17.0% for AGIs $50k-75k, 32.5% for AGIs $75k-100k, 97.8% for AGIs $100k-200k, 1040.0% for AGIs over 200k)
Earned income credit: $2,180 (reported on 18.8% of returns)
Here:
$2,180
State:
$2,251
(% of AGI for various income ranges: 83.9% for AGIs below $25k, 69.4% for AGIs $25k-50k, 1.5% for AGIs $50k-75k)
Percentage of individuals using paid preparers for their 2020 taxes: 95.0%
Here:
95%
State:
93%
(% for various income ranges: 94.4% for AGIs below $25k, 95.8% for AGIs $25k-50k, 94.7% for AGIs $50k-75k, 95.8% for AGIs $75k-100k, 95.0% for AGIs $100k-200k, 94.4% for AGIs over 200k)
Averages for the 2012 tax year for zip code 48708, filed in 2013:
Average Adjusted Gross Income (AGI) in 2012: $37,285 (Individual Income Tax Returns)
Here:
$37,285
State:
$55,609
Salary/wage: $32,413 (reported on 82.1% of returns)
Here:
$32,413
State:
$46,782
(% of AGI for various income ranges: 69.9% for AGIs below $25k, 73.0% for AGIs $25k-50k, 74.6% for AGIs $50k-75k, 77.1% for AGIs $75k-100k, 73.3% for AGIs $100k-200k, 51.7% for AGIs over 200k)
Taxable interest for individuals: $1,074 (reported on 31.3% of returns)
This zip code:
$1,074
Michigan:
$1,491
(% of AGI for various income ranges: 1.0% for AGIs below $25k, 0.7% for AGIs $25k-50k, 0.7% for AGIs $50k-75k, 0.5% for AGIs $75k-100k, 0.6% for AGIs $100k-200k, 2.6% for AGIs over 200k)
Ordinary dividends: $3,476 (reported on 15.0% of returns)
Here:
$3,476
State:
$6,225
(% of AGI for various income ranges: 1.0% for AGIs below $25k, 0.9% for AGIs $25k-50k, 0.8% for AGIs $50k-75k, 1.1% for AGIs $75k-100k, 1.5% for AGIs $100k-200k, 4.7% for AGIs over 200k)
Net capital gain/loss in AGI: +$3,042 (reported on 10.5% of returns)
Here:
+$3,042
State:
+$9,326
(% of AGI for various income ranges: 0.2% for AGIs $50k-75k, 0.3% for AGIs $75k-100k, 1.3% for AGIs $100k-200k, 5.9% for AGIs over 200k)
Profit/loss from business: +$10,034 (reported on 10.2% of returns)
Here:
+$10,034
State:
+$11,523
(% of AGI for various income ranges: 4.5% for AGIs below $25k, 1.4% for AGIs $25k-50k, 1.7% for AGIs $50k-75k, 1.6% for AGIs $75k-100k, 2.2% for AGIs $100k-200k, 7.5% for AGIs over 200k)
Taxable individual retirement arrangement distribution: $11,794 (reported on 9.7% of returns)
48708:
$11,794
Michigan:
$15,298
(% of AGI for various income ranges: 2.4% for AGIs below $25k, 2.4% for AGIs $25k-50k, 2.9% for AGIs $50k-75k, 3.0% for AGIs $75k-100k, 4.7% for AGIs $100k-200k, 3.4% for AGIs over 200k)
Self-employment retirement plans: $17,200 (reported on 0.3% of returns)
48708:
$17,200
Michigan:
$20,834
Total itemized deductions: $18,099 (21% of AGI, reported on 16.9% of returns)
Here:
$18,099
State:
$21,628
Here:
21.1% of AGI
State:
18.4% of AGI
(% of AGI for various income ranges: 4.8% for AGIs below $25k, 6.3% for AGIs $25k-50k, 7.5% for AGIs $50k-75k, 8.5% for AGIs $75k-100k, 12.1% for AGIs $100k-200k, 12.5% for AGIs over 200k)
Charity contributions: $3,423 (reported on 13.7% of returns)
Here:
$3,423
State:
$4,225
(% of AGI for various income ranges: 0.4% for AGIs below $25k, 0.7% for AGIs $25k-50k, 1.0% for AGIs $50k-75k, 1.2% for AGIs $75k-100k, 2.0% for AGIs $100k-200k, 3.3% for AGIs over 200k)
Taxes paid: $6,185 (reported on 16.9% of returns)
48708:
$6,185
State:
$8,327
(% of AGI for various income ranges: 0.9% for AGIs below $25k, 1.6% for AGIs $25k-50k, 2.3% for AGIs $50k-75k, 2.8% for AGIs $75k-100k, 4.8% for AGIs $100k-200k, 6.2% for AGIs over 200k)
Earned income credit: $2,129 (reported on 23.9% of returns)
Here:
$2,129
State:
$2,306
(% of AGI for various income ranges: 6.8% for AGIs below $25k, 1.2% for AGIs $25k-50k)
Percentage of individuals using paid preparers for their 2012 taxes: 56.4%
Here:
56%
State:
57%
(% for various income ranges: 51.0% for AGIs below $25k, 57.8% for AGIs $25k-50k, 64.5% for AGIs $50k-75k, 65.4% for AGIs $75k-100k, 70.5% for AGIs $100k-200k, 83.3% for AGIs over 200k)
Averages for the 2004 tax year for zip code 48708, filed in 2005:
Average Adjusted Gross Income (AGI) in 2004: $34,311 (Individual Income Tax Returns)
Here:
$34,311
State:
$48,204
Salary/wage: $31,065 (reported on 85.6% of returns)
Here:
$31,065
State:
$42,791
(% of AGI for various income ranges: 82.4% for AGIs below $10k, 68.9% for AGIs $10k-25k, 78.2% for AGIs $25k-50k, 83.6% for AGIs $50k-75k, 83.6% for AGIs $75k-100k, 71.1% for AGIs over 100k)
Taxable interest for individuals: $1,606 (reported on 45.2% of returns)
This zip code:
$1,606
Michigan:
$1,725
(% of AGI for various income ranges: 4.4% for AGIs below $10k, 3.1% for AGIs $10k-25k, 1.4% for AGIs $25k-50k, 1.1% for AGIs $50k-75k, 1.1% for AGIs $75k-100k, 3.7% for AGIs over 100k)
Taxable dividends: $2,736 (reported on 20.6% of returns)
Here:
$2,736
State:
$3,420
(% of AGI for various income ranges: 2.3% for AGIs below $10k, 1.4% for AGIs $10k-25k, 0.7% for AGIs $25k-50k, 0.7% for AGIs $50k-75k, 0.8% for AGIs $75k-100k, 4.4% for AGIs over 100k)
Net capital gain/loss: +$2,948 (reported on 13.4% of returns)
Here:
+$2,948
State:
+$8,532
(% of AGI for various income ranges: -1.0% for AGIs below $10k, -0.2% for AGIs $10k-25k, 0.3% for AGIs $25k-50k, 0.5% for AGIs $50k-75k, 0.9% for AGIs $75k-100k, 4.4% for AGIs over 100k)
Profit/loss from business: +$7,390 (reported on 11.0% of returns)
Here:
+$7,390
State:
+$9,547
(% of AGI for various income ranges: 4.2% for AGIs below $10k, 2.9% for AGIs $10k-25k, 1.0% for AGIs $25k-50k, 1.0% for AGIs $50k-75k, 1.4% for AGIs $75k-100k, 5.4% for AGIs over 100k)
IRA payment deduction: $2,477 (reported on 2.1% of returns)
48708:
$2,477
Michigan:
$2,875
(% of AGI for various income ranges: 0.3% for AGIs below $10k, 0.2% for AGIs $10k-25k, 0.2% for AGIs $25k-50k, 0.1% for AGIs $50k-75k, 0.1% for AGIs $75k-100k, 0.1% for AGIs over 100k)
Self-employed pension: $14,136 (reported on 0.4% of returns)
Here:
$14,136
Michigan:
$13,826
Total itemized deductions: $14,410 (21% of AGI, reported on 24.1% of returns)
Here:
$14,410
State:
$18,509
Here:
20.8% of AGI
State:
20.7% of AGI
(% of AGI for various income ranges: 5.8% for AGIs below $10k, 6.8% for AGIs $10k-25k, 9.4% for AGIs $25k-50k, 10.8% for AGIs $50k-75k, 11.9% for AGIs $75k-100k, 12.1% for AGIs over 100k)
Charity contributions deductions: $2,551 (4% of AGI, reported on 21.5% of returns)
Here:
$2,551
State:
$3,365
Here:
3.6% of AGI
State:
3.6% of AGI
(% of AGI for various income ranges: 0.4% for AGIs below $10k, 0.8% for AGIs $10k-25k, 1.0% for AGIs $25k-50k, 1.6% for AGIs $50k-75k, 1.9% for AGIs $75k-100k, 2.8% for AGIs over 100k)
Total tax: $4,659 (reported on 69.8% of returns)
48708:
$4,659
State:
$7,691
(% of AGI for various income ranges: 1.9% for AGIs below $10k, 3.6% for AGIs $10k-25k, 6.3% for AGIs $25k-50k, 8.7% for AGIs $50k-75k, 10.9% for AGIs $75k-100k, 18.3% for AGIs over 100k)
Earned income credit: $1,637 (reported on 20.0% of returns)
Here:
$1,637
State:
$1,737
Percentage of individuals using paid preparers for their 2004 taxes: 64.0%
Here:
64%
State:
60%
(% for various income ranges: 57.0% for AGIs below $10k, 65.5% for AGIs $10k-25k, 64.5% for AGIs $25k-50k, 65.8% for AGIs $50k-75k, 71.7% for AGIs $75k-100k, 76.0% for AGIs over 100k)
Likely homosexual households (counted as self-reported same-sex unmarried-partner households)
Lesbian couples: 0.1% of all households
Gay men: 0.4% of all households
Household received Food Stamps/SNAP in the past 12 months: 2,535 Household did not receive Food Stamps/SNAP in the past 12 months: 9,012
Women who had a birth in the past 12 months: 141 (31 now married, 105 unmarried) Women who did not have a birth in the past 12 months: 5,822 (1,941 now married, 3,889 unmarried)
Housing units in zip code 48708 with a mortgage: 4,035 (245 second mortgage, 18 home equity loan, 153 both second mortgage and home equity loan) Houses without a mortgage: 101
Median monthly owner costs for units with a mortgage: $1,022 Median monthly owner costs for units without a mortgage: $480
Residents with income below the poverty level in 2022:
This zip code:
22.6%
Whole state:
13.4%
Residents with income below 50% of the poverty level in 2022:
This zip code:
13.9%
Whole state:
6.9%
Median number of rooms in houses and condos:
Here:
6.3
State:
6.5
Median number of rooms in apartments:
Here:
3.8
State:
4.3
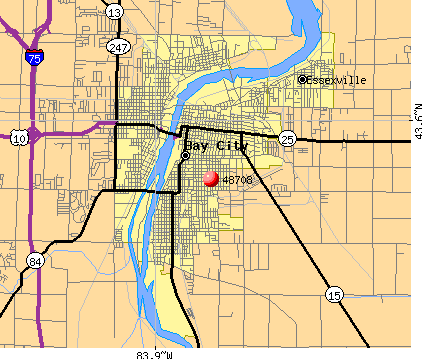
Notable locations in this zip code not listed on our city pages
Notable locations in zip code 48708: Bay County Fairground (A), Bay City Station (B), Bay City Fire Department Station 2 (C), Bay County Building (D), Law Enforcement Center (E), Bay City Hall (F), Bay County Historical Museum (G), Delta College Planetarium (H), Alice and Jack Wirt Public Library (I), South Side Branch Library (J), Bay City Fire and Rescue Station 1 (K), Trombley House (L), Bay Regional Medical Center Emergency Medical Services Station 1 and 2 (M), Portsmouth Township Fire Department Station 18 (N). Display/hide their locations on the map
Churches in zip code 48708 include: Unity of Bay City Church (A), Second Baptist Church (B), First Church of Nazarene (C), Trinity Lutheran Church (D), South Baptist Church (E), Saint Hyacinth Church (F), Saint Stanislaus Church (G), Saint Joseph's Church (H), First Presbyterian Church (I). Display/hide their locations on the map
Cemeteries: Elm Lawn Cemetery (1), Green Ridge Cemetery (2), Hebrew Cemetery (3), Polish Cemetery (4), Corlis Cemetery (5), Pine Ridge Cemetery (6), Seamon Cemetery (7). Display/hide their locations on the map
Parks in zip code 48708 include: Wenonah Park (1), Beet Sugar Historical Marker (2), Bay City Historical Marker (3), Center Avenue Historical Marker (4), First Presbyterian Church Historical Marker (5), James Clements Memorial Airport Historical Marker (6), Saint Joseph Catholic Church Historical Marker (7), Saint Stanislaus Kostka Roman Catholic Church Historical Marker (8), Ten Hours or No Sawdust Historical Marker (9). Display/hide their locations on the map
2,182 married couples with children.
2,334 single-parent households (525 men, 1,809 women).
96.0% of residents of 48708 zip code speak English at home.
2.4% of residents speak Spanish at home (84% very well, 14% well, 2% not well).
0.8% of residents speak other Indo-European language at home (70% very well, 30% well).
0.6% of residents speak Asian or Pacific Island language at home (82% very well, 18% well).
Foreign born population: 309 (1.2%) (78.0% of them are naturalized citizens)
Major facilities with environmental interests located in this zip code:
GENERAL MOTORS CORPORATION (100 FITZGERALD STREET in BAY CITY, MI)
AIR MAJOR (AIRS/AFS) AIR SYNTHETIC MINOR (AIRS/AFS) (Integrated Compliance Information System) - ICIS-05-1991-0105, FORMAL ENFORCEMENT ACTION, ICIS-05-1991-0031, COMPLIANCE ACTIVITY (Tracking inspections of insecticide, fungicide, and rodenticide, and toxic substances) CRITERIA AND HAZARDOUS AIR POLLUTANT INVENTORY (Inventory of air pollution sources) National Pollutant Discharge Elimination System MAJOR (Tracking pollutant discharge elimination systems) - permit AIR MAJOR ("Best Available" air pollution technologies tracking) HAZARDOUS WASTE BIENNIAL REPORTER (Resource Conservation and Recovery Act (tracking hazardous waste)) Large Quantity Generators, more that 1000 kg of hazardous waste/month (Resource Conservation and Recovery Act (tracking hazardous waste)) TSD (Resource Conservation and Recovery Act (tracking hazardous waste)) TRI REPORTER (Tracking of toxic chemicals releasing facilities) Business SIC classification: AUTOMOTIVE STAMPINGS; MOTOR VEHICLE PARTS AND ACCESSORIES Alternative names: GM-ENGINE DIV-BAY CITY, GM POWERTRAIN GROUP BAY CITY PLANT, GM PT - BAY CITY, GMC CHEVROLT MOTOR DIV., GMC CHEVROLT MOTOR DIV., GMC GMPT BAY CITY, GMC POWERTRAIN BAY CITY, GMC POWERTRAIN DIVISION, GMPT BAY CITY PLANT, GENERAL MOTORS, CPC BAY CITY PLT
BAY CITY ELECTRIC LIGHT AND POWER (900 S WATER ST in BAY CITY, MI)
AIR MINOR (AIRS/AFS) COMPLIANCE ACTIVITY (Tracking inspections of insecticide, fungicide, and rodenticide, and toxic substances) CRITERIA AND HAZARDOUS AIR POLLUTANT INVENTORY (Inventory of air pollution sources) (Resource Conservation and Recovery Act (tracking hazardous waste)) Business SIC classification: ELECTRIC SERVICES Organizations: BAY CITY CITY OF (CONTACT/OWNER)
Alternative names: BAY CITY ELECTRIC LGT & PWR, BAY CITY ELECTRIC LT & PWR, BAY CITY LIGHT & POWER
BAY CAST INCORPORATED (400 WEBSTER ST. in BAY CITY, MI)
AIR MINOR (AIRS/AFS) CRITERIA AND HAZARDOUS AIR POLLUTANT INVENTORY (Inventory of air pollution sources) (Resource Conservation and Recovery Act (tracking hazardous waste)) TRI REPORTER (Tracking of toxic chemicals releasing facilities) Business SIC and NAICS classification: STEEL FOUNDRIES Organizations: SCOTT L. HOLMAN (CONTACT/OPERATOR)
, HOLMAN SCOTT L (CONTACT/OWNER)
ACRA CAST INCORPORATED (1837 1ST ST in BAY CITY, MI)
(Integrated Compliance Information System) - ICIS-05-1985-0184, FORMAL ENFORCEMENT ACTION Conditionally Exempt Small Quantity Generators, less than 100 kg/month of hazardous waste (Resource Conservation and Recovery Act (tracking hazardous waste)) - notification Business SIC classification: STEEL INVESTMENT FOUNDRIES
GENERAL PARTS INC (508 MCGRAW in BAY CITY, MI)
(Resource Conservation and Recovery Act (tracking hazardous waste)) Organizations: CARQUEST DISTRIBUTION CENTER (CONTACT/OPERATOR)
Alternative names: CARQUEST DISTRIBUTION CENTER
GODDEYNE PLATING CO (242 NORTH WATER STREET in BAY CITY, MI)
(Resource Conservation and Recovery Act (tracking hazardous waste)) TRI REPORTER (Tracking of toxic chemicals releasing facilities) Business SIC classification: ELECTROPLATING, PLATING, POLISHING, ANODIZING, AND COLORING Organizations: CARD L LETHERER B (CONTACT/OPERATOR)
Alternative names: GODDEYNE MFG CO
MI DEPT/TRANSPORTATION BRIDGE (I-75 OVER DUTCH CREEK in BAY CITY, MI)
(Resource Conservation and Recovery Act (tracking hazardous waste)) Organizations: MICH DEPT OF TRANSPORTATION (CONTACT/OPERATOR)
Alternative names: MIDOT BRIDGE I-75 OVER DUTCH CREEK
MI DEPT/TRANSPORTATION BRIDGE (M-25 OVER SAGINAW RIVER in BAY CITY, MI)
(Resource Conservation and Recovery Act (tracking hazardous waste)) Organizations: MICH DEPT OF TRANSPORTATION (CONTACT/OPERATOR)
Alternative names: MIDOT BRIDGE M-25 OVER SAGINAW RIVER
AMOCO OIL CO 5007 (4TH S SAGINAW in BAY CITY, MI)
(Resource Conservation and Recovery Act (tracking hazardous waste)) Organizations: AMOCO OIL COMPANY (CONTACT/OWNER)
Housing units lacking complete plumbing facilities: 2.9% Housing units lacking complete kitchen facilities: 3.6%
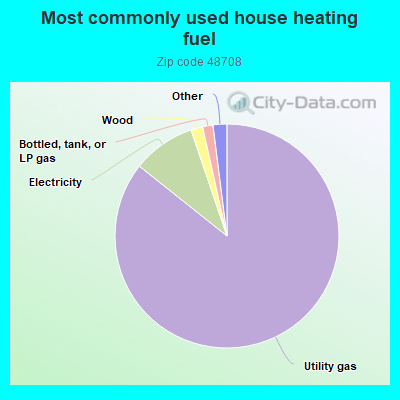
85.8%Utility gas
9.1%Electricity
1.7%Wood
1.5%Bottled, tank, or LP gas
0.9%Other fuel
0.8%Fuel oil, kerosene, etc.
Population in 1990: 29,918.
Place of birth for U.S.-born residents:
This state: 22,271
Northeast: 410
Midwest: 925
South: 1,283
West: 373
62% of the 48708 zip code residents lived in the same house 5 years ago. Out of people who lived in different houses, 72% lived in this county. Out of people who lived in different counties, 50% lived in Michigan.
88% of the 48708 zip code residents lived in the same house 1 year ago. Out of people who lived in different houses, 58% moved from this county. Out of people who lived in different houses, 22% moved from different county within same state. Out of people who lived in different houses, 16% moved from different state. Out of people who lived in different houses, 4% moved from abroad.
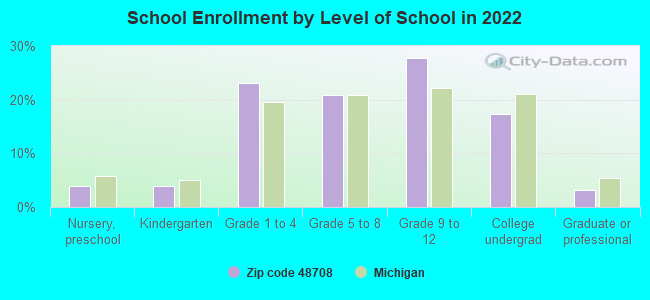
Private vs. public school enrollment:
Students in private schools in grades 1 to 8 (elementary and middle school): 385
Here:
16.6%
Michigan:
12.4%
Students in private schools in grades 9 to 12 (high school): 135
Here:
9.3%
Michigan:
9.8%
Students in private undergraduate colleges: 89
Here:
9.8%
Michigan:
14.9%
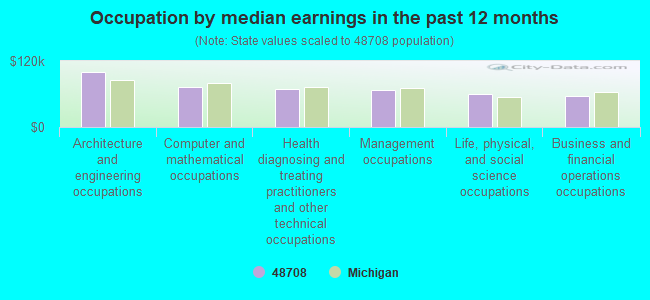
Occupation by median earnings in the past 12 months ($)
100,315Architecture and engineering occupations
73,539Computer and mathematical occupations
68,821Health diagnosing and treating practitioners and other technical occupations
67,151Management occupations
59,702Life, physical, and social science occupations
55,854Business and financial operations occupations
Companies with federal contracts located in this zip code (BAY CITY, MI):
CARBONE LORRAINE NORTH AMERICA (900 HARRISON ST) : $675,000 in 4 contractsfrom 1999 to 2000
$187,500 with Defense Logistics Agency for Electrical Contact Brushes and Electrodes. Signed on 1999-11-17. Completion date: 2000-02-11.
$187,500, same as above.Signed on 2000-04-24. Completion date: 2000-07-19.
$165,000, same as above.Signed on 2000-06-26. Completion date: 2000-09-20.
$135,000, same as above.Signed on 2000-02-09. Completion date: 2000-05-05.
J M J JANITORIAL,SERVICES (2621 SIMON ST; small business) : $155,882 in 8 contractsfrom 2001 to 2005
Contracts for Custodial Janitorial Services by Navy Signed by year:2000: $0; 2001: $25,380; 2002: $16,995; 2003: $35,711; 2004: $26,947; 2005: $50,849; 2006: $0.
Biggest contracts:
$50,849 with Navy for Custodial Janitorial Services. Signed on 2005-07-23. Completion date: 2004-07-31.
$26,947, same as above.Signed on 2004-08-06. Completion date: 2004-07-31.
$26,423, same as above.Signed on 2003-10-01. Completion date: 2004-07-31.
$25,380, same as above.Signed on 2001-10-01. Completion date: 2002-09-30.
DENA L DONALDSON (818 18TH; small business) : $47,020 in 6 contractsfrom 2003 to 2006
Contracts for Custodial Janitorial Services by Army Signed by year:2000: $0; 2001: $0; 2002: $0; 2003: $11,200; 2004: $11,940; 2005: $11,940; 2006: $11,940.
Biggest contracts:
$11,940 with Army for Custodial Janitorial Services. Signed on 2006-01-11. Completion date: 2006-02-28.
$11,940, same as above.Signed on 2005-03-01. Completion date: 2006-02-28.
$11,940, same as above.Signed on 2004-03-01. Completion date: 2005-02-28.
$11,200, same as above.Signed on 2003-04-30. Completion date: 2004-02-29.
SCIAX AMERICA, INC (300 CENTER AVE STE 202; small business)
$24,600 with Navy for Miscellaneous Communication Equipment. Signed on 2004-09-22. Completion date: 2004-11-26.
Top industries in this zip code by the number of employees in 2005:
Health Care and Social Assistance: General Medical and Surgical Hospitals (over 1000 employees: 1 establishment)
2002 - 2018 National Fire Incident Reporting System (NFIRS) incidents
Based on the data from the years 2002 - 2018 the average number of fires per year is 86. The highest number of fires - 148 took place in 2010, and the least - 14 in 2005. The data has a declining trend.
When looking into fire subcategories, the most incidents belonged to: Structure Fires (51.1%), and Outside Fires (30.9%).
Fire incident types reported to NFIRS in Zip Code 48708

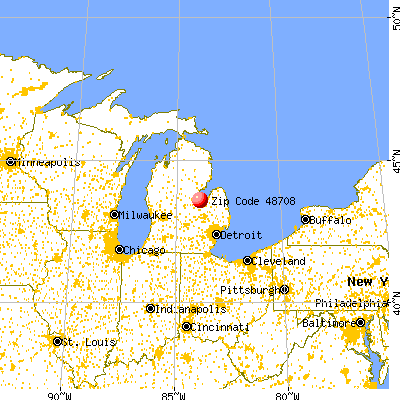


 Nearest zip codes: 48732, 48747, 48706, 48724, 48604, 48710.
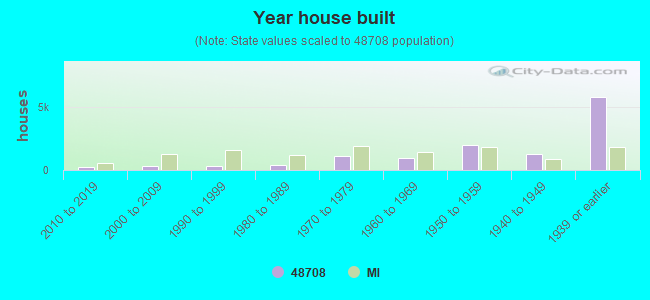


 Based on the data from the years 2002 - 2018 the average number of fires per year is 86. The highest number of fires - 148 took place in 2010, and the least - 14 in 2005. The data has a declining trend.
 When looking into fire subcategories, the most incidents belonged to: Structure Fires (51.1%), and Outside Fires (30.9%).