Estimated zip code population in 2022: 11,765
Zip code population in 2010: 13,074
Zip code population in 2000: 11,835
Houses and condos: 4,663
Renter-occupied apartments: 1,002
% of renters here:
23%State:
27%
March 2022 cost of living index in zip code 48604: 81.9
(low, U.S. average is 100)
Land area: 24.9
sq. mi.
Water area: 1.3
sq. mi.
Population density: 472 people per square mile (low).
OSM Map
General Map
Google Map
MSN Map
OSM Map
General Map
Google Map
MSN Map
OSM Map
General Map
Google Map
MSN Map
OSM Map
General Map
Google Map
MSN Map
Please wait while loading the map...
Real estate property taxes paid for housing units in 2022:
This zip code:
1.9% ($1,835)Michigan:
1.2% ($2,746)
Median real estate property taxes paid for housing units with mortgages in 2022: $1,947 (1.9%)
Median real estate property taxes paid for housing units with no mortgage in 2022: $1,727 (2.0%)
Profiles of local businesses
Business Search - 14 Million verified businesses
Males: 5,400 Females: 6,365
For population 25 years and over in 48604:
High school or higher: 94.1%Bachelor's degree or higher: 23.6%Graduate or professional degree: 5.7%Unemployed: 6.2%Mean travel time to work (commute): 15.7 minutes
For population 15 years and over in 48604:
Never married: 56.4%Now married: 30.4%Separated: 0.8%Widowed: 4.6%Divorced: 7.8%
Zip code 48604 compared to state average:
Median house value significantly below state average. Median age significantly below state average. Foreign-born population percentage significantly below state average. Length of stay since moving in significantly above state average. Number of college students significantly above state average. Percentage of population with a bachelor's degree or higher below state average. 9,106 77.4% White 1,161 9.9% Black 979 8.3% Hispanic or Latino 382 3.2% Two or more races 63 0.5% Asian 43 0.4% American Indian 22 0.2% Some other race 4 0.03% Native Hawaiian and Other
Data:
Median household income ($)
Median household income (% change since 2000)
Household income diversity
Ratio of average income to average house value (%)
Ratio of average income to average rent
Median household income ($) - White
Median household income ($) - Black or African American
Median household income ($) - Asian
Median household income ($) - Hispanic or Latino
Median household income ($) - American Indian and Alaska Native
Median household income ($) - Multirace
Median household income ($) - Other Race
Median household income for houses/condos with a mortgage ($)
Median household income for apartments without a mortgage ($)
Races - White alone (%)
Races - White alone (% change since 2000)
Races - Black alone (%)
Races - Black alone (% change since 2000)
Races - American Indian alone (%)
Races - American Indian alone (% change since 2000)
Races - Asian alone (%)
Races - Asian alone (% change since 2000)
Races - Hispanic (%)
Races - Hispanic (% change since 2000)
Races - Native Hawaiian and Other Pacific Islander alone (%)
Races - Native Hawaiian and Other Pacific Islander alone (% change since 2000)
Races - Two or more races (%)
Races - Two or more races (% change since 2000)
Races - Other race alone (%)
Races - Other race alone (% change since 2000)
Racial diversity
Unemployment (%)
Unemployment (% change since 2000)
Unemployment (%) - White
Unemployment (%) - Black or African American
Unemployment (%) - Asian
Unemployment (%) - Hispanic or Latino
Unemployment (%) - American Indian and Alaska Native
Unemployment (%) - Multirace
Unemployment (%) - Other Race
Population density (people per square mile)
Population - Males (%)
Population - Females (%)
Population - Males (%) - White
Population - Males (%) - Black or African American
Population - Males (%) - Asian
Population - Males (%) - Hispanic or Latino
Population - Males (%) - American Indian and Alaska Native
Population - Males (%) - Multirace
Population - Males (%) - Other Race
Population - Females (%) - White
Population - Females (%) - Black or African American
Population - Females (%) - Asian
Population - Females (%) - Hispanic or Latino
Population - Females (%) - American Indian and Alaska Native
Population - Females (%) - Multirace
Population - Females (%) - Other Race
Coronavirus confirmed cases (Apr 27, 2024)
Deaths caused by coronavirus (Apr 27, 2024)
Coronavirus confirmed cases (per 100k population) (Apr 27, 2024)
Deaths caused by coronavirus (per 100k population) (Apr 27, 2024)
Daily increase in number of cases (Apr 27, 2024)
Weekly increase in number of cases (Apr 27, 2024)
Cases doubled (in days) (Apr 27, 2024)
Hospitalized patients (Apr 18, 2022)
Negative test results (Apr 18, 2022)
Total test results (Apr 18, 2022)
COVID Vaccine doses distributed (per 100k population) (Sep 19, 2023)
COVID Vaccine doses administered (per 100k population) (Sep 19, 2023)
COVID Vaccine doses distributed (Sep 19, 2023)
COVID Vaccine doses administered (Sep 19, 2023)
Likely homosexual households (%)
Likely homosexual households (% change since 2000)
Likely homosexual households - Lesbian couples (%)
Likely homosexual households - Lesbian couples (% change since 2000)
Likely homosexual households - Gay men (%)
Likely homosexual households - Gay men (% change since 2000)
Cost of living index
Median gross rent ($)
Median contract rent ($)
Median monthly housing costs ($)
Median house or condo value ($)
Median house or condo value ($ change since 2000)
Mean house or condo value by units in structure - 1, detached ($)
Mean house or condo value by units in structure - 1, attached ($)
Mean house or condo value by units in structure - 2 ($)
Mean house or condo value by units in structure by units in structure - 3 or 4 ($)
Mean house or condo value by units in structure - 5 or more ($)
Mean house or condo value by units in structure - Boat, RV, van, etc. ($)
Mean house or condo value by units in structure - Mobile home ($)
Median house or condo value ($) - White
Median house or condo value ($) - Black or African American
Median house or condo value ($) - Asian
Median house or condo value ($) - Hispanic or Latino
Median house or condo value ($) - American Indian and Alaska Native
Median house or condo value ($) - Multirace
Median house or condo value ($) - Other Race
Median resident age
Resident age diversity
Median resident age - Males
Median resident age - Females
Median resident age - White
Median resident age - Black or African American
Median resident age - Asian
Median resident age - Hispanic or Latino
Median resident age - American Indian and Alaska Native
Median resident age - Multirace
Median resident age - Other Race
Median resident age - Males - White
Median resident age - Males - Black or African American
Median resident age - Males - Asian
Median resident age - Males - Hispanic or Latino
Median resident age - Males - American Indian and Alaska Native
Median resident age - Males - Multirace
Median resident age - Males - Other Race
Median resident age - Females - White
Median resident age - Females - Black or African American
Median resident age - Females - Asian
Median resident age - Females - Hispanic or Latino
Median resident age - Females - American Indian and Alaska Native
Median resident age - Females - Multirace
Median resident age - Females - Other Race
Commute - mean travel time to work (minutes)
Travel time to work - Less than 5 minutes (%)
Travel time to work - Less than 5 minutes (% change since 2000)
Travel time to work - 5 to 9 minutes (%)
Travel time to work - 5 to 9 minutes (% change since 2000)
Travel time to work - 10 to 19 minutes (%)
Travel time to work - 10 to 19 minutes (% change since 2000)
Travel time to work - 20 to 29 minutes (%)
Travel time to work - 20 to 29 minutes (% change since 2000)
Travel time to work - 30 to 39 minutes (%)
Travel time to work - 30 to 39 minutes (% change since 2000)
Travel time to work - 40 to 59 minutes (%)
Travel time to work - 40 to 59 minutes (% change since 2000)
Travel time to work - 60 to 89 minutes (%)
Travel time to work - 60 to 89 minutes (% change since 2000)
Travel time to work - 90 or more minutes (%)
Travel time to work - 90 or more minutes (% change since 2000)
Marital status - Never married (%)
Marital status - Now married (%)
Marital status - Separated (%)
Marital status - Widowed (%)
Marital status - Divorced (%)
Median family income ($)
Median family income (% change since 2000)
Median non-family income ($)
Median non-family income (% change since 2000)
Median per capita income ($)
Median per capita income (% change since 2000)
Median family income ($) - White
Median family income ($) - Black or African American
Median family income ($) - Asian
Median family income ($) - Hispanic or Latino
Median family income ($) - American Indian and Alaska Native
Median family income ($) - Multirace
Median family income ($) - Other Race
Median year house/condo built
Median year apartment built
Year house built - Built 2005 or later (%)
Year house built - Built 2000 to 2004 (%)
Year house built - Built 1990 to 1999 (%)
Year house built - Built 1980 to 1989 (%)
Year house built - Built 1970 to 1979 (%)
Year house built - Built 1960 to 1969 (%)
Year house built - Built 1950 to 1959 (%)
Year house built - Built 1940 to 1949 (%)
Year house built - Built 1939 or earlier (%)
Average household size
Household density (households per square mile)
Average household size - White
Average household size - Black or African American
Average household size - Asian
Average household size - Hispanic or Latino
Average household size - American Indian and Alaska Native
Average household size - Multirace
Average household size - Other Race
Occupied housing units (%)
Vacant housing units (%)
Owner occupied housing units (%)
Renter occupied housing units (%)
Vacancy status - For rent (%)
Vacancy status - For sale only (%)
Vacancy status - Rented or sold, not occupied (%)
Vacancy status - For seasonal, recreational, or occasional use (%)
Vacancy status - For migrant workers (%)
Vacancy status - Other vacant (%)
Residents with income below the poverty level (%)
Residents with income below 50% of the poverty level (%)
Children below poverty level (%)
Poor families by family type - Married-couple family (%)
Poor families by family type - Male, no wife present (%)
Poor families by family type - Female, no husband present (%)
Poverty status for native-born residents (%)
Poverty status for foreign-born residents (%)
Poverty among high school graduates not in families (%)
Poverty among people who did not graduate high school not in families (%)
Residents with income below the poverty level (%) - White
Residents with income below the poverty level (%) - Black or African American
Residents with income below the poverty level (%) - Asian
Residents with income below the poverty level (%) - Hispanic or Latino
Residents with income below the poverty level (%) - American Indian and Alaska Native
Residents with income below the poverty level (%) - Multirace
Residents with income below the poverty level (%) - Other Race
Air pollution - Air Quality Index (AQI)
Air pollution - CO
Air pollution - NO2
Air pollution - SO2
Air pollution - Ozone
Air pollution - PM10
Air pollution - PM25
Air pollution - Pb
Crime - Murders per 100,000 population
Crime - Rapes per 100,000 population
Crime - Robberies per 100,000 population
Crime - Assaults per 100,000 population
Crime - Burglaries per 100,000 population
Crime - Thefts per 100,000 population
Crime - Auto thefts per 100,000 population
Crime - Arson per 100,000 population
Crime - City-data.com crime index
Crime - Violent crime index
Crime - Property crime index
Crime - Murders per 100,000 population (5 year average)
Crime - Rapes per 100,000 population (5 year average)
Crime - Robberies per 100,000 population (5 year average)
Crime - Assaults per 100,000 population (5 year average)
Crime - Burglaries per 100,000 population (5 year average)
Crime - Thefts per 100,000 population (5 year average)
Crime - Auto thefts per 100,000 population (5 year average)
Crime - Arson per 100,000 population (5 year average)
Crime - City-data.com crime index (5 year average)
Crime - Violent crime index (5 year average)
Crime - Property crime index (5 year average)
1996 Presidential Elections Results (%) - Democratic Party (Clinton)
1996 Presidential Elections Results (%) - Republican Party (Dole)
1996 Presidential Elections Results (%) - Other
2000 Presidential Elections Results (%) - Democratic Party (Gore)
2000 Presidential Elections Results (%) - Republican Party (Bush)
2000 Presidential Elections Results (%) - Other
2004 Presidential Elections Results (%) - Democratic Party (Kerry)
2004 Presidential Elections Results (%) - Republican Party (Bush)
2004 Presidential Elections Results (%) - Other
2008 Presidential Elections Results (%) - Democratic Party (Obama)
2008 Presidential Elections Results (%) - Republican Party (McCain)
2008 Presidential Elections Results (%) - Other
2012 Presidential Elections Results (%) - Democratic Party (Obama)
2012 Presidential Elections Results (%) - Republican Party (Romney)
2012 Presidential Elections Results (%) - Other
2016 Presidential Elections Results (%) - Democratic Party (Clinton)
2016 Presidential Elections Results (%) - Republican Party (Trump)
2016 Presidential Elections Results (%) - Other
2020 Presidential Elections Results (%) - Democratic Party (Biden)
2020 Presidential Elections Results (%) - Republican Party (Trump)
2020 Presidential Elections Results (%) - Other
Ancestries Reported - Arab (%)
Ancestries Reported - Czech (%)
Ancestries Reported - Danish (%)
Ancestries Reported - Dutch (%)
Ancestries Reported - English (%)
Ancestries Reported - French (%)
Ancestries Reported - French Canadian (%)
Ancestries Reported - German (%)
Ancestries Reported - Greek (%)
Ancestries Reported - Hungarian (%)
Ancestries Reported - Irish (%)
Ancestries Reported - Italian (%)
Ancestries Reported - Lithuanian (%)
Ancestries Reported - Norwegian (%)
Ancestries Reported - Polish (%)
Ancestries Reported - Portuguese (%)
Ancestries Reported - Russian (%)
Ancestries Reported - Scotch-Irish (%)
Ancestries Reported - Scottish (%)
Ancestries Reported - Slovak (%)
Ancestries Reported - Subsaharan African (%)
Ancestries Reported - Swedish (%)
Ancestries Reported - Swiss (%)
Ancestries Reported - Ukrainian (%)
Ancestries Reported - United States (%)
Ancestries Reported - Welsh (%)
Ancestries Reported - West Indian (%)
Ancestries Reported - Other (%)
Educational Attainment - No schooling completed (%)
Educational Attainment - Less than high school (%)
Educational Attainment - High school or equivalent (%)
Educational Attainment - Less than 1 year of college (%)
Educational Attainment - 1 or more years of college (%)
Educational Attainment - Associate degree (%)
Educational Attainment - Bachelor's degree (%)
Educational Attainment - Master's degree (%)
Educational Attainment - Professional school degree (%)
Educational Attainment - Doctorate degree (%)
School Enrollment - Nursery, preschool (%)
School Enrollment - Kindergarten (%)
School Enrollment - Grade 1 to 4 (%)
School Enrollment - Grade 5 to 8 (%)
School Enrollment - Grade 9 to 12 (%)
School Enrollment - College undergrad (%)
School Enrollment - Graduate or professional (%)
School Enrollment - Not enrolled in school (%)
School enrollment - Public schools (%)
School enrollment - Private schools (%)
School enrollment - Not enrolled (%)
Median number of rooms in houses and condos
Median number of rooms in apartments
Housing units lacking complete plumbing facilities (%)
Housing units lacking complete kitchen facilities (%)
Density of houses
Urban houses (%)
Rural houses (%)
Households with people 60 years and over (%)
Households with people 65 years and over (%)
Households with people 75 years and over (%)
Households with one or more nonrelatives (%)
Households with no nonrelatives (%)
Population in households (%)
Family households (%)
Nonfamily households (%)
Population in families (%)
Family households with own children (%)
Median number of bedrooms in owner occupied houses
Mean number of bedrooms in owner occupied houses
Median number of bedrooms in renter occupied houses
Mean number of bedrooms in renter occupied houses
Median number of vehichles in owner occupied houses
Mean number of vehichles in owner occupied houses
Median number of vehichles in renter occupied houses
Mean number of vehichles in renter occupied houses
Mortgage status - with mortgage (%)
Mortgage status - with second mortgage (%)
Mortgage status - with home equity loan (%)
Mortgage status - with both second mortgage and home equity loan (%)
Mortgage status - without a mortgage (%)
Average family size
Average family size - White
Average family size - Black or African American
Average family size - Asian
Average family size - Hispanic or Latino
Average family size - American Indian and Alaska Native
Average family size - Multirace
Average family size - Other Race
Geographical mobility - Same house 1 year ago (%)
Geographical mobility - Moved within same county (%)
Geographical mobility - Moved from different county within same state (%)
Geographical mobility - Moved from different state (%)
Geographical mobility - Moved from abroad (%)
Place of birth - Born in state of residence (%)
Place of birth - Born in other state (%)
Place of birth - Native, outside of US (%)
Place of birth - Foreign born (%)
Housing units in structures - 1, detached (%)
Housing units in structures - 1, attached (%)
Housing units in structures - 2 (%)
Housing units in structures - 3 or 4 (%)
Housing units in structures - 5 to 9 (%)
Housing units in structures - 10 to 19 (%)
Housing units in structures - 20 to 49 (%)
Housing units in structures - 50 or more (%)
Housing units in structures - Mobile home (%)
Housing units in structures - Boat, RV, van, etc. (%)
House/condo owner moved in on average (years ago)
Renter moved in on average (years ago)
Year householder moved into unit - Moved in 1999 to March 2000 (%)
Year householder moved into unit - Moved in 1995 to 1998 (%)
Year householder moved into unit - Moved in 1990 to 1994 (%)
Year householder moved into unit - Moved in 1980 to 1989 (%)
Year householder moved into unit - Moved in 1970 to 1979 (%)
Year householder moved into unit - Moved in 1969 or earlier (%)
Means of transportation to work - Drove car alone (%)
Means of transportation to work - Carpooled (%)
Means of transportation to work - Public transportation (%)
Means of transportation to work - Bus or trolley bus (%)
Means of transportation to work - Streetcar or trolley car (%)
Means of transportation to work - Subway or elevated (%)
Means of transportation to work - Railroad (%)
Means of transportation to work - Ferryboat (%)
Means of transportation to work - Taxicab (%)
Means of transportation to work - Motorcycle (%)
Means of transportation to work - Bicycle (%)
Means of transportation to work - Walked (%)
Means of transportation to work - Other means (%)
Working at home (%)
Industry diversity
Most Common Industries - Agriculture, forestry, fishing and hunting, and mining (%)
Most Common Industries - Agriculture, forestry, fishing and hunting (%)
Most Common Industries - Mining, quarrying, and oil and gas extraction (%)
Most Common Industries - Construction (%)
Most Common Industries - Manufacturing (%)
Most Common Industries - Wholesale trade (%)
Most Common Industries - Retail trade (%)
Most Common Industries - Transportation and warehousing, and utilities (%)
Most Common Industries - Transportation and warehousing (%)
Most Common Industries - Utilities (%)
Most Common Industries - Information (%)
Most Common Industries - Finance and insurance, and real estate and rental and leasing (%)
Most Common Industries - Finance and insurance (%)
Most Common Industries - Real estate and rental and leasing (%)
Most Common Industries - Professional, scientific, and management, and administrative and waste management services (%)
Most Common Industries - Professional, scientific, and technical services (%)
Most Common Industries - Management of companies and enterprises (%)
Most Common Industries - Administrative and support and waste management services (%)
Most Common Industries - Educational services, and health care and social assistance (%)
Most Common Industries - Educational services (%)
Most Common Industries - Health care and social assistance (%)
Most Common Industries - Arts, entertainment, and recreation, and accommodation and food services (%)
Most Common Industries - Arts, entertainment, and recreation (%)
Most Common Industries - Accommodation and food services (%)
Most Common Industries - Other services, except public administration (%)
Most Common Industries - Public administration (%)
Occupation diversity
Most Common Occupations - Management, business, science, and arts occupations (%)
Most Common Occupations - Management, business, and financial occupations (%)
Most Common Occupations - Management occupations (%)
Most Common Occupations - Business and financial operations occupations (%)
Most Common Occupations - Computer, engineering, and science occupations (%)
Most Common Occupations - Computer and mathematical occupations (%)
Most Common Occupations - Architecture and engineering occupations (%)
Most Common Occupations - Life, physical, and social science occupations (%)
Most Common Occupations - Education, legal, community service, arts, and media occupations (%)
Most Common Occupations - Community and social service occupations (%)
Most Common Occupations - Legal occupations (%)
Most Common Occupations - Education, training, and library occupations (%)
Most Common Occupations - Arts, design, entertainment, sports, and media occupations (%)
Most Common Occupations - Healthcare practitioners and technical occupations (%)
Most Common Occupations - Health diagnosing and treating practitioners and other technical occupations (%)
Most Common Occupations - Health technologists and technicians (%)
Most Common Occupations - Service occupations (%)
Most Common Occupations - Healthcare support occupations (%)
Most Common Occupations - Protective service occupations (%)
Most Common Occupations - Fire fighting and prevention, and other protective service workers including supervisors (%)
Most Common Occupations - Law enforcement workers including supervisors (%)
Most Common Occupations - Food preparation and serving related occupations (%)
Most Common Occupations - Building and grounds cleaning and maintenance occupations (%)
Most Common Occupations - Personal care and service occupations (%)
Most Common Occupations - Sales and office occupations (%)
Most Common Occupations - Sales and related occupations (%)
Most Common Occupations - Office and administrative support occupations (%)
Most Common Occupations - Natural resources, construction, and maintenance occupations (%)
Most Common Occupations - Farming, fishing, and forestry occupations (%)
Most Common Occupations - Construction and extraction occupations (%)
Most Common Occupations - Installation, maintenance, and repair occupations (%)
Most Common Occupations - Production, transportation, and material moving occupations (%)
Most Common Occupations - Production occupations (%)
Most Common Occupations - Transportation occupations (%)
Most Common Occupations - Material moving occupations (%)
People in Group quarters - Institutionalized population (%)
People in Group quarters - Correctional institutions (%)
People in Group quarters - Federal prisons and detention centers (%)
People in Group quarters - Halfway houses (%)
People in Group quarters - Local jails and other confinement facilities (including police lockups) (%)
People in Group quarters - Military disciplinary barracks (%)
People in Group quarters - State prisons (%)
People in Group quarters - Other types of correctional institutions (%)
People in Group quarters - Nursing homes (%)
People in Group quarters - Hospitals/wards, hospices, and schools for the handicapped (%)
People in Group quarters - Hospitals/wards and hospices for chronically ill (%)
People in Group quarters - Hospices or homes for chronically ill (%)
People in Group quarters - Military hospitals or wards for chronically ill (%)
People in Group quarters - Other hospitals or wards for chronically ill (%)
People in Group quarters - Hospitals or wards for drug/alcohol abuse (%)
People in Group quarters - Mental (Psychiatric) hospitals or wards (%)
People in Group quarters - Schools, hospitals, or wards for the mentally retarded (%)
People in Group quarters - Schools, hospitals, or wards for the physically handicapped (%)
People in Group quarters - Institutions for the deaf (%)
People in Group quarters - Institutions for the blind (%)
People in Group quarters - Orthopedic wards and institutions for the physically handicapped (%)
People in Group quarters - Wards in general hospitals for patients who have no usual home elsewhere (%)
People in Group quarters - Wards in military hospitals for patients who have no usual home elsewhere (%)
People in Group quarters - Juvenile institutions (%)
People in Group quarters - Long-term care (%)
People in Group quarters - Homes for abused, dependent, and neglected children (%)
People in Group quarters - Residential treatment centers for emotionally disturbed children (%)
People in Group quarters - Training schools for juvenile delinquents (%)
People in Group quarters - Short-term care, detention or diagnostic centers for delinquent children (%)
People in Group quarters - Type of juvenile institution unknown (%)
People in Group quarters - Noninstitutionalized population (%)
People in Group quarters - College dormitories (includes college quarters off campus) (%)
People in Group quarters - Military quarters (%)
People in Group quarters - On base (%)
People in Group quarters - Barracks, unaccompanied personnel housing (UPH), (Enlisted/Officer), ;and similar group living quarters for military personnel (%)
People in Group quarters - Transient quarters for temporary residents (%)
People in Group quarters - Military ships (%)
People in Group quarters - Group homes (%)
People in Group quarters - Homes or halfway houses for drug/alcohol abuse (%)
People in Group quarters - Homes for the mentally ill (%)
People in Group quarters - Homes for the mentally retarded (%)
People in Group quarters - Homes for the physically handicapped (%)
People in Group quarters - Other group homes (%)
People in Group quarters - Religious group quarters (%)
People in Group quarters - Dormitories (%)
People in Group quarters - Agriculture workers' dormitories on farms (%)
People in Group quarters - Job Corps and vocational training facilities (%)
People in Group quarters - Other workers' dormitories (%)
People in Group quarters - Crews of maritime vessels (%)
People in Group quarters - Other nonhousehold living situations (%)
People in Group quarters - Other noninstitutional group quarters (%)
Residents speaking English at home (%)
Residents speaking English at home - Born in the United States (%)
Residents speaking English at home - Native, born elsewhere (%)
Residents speaking English at home - Foreign born (%)
Residents speaking Spanish at home (%)
Residents speaking Spanish at home - Born in the United States (%)
Residents speaking Spanish at home - Native, born elsewhere (%)
Residents speaking Spanish at home - Foreign born (%)
Residents speaking other language at home (%)
Residents speaking other language at home - Born in the United States (%)
Residents speaking other language at home - Native, born elsewhere (%)
Residents speaking other language at home - Foreign born (%)
Class of Workers - Employee of private company (%)
Class of Workers - Self-employed in own incorporated business (%)
Class of Workers - Private not-for-profit wage and salary workers (%)
Class of Workers - Local government workers (%)
Class of Workers - State government workers (%)
Class of Workers - Federal government workers (%)
Class of Workers - Self-employed workers in own not incorporated business and Unpaid family workers (%)
House heating fuel used in houses and condos - Utility gas (%)
House heating fuel used in houses and condos - Bottled, tank, or LP gas (%)
House heating fuel used in houses and condos - Electricity (%)
House heating fuel used in houses and condos - Fuel oil, kerosene, etc. (%)
House heating fuel used in houses and condos - Coal or coke (%)
House heating fuel used in houses and condos - Wood (%)
House heating fuel used in houses and condos - Solar energy (%)
House heating fuel used in houses and condos - Other fuel (%)
House heating fuel used in houses and condos - No fuel used (%)
House heating fuel used in apartments - Utility gas (%)
House heating fuel used in apartments - Bottled, tank, or LP gas (%)
House heating fuel used in apartments - Electricity (%)
House heating fuel used in apartments - Fuel oil, kerosene, etc. (%)
House heating fuel used in apartments - Coal or coke (%)
House heating fuel used in apartments - Wood (%)
House heating fuel used in apartments - Solar energy (%)
House heating fuel used in apartments - Other fuel (%)
House heating fuel used in apartments - No fuel used (%)
Armed forces status - In Armed Forces (%)
Armed forces status - Civilian (%)
Armed forces status - Civilian - Veteran (%)
Armed forces status - Civilian - Nonveteran (%)
Fatal accidents locations in years 2005-2021
Fatal accidents locations in 2005
Fatal accidents locations in 2006
Fatal accidents locations in 2007
Fatal accidents locations in 2008
Fatal accidents locations in 2009
Fatal accidents locations in 2010
Fatal accidents locations in 2011
Fatal accidents locations in 2012
Fatal accidents locations in 2013
Fatal accidents locations in 2014
Fatal accidents locations in 2015
Fatal accidents locations in 2016
Fatal accidents locations in 2017
Fatal accidents locations in 2018
Fatal accidents locations in 2019
Fatal accidents locations in 2020
Fatal accidents locations in 2021
Alcohol use - People drinking some alcohol every month (%)
Alcohol use - People not drinking at all (%)
Alcohol use - Average days/month drinking alcohol
Alcohol use - Average drinks/week
Alcohol use - Average days/year people drink much
Audiometry - Average condition of hearing (%)
Audiometry - People that can hear a whisper from across a quiet room (%)
Audiometry - People that can hear normal voice from across a quiet room (%)
Audiometry - Ears ringing, roaring, buzzing (%)
Audiometry - Had a job exposure to loud noise (%)
Audiometry - Had off-work exposure to loud noise (%)
Blood Pressure & Cholesterol - Has high blood pressure (%)
Blood Pressure & Cholesterol - Checking blood pressure at home (%)
Blood Pressure & Cholesterol - Frequently checking blood cholesterol (%)
Blood Pressure & Cholesterol - Has high cholesterol level (%)
Consumer Behavior - Money monthly spent on food at supermarket/grocery store
Consumer Behavior - Money monthly spent on food at other stores
Consumer Behavior - Money monthly spent on eating out
Consumer Behavior - Money monthly spent on carryout/delivered foods
Consumer Behavior - Income spent on food at supermarket/grocery store (%)
Consumer Behavior - Income spent on food at other stores (%)
Consumer Behavior - Income spent on eating out (%)
Consumer Behavior - Income spent on carryout/delivered foods (%)
Current Health Status - General health condition (%)
Current Health Status - Blood donors (%)
Current Health Status - Has blood ever tested for HIV virus (%)
Current Health Status - Left-handed people (%)
Dermatology - People using sunscreen (%)
Diabetes - Diabetics (%)
Diabetes - Had a blood test for high blood sugar (%)
Diabetes - People taking insulin (%)
Diet Behavior & Nutrition - Diet health (%)
Diet Behavior & Nutrition - Milk product consumption (# of products/month)
Diet Behavior & Nutrition - Meals not home prepared (#/week)
Diet Behavior & Nutrition - Meals from fast food or pizza place (#/week)
Diet Behavior & Nutrition - Ready-to-eat foods (#/month)
Diet Behavior & Nutrition - Frozen meals/pizza (#/month)
Drug Use - People that ever used marijuana or hashish (%)
Drug Use - Ever used hard drugs (%)
Drug Use - Ever used any form of cocaine (%)
Drug Use - Ever used heroin (%)
Drug Use - Ever used methamphetamine (%)
Health Insurance - People covered by health insurance (%)
Kidney Conditions-Urology - Avg. # of times urinating at night
Medical Conditions - People with asthma (%)
Medical Conditions - People with anemia (%)
Medical Conditions - People with psoriasis (%)
Medical Conditions - People with overweight (%)
Medical Conditions - Elderly people having difficulties in thinking or remembering (%)
Medical Conditions - People who ever received blood transfusion (%)
Medical Conditions - People having trouble seeing even with glass/contacts (%)
Medical Conditions - People with arthritis (%)
Medical Conditions - People with gout (%)
Medical Conditions - People with congestive heart failure (%)
Medical Conditions - People with coronary heart disease (%)
Medical Conditions - People with angina pectoris (%)
Medical Conditions - People who ever had heart attack (%)
Medical Conditions - People who ever had stroke (%)
Medical Conditions - People with emphysema (%)
Medical Conditions - People with thyroid problem (%)
Medical Conditions - People with chronic bronchitis (%)
Medical Conditions - People with any liver condition (%)
Medical Conditions - People who ever had cancer or malignancy (%)
Mental Health - People who have little interest in doing things (%)
Mental Health - People feeling down, depressed, or hopeless (%)
Mental Health - People who have trouble sleeping or sleeping too much (%)
Mental Health - People feeling tired or having little energy (%)
Mental Health - People with poor appetite or overeating (%)
Mental Health - People feeling bad about themself (%)
Mental Health - People who have trouble concentrating on things (%)
Mental Health - People moving or speaking slowly or too fast (%)
Mental Health - People having thoughts they would be better off dead (%)
Oral Health - Average years since last visit a dentist
Oral Health - People embarrassed because of mouth (%)
Oral Health - People with gum disease (%)
Oral Health - General health of teeth and gums (%)
Oral Health - Average days a week using dental floss/device
Oral Health - Average days a week using mouthwash for dental problem
Oral Health - Average number of teeth
Pesticide Use - Households using pesticides to control insects (%)
Pesticide Use - Households using pesticides to kill weeds (%)
Physical Activity - People doing vigorous-intensity work activities (%)
Physical Activity - People doing moderate-intensity work activities (%)
Physical Activity - People walking or bicycling (%)
Physical Activity - People doing vigorous-intensity recreational activities (%)
Physical Activity - People doing moderate-intensity recreational activities (%)
Physical Activity - Average hours a day doing sedentary activities
Physical Activity - Average hours a day watching TV or videos
Physical Activity - Average hours a day using computer
Physical Functioning - People having limitations keeping them from working (%)
Physical Functioning - People limited in amount of work they can do (%)
Physical Functioning - People that need special equipment to walk (%)
Physical Functioning - People experiencing confusion/memory problems (%)
Physical Functioning - People requiring special healthcare equipment (%)
Prescription Medications - Average number of prescription medicines taking
Preventive Aspirin Use - Adults 40+ taking low-dose aspirin (%)
Reproductive Health - Vaginal deliveries (%)
Reproductive Health - Cesarean deliveries (%)
Reproductive Health - Deliveries resulted in a live birth (%)
Reproductive Health - Pregnancies resulted in a delivery (%)
Reproductive Health - Women breastfeeding newborns (%)
Reproductive Health - Women that had a hysterectomy (%)
Reproductive Health - Women that had both ovaries removed (%)
Reproductive Health - Women that have ever taken birth control pills (%)
Reproductive Health - Women taking birth control pills (%)
Reproductive Health - Women that have ever used Depo-Provera or injectables (%)
Reproductive Health - Women that have ever used female hormones (%)
Sexual Behavior - People 18+ that ever had sex (vaginal, anal, or oral) (%)
Sexual Behavior - Males 18+ that ever had vaginal sex with a woman (%)
Sexual Behavior - Males 18+ that ever performed oral sex on a woman (%)
Sexual Behavior - Males 18+ that ever had anal sex with a woman (%)
Sexual Behavior - Males 18+ that ever had any sex with a man (%)
Sexual Behavior - Females 18+ that ever had vaginal sex with a man (%)
Sexual Behavior - Females 18+ that ever performed oral sex on a man (%)
Sexual Behavior - Females 18+ that ever had anal sex with a man (%)
Sexual Behavior - Females 18+ that ever had any kind of sex with a woman (%)
Sexual Behavior - Average age people first had sex
Sexual Behavior - Average number of female sex partners in lifetime (males 18+)
Sexual Behavior - Average number of female vaginal sex partners in lifetime (males 18+)
Sexual Behavior - Average age people first performed oral sex on a woman (18+)
Sexual Behavior - Average number of woman performed oral sex on in lifetime (18+)
Sexual Behavior - Average number of male sex partners in lifetime (males 18+)
Sexual Behavior - Average number of male anal sex partners in lifetime (males 18+)
Sexual Behavior - Average age people first performed oral sex on a man (18+)
Sexual Behavior - Average number of male oral sex partners in lifetime (18+)
Sexual Behavior - People using protection when performing oral sex (%)
Sexual Behavior - Average number of times people have vaginal or anal sex a year
Sexual Behavior - People having sex without condom (%)
Sexual Behavior - Average number of male sex partners in lifetime (females 18+)
Sexual Behavior - Average number of male vaginal sex partners in lifetime (females 18+)
Sexual Behavior - Average number of female sex partners in lifetime (females 18+)
Sexual Behavior - Circumcised males 18+ (%)
Sleep Disorders - Average hours sleeping at night
Sleep Disorders - People that has trouble sleeping (%)
Smoking-Cigarette Use - People smoking cigarettes (%)
Taste & Smell - People 40+ having problems with smell (%)
Taste & Smell - People 40+ having problems with taste (%)
Taste & Smell - People 40+ that ever had wisdom teeth removed (%)
Taste & Smell - People 40+ that ever had tonsils teeth removed (%)
Taste & Smell - People 40+ that ever had a loss of consciousness because of a head injury (%)
Taste & Smell - People 40+ that ever had a broken nose or other serious injury to face or skull (%)
Taste & Smell - People 40+ that ever had two or more sinus infections (%)
Weight - Average height (inches)
Weight - Average weight (pounds)
Weight - Average BMI
Weight - People that are obese (%)
Weight - People that ever were obese (%)
Weight - People trying to lose weight (%)
Urban population: 10,704
Rural population: 1,060
Estimated median house/condo value in 2022: $94,848
48604:
$94,848Michigan:
$224,400
According to our research of Michigan and other state lists, there were 42 registered sex offenders living in 48604 zip code as of April 26, 2024 . The ratio of all residents to sex offenders in zip code 48604 is 322 to 1.The ratio of registered sex offenders to all residents in this zip code is near the state average.
Median resident age: This zip code:
27.1 yearsMichigan median age:
40.3 years
Average household size: This zip code:
2.2 peopleMichigan:
2.4 people
Averages for the 2020 tax year for zip code 48604, filed in 2021:
Average Adjusted Gross Income (AGI) in 2020: $44,635 (Individual Income Tax Returns) Here:
$44,635State:
$68,945
Salary/wage: $38,562 (reported on 77.8% of returns )Here:
$38,562State:
$57,142
(% of AGI for various income ranges: 975.0% for AGIs below $25k , 3018.1% for AGIs $25k-50k , 6028.3% for AGIs $50k-75k , 8591.9% for AGIs $75k-100k , 14576.3% for AGIs $100k-200k ) Taxable interest for individuals: $1,155 (reported on 27.3% of returns )This zip code:
$1,155Michigan:
$1,630
(% of AGI for various income ranges: 20.9% for AGIs below $25k , 30.0% for AGIs $25k-50k , 53.5% for AGIs $50k-75k , 49.6% for AGIs $75k-100k , 114.4% for AGIs $100k-200k ) Ordinary dividends: $4,381 (reported on 13.2% of returns )(% of AGI for various income ranges: 14.3% for AGIs below $25k , 21.7% for AGIs $25k-50k , 46.0% for AGIs $50k-75k , 65.8% for AGIs $75k-100k , 103.0% for AGIs $100k-200k ) Net capital gain/loss in AGI: +$3,663 (reported on 11.2% of returns )Here:
+$3,663State:
+$20,064
(% of AGI for various income ranges: 2.5% for AGIs below $25k , 16.6% for AGIs $25k-50k , 43.1% for AGIs $50k-75k , 78.1% for AGIs $75k-100k , 273.3% for AGIs $100k-200k ) Profit/loss from business: +$4,952 (reported on 9.8% of returns )Here:
+$4,952State:
+$11,172
(% of AGI for various income ranges: 56.6% for AGIs below $25k , 19.1% for AGIs $25k-50k , 108.7% for AGIs $50k-75k , 147.3% for AGIs $75k-100k , 161.9% for AGIs $100k-200k ) Taxable individual retirement arrangement distribution: $14,102 (reported on 9.0% of returns )48604:
$14,102Michigan:
$19,803
(% of AGI for various income ranges: 51.9% for AGIs below $25k , 98.3% for AGIs $25k-50k , 180.2% for AGIs $50k-75k , 368.5% for AGIs $75k-100k , 958.9% for AGIs $100k-200k ) Total itemized deductions: $30,409 (reported on 2.2% of returns )Here:
$30,409State:
$34,117
(% of AGI for various income ranges: 77.1% for AGIs $25k-50k , 164.4% for AGIs $50k-75k , 568.1% for AGIs $100k-200k ) Charity contributions: $6,722 (reported on 1.8% of returns )(% of AGI for various income ranges: 9.2% for AGIs $25k-50k , 45.8% for AGIs $50k-75k , 93.7% for AGIs $100k-200k ) Taxes paid: $6,336 (reported on 2.2% of returns )(% of AGI for various income ranges: 11.5% for AGIs $25k-50k , 36.3% for AGIs $50k-75k , 135.2% for AGIs $100k-200k ) Earned income credit: $2,164 (reported on 16.5% of returns )(% of AGI for various income ranges: 72.5% for AGIs below $25k , 58.3% for AGIs $25k-50k ) Percentage of individuals using paid preparers for their 2020 taxes: 94.5%(% for various income ranges: 94.2% for AGIs below $25k , 94.7% for AGIs $25k-50k , 94.4% for AGIs $50k-75k , 94.4% for AGIs $75k-100k , 95.1% for AGIs $100k-200k , 100.0% for AGIs over 200k )
Averages for the 2012 tax year for zip code 48604, filed in 2013:
Average Adjusted Gross Income (AGI) in 2012: $37,855 (Individual Income Tax Returns) Here:
$37,855State:
$55,609
Salary/wage: $31,518 (reported on 82.7% of returns )Here:
$31,518State:
$46,782
(% of AGI for various income ranges: 67.0% for AGIs below $25k , 70.6% for AGIs $25k-50k , 72.4% for AGIs $50k-75k , 77.3% for AGIs $75k-100k , 85.6% for AGIs $100k-200k ) Taxable interest for individuals: $838 (reported on 34.4% of returns )This zip code:
$838Michigan:
$1,491
(% of AGI for various income ranges: 1.5% for AGIs below $25k , 0.7% for AGIs $25k-50k , 0.6% for AGIs $50k-75k , 0.5% for AGIs $75k-100k , 0.8% for AGIs $100k-200k ) Ordinary dividends: $1,855 (reported on 15.8% of returns )(% of AGI for various income ranges: 1.0% for AGIs below $25k , 0.7% for AGIs $25k-50k , 0.6% for AGIs $50k-75k , 0.4% for AGIs $75k-100k , 1.7% for AGIs $100k-200k ) Net capital gain/loss in AGI: +$818 (reported on 10.6% of returns )(% of AGI for various income ranges: 0.2% for AGIs $75k-100k , 1.4% for AGIs $100k-200k ) Profit/loss from business: +$7,687 (reported on 9.4% of returns )Here:
+$7,687State:
+$11,523
(% of AGI for various income ranges: 3.8% for AGIs below $25k , 1.4% for AGIs $25k-50k , 1.0% for AGIs $50k-75k , 1.0% for AGIs $75k-100k , 3.8% for AGIs $100k-200k ) Taxable individual retirement arrangement distribution: $9,450 (reported on 10.8% of returns )48604:
$9,450Michigan:
$15,298
(% of AGI for various income ranges: 2.8% for AGIs below $25k , 2.6% for AGIs $25k-50k , 2.5% for AGIs $50k-75k , 2.8% for AGIs $75k-100k , 4.3% for AGIs $100k-200k ) Total itemized deductions: $16,901 (23% of AGI, reported on 17.7% of returns )Here:
$16,901State:
$21,628
Here:
23.2% of AGIState:
18.4% of AGI
(% of AGI for various income ranges: 5.3% for AGIs below $25k , 7.3% for AGIs $25k-50k , 7.4% for AGIs $50k-75k , 8.3% for AGIs $75k-100k , 15.2% for AGIs $100k-200k ) Charity contributions: $3,115 (reported on 14.2% of returns )(% of AGI for various income ranges: 0.6% for AGIs below $25k , 0.9% for AGIs $25k-50k , 1.3% for AGIs $50k-75k , 1.2% for AGIs $75k-100k , 2.4% for AGIs $100k-200k ) Taxes paid: $5,256 (reported on 17.5% of returns )(% of AGI for various income ranges: 1.0% for AGIs below $25k , 1.7% for AGIs $25k-50k , 2.1% for AGIs $50k-75k , 3.0% for AGIs $75k-100k , 6.0% for AGIs $100k-200k ) Earned income credit: $2,204 (reported on 20.0% of returns )(% of AGI for various income ranges: 5.8% for AGIs below $25k , 1.1% for AGIs $25k-50k ) Percentage of individuals using paid preparers for their 2012 taxes: 54.8%(% for various income ranges: 50.2% for AGIs below $25k , 55.5% for AGIs $25k-50k , 63.1% for AGIs $50k-75k , 61.8% for AGIs $75k-100k , 69.6% for AGIs $100k-200k )
Averages for the 2004 tax year for zip code 48604, filed in 2005:
Average Adjusted Gross Income (AGI) in 2004: $35,859 (Individual Income Tax Returns) Here:
$35,859State:
$48,204
Salary/wage: $32,431 (reported on 85.8% of returns )Here:
$32,431State:
$42,791
(% of AGI for various income ranges: 80.8% for AGIs below $10k , 66.5% for AGIs $10k-25k , 73.2% for AGIs $25k-50k , 81.1% for AGIs $50k-75k , 86.9% for AGIs $75k-100k , 77.8% for AGIs over 100k ) Taxable interest for individuals: $1,167 (reported on 51.1% of returns )This zip code:
$1,167Michigan:
$1,725
(% of AGI for various income ranges: 4.5% for AGIs below $10k , 2.5% for AGIs $10k-25k , 1.5% for AGIs $25k-50k , 1.3% for AGIs $50k-75k , 0.9% for AGIs $75k-100k , 1.9% for AGIs over 100k ) Taxable dividends: $1,508 (reported on 21.7% of returns )(% of AGI for various income ranges: 1.9% for AGIs below $10k , 1.3% for AGIs $10k-25k , 0.6% for AGIs $25k-50k , 0.5% for AGIs $50k-75k , 0.8% for AGIs $75k-100k , 1.7% for AGIs over 100k ) Net capital gain/loss: +$1,849 (reported on 14.5% of returns )Here:
+$1,849State:
+$8,532
(% of AGI for various income ranges: -2.2% for AGIs below $10k , -0.2% for AGIs $10k-25k , 0.2% for AGIs $25k-50k , 0.6% for AGIs $50k-75k , 0.8% for AGIs $75k-100k , 3.0% for AGIs over 100k ) Profit/loss from business: +$5,105 (reported on 10.0% of returns )Here:
+$5,105State:
+$9,547
(% of AGI for various income ranges: 2.4% for AGIs below $10k , 2.0% for AGIs $10k-25k , 1.3% for AGIs $25k-50k , 0.9% for AGIs $50k-75k , 0.7% for AGIs $75k-100k , 2.4% for AGIs over 100k ) Profit/loss from farming: +$588 (reported on 0.4% of returns )
Here : State :
IRA payment deduction: $2,407 (reported on 1.9% of returns )48604:
$2,407Michigan:
$2,875
(% of AGI for various income ranges: 0.3% for AGIs $10k-25k , 0.2% for AGIs $25k-50k , 0.1% for AGIs $50k-75k , 0.1% for AGIs $75k-100k ) Total itemized deductions: $14,632 (22% of AGI, reported on 26.0% of returns )Here:
$14,632State:
$18,509
Here:
22.2% of AGIState:
20.7% of AGI
(% of AGI for various income ranges: 6.7% for AGIs below $10k , 6.7% for AGIs $10k-25k , 10.7% for AGIs $25k-50k , 10.8% for AGIs $50k-75k , 11.3% for AGIs $75k-100k , 12.9% for AGIs over 100k ) Charity contributions deductions: $2,613 (4% of AGI, reported on 23.2% of returns )Here:
4.0% of AGIState:
3.6% of AGI
(% of AGI for various income ranges: 0.6% for AGIs below $10k , 0.9% for AGIs $10k-25k , 1.5% for AGIs $25k-50k , 1.7% for AGIs $50k-75k , 1.8% for AGIs $75k-100k , 2.6% for AGIs over 100k ) Total tax: $4,548 (reported on 72.2% of returns )(% of AGI for various income ranges: 2.0% for AGIs below $10k , 3.5% for AGIs $10k-25k , 6.6% for AGIs $25k-50k , 8.5% for AGIs $50k-75k , 10.4% for AGIs $75k-100k , 18.0% for AGIs over 100k ) Earned income credit: $1,749 (reported on 16.7% of returns )Percentage of individuals using paid preparers for their 2004 taxes: 60.3%(% for various income ranges: 54.1% for AGIs below $10k , 59.2% for AGIs $10k-25k , 62.5% for AGIs $25k-50k , 64.2% for AGIs $50k-75k , 65.7% for AGIs $75k-100k , 64.9% for AGIs over 100k )
Estimated median household income in 2022: This zip code:
$51,126Michigan:
$66,986
Nearest zip codes: 48724 ,
48710 ,
48603 ,
48607 ,
48602 ,
48638 .
Zilwaukee Zip Code Map
Percentage of family households: This zip code:
42.4%Michigan:
43.3%
Percentage of households with unmarried partners: This zip code:
8.8%Michigan:
45.7%
Likely homosexual households (counted as self-reported same-sex unmarried-partner households)
Lesbian couples: 0.1% of all households Gay men: 0.0% of all households
Household received Food Stamps/SNAP in the past 12 months: 460Household did not receive Food Stamps/SNAP in the past 12 months: 3,846
Women who had a birth in the past 12 months: 41 (33 now married , 8 unmarried) Women who did not have a birth in the past 12 months: 3,871 (633 now married , 3,258 unmarried)
Housing units in zip code 48604 with a mortgage: 1,503 (111
second mortgage , 22
home equity loan , 72
both second mortgage and home equity loan )
Houses without a mortgage: 124
Median monthly owner costs for units with a mortgage: $997
Median monthly owner costs for units without a mortgage: $480
Residents with income below the poverty level in 2022:
This zip code:
29.8%Whole state:
13.4%
Residents with income below 50% of the poverty level in 2022:
This zip code:
14.8%Whole state:
6.9%
Median number of rooms in houses and condos: Median number of rooms in apartments: Notable locations in this zip code not listed on our city pages
Click to draw/clear zip code borders Notable locations in zip code 48604: (A) , Lawndale Station (B) , Carrolltown Station (C) , Kochville Township Fire Department (D) , Tranquil Residence Halls (E) , University Village West (F) , Living Center Southwest (G) , Living Center South (H) , Founders Hall (I) , South Campus Complex (J) , Regional Education Center (K) , Zahnow Amphitheatre (L) , Performing Arts Center (M) , Groening Commons (N) , Curtiss Hall (O) , Doan Center (P) , Living Center North (Q) , Great Lakes Residence Halls (R) , Pioneer Hall (S) , Dow Doan Science Building East (T) . Display/hide their locations on the map
Shopping Center: (1) . Display/hide its location on the map
Churches in zip code 48604 include: (A) , Kochville Church (B) , Lawndale Church (C) , Saginaw Valley Church of the Nazarene (D) , New Beginning Christian Church (E) , Messiah Lutheran Church (F) , Community Christian Reformed Church (G) , Gloria Dei Lutheran Church (H) , Somang Korean Church (I) . Display/hide their locations on the map
Cemeteries: (1) , Lawndale Cemetery (2) . Display/hide their locations on the map
Parks in zip code 48604 include: (1) , Pool Park (2) , Sherman Park (3) , Hanchett Park (4) , Stoker Park (5) , Owsley Grove (6) , Wickes Memorial Stadium (7) , Morley Field (8) . Display/hide their locations on the map
Year house built (houses)
0 2020 or later194 2010 to 2019294 2000 to 2009398 1990 to 1999331 1980 to 1989635 1970 to 1979750 1960 to 19691,145 1950 to 1959221 1940 to 1949641 1939 or earlier
Zip code 48604 household income distribution in 2022 335 Less than $10,000219 $10,000 to $14,999176 $15,000 to $19,999248 $20,000 to $24,999241 $25,000 to $29,999159 $30,000 to $34,999123 $35,000 to $39,999381 $40,000 to $44,999215 $45,000 to $49,999184 $50,000 to $59,999541 $60,000 to $74,999538 $75,000 to $99,999359 $100,000 to $124,999214 $125,000 to $149,999183 $150,000 to $199,999220 $200,000 or moreEstimate of home value of owner-occupied houses/condos in 2022 in zip code 48604 88 Less than $10,00029 $10,000 to $14,99914 $15,000 to $19,99945 $20,000 to $24,99988 $25,000 to $29,99911 $30,000 to $34,99985 $35,000 to $39,99987 $40,000 to $49,999191 $50,000 to $59,999258 $60,000 to $69,999463 $70,000 to $79,999289 $80,000 to $89,999187 $90,000 to $99,999415 $100,000 to $124,999188 $125,000 to $149,999219 $150,000 to $174,999106 $175,000 to $199,999110 $200,000 to $249,99944 $250,000 to $299,99930 $300,000 to $399,9991 $400,000 to $499,999Rent paid by renters in 2022 in zip code 48604 18 $200 to $2496 $250 to $29910 $350 to $39910 $400 to $44995 $450 to $49973 $500 to $549186 $550 to $599150 $600 to $64919 $650 to $69952 $700 to $74932 $750 to $799101 $800 to $89928 $900 to $99924 $1,000 to $1,24946 $1,250 to $1,49956 $1,500 to $1,99920 $2,000 to $2,4998 No cash rent
Median gross rent in 2022: $915.
Median price asked for vacant for-sale houses and condos in 2022: $239,730.
Estimated median house (or condo) value in 2022 for: White Non-Hispanic householders: $96,011Black or African American householders: $59,441American Indian or Alaska Native householders: $141,367Asian householders: $125,990Native Hawaiian and other Pacific Islander householders: $122,760Some other race householders: $76,240Two or more races householders: $58,795Hispanic or Latino householders: $96,398Estimated median house or condo value in 2022: $94,848
48604:
$94,848Michigan:
$224,400
Lower value quartile - upper value quartile: $68,554 - $136,219
Mean price in 2022: Detached houses: $133,824Here:
$133,824State:
$280,038
Townhouses or other attached units: $988,037Here:
$988,037State:
$239,520
In 2-unit structures: $613,742Here:
$613,742State:
$219,481
Mobile homes: $30,056Here:
$30,056State:
$72,868
Housing units in structures:
One, detached: 3,543One, attached: 101Two: 503 or 4: 185 to 9: 37410 to 19: 25020 to 49: 10950 or more: 6Mobile homes: 195Unemployment : 6.2%
Means of transportation to work in zip code 48604 68.4% 3,851 Drove a car alone3.9% 221 Carpooled0.3% 17 Bus or trolley bus13.0% 734 Walked14.6% 823 Worked at homeTravel time to work (commute) in zip code 48604 210 Less than 5 minutes1,272 5 to 9 minutes1,248 10 to 14 minutes767 15 to 19 minutes521 20 to 24 minutes138 25 to 29 minutes246 30 to 34 minutes76 35 to 39 minutes74 40 to 44 minutes129 45 to 59 minutes96 60 to 89 minutes42 90 or more minutes
Percentage of zip code residents living and working in this county: 87.9%
Household type by relationship:
Households: 11,765
Male householders: 1,986 (573 living alone ), Female householders: 2,335 (700 living alone )1,555 spouses (1,549 opposite-sex spouses ), 268 unmarried partners , (258 opposite-sex unmarried partners ), 2,223 children (2,128 natural , 24 adopted , 72 stepchildren ), 114 grandchildren , 71 brothers or sisters , 19 parents , 0 foster children , 67 other relatives , 951 non-relatives In group quarters: 2,128 (-1 institutionalized population )
Size of family households: 1,332 2-persons , 512 3-persons , 438 4-persons , 76 5-persons , 36 6-persons , 14 7-or-more-persons
Size of nonfamily households: 1,273 1-person , 296 2-persons , 116 3-persons , 264 4-persons
652 married couples with children. single-parent households (154 men , 376 women ).
94.2% of residents of 48604 zip code speak English at home. of residents speak Spanish at home (63% very well, 34% well, 3% not well ).of residents speak other Indo-European language at home (52% very well, 48% well ).of residents speak other language at home (78% very well, 22% well ).
Foreign born population: 240 (2.0%)
(24.7%
of them are naturalized citizens )
This zip code:
2.0%Whole state:
6.9%
14% Nepal 13% Honduras 13% Bolivia 7% Liberia 6% Afghanistan 5% India 4% Guatemala 21% German 13% American 6% Polish 3% English 3% Irish 2% Italian 2% European
Year of entry for the foreign-born population
176 2010 or later 64 2000 to 2009 18 1990 to 1999 28 Before 1990
Major facilities with environmental interests located in this zip code:
CHAMPAGNE & MARX EXCAVATING INC (CHAMPAGNE & MARX, MICHIGAN RD 1445 LIBERTY RD. in SAGINAW, MI)
CRITERIA AND HAZARDOUS AIR POLLUTANT INVENTORY (Inventory of air pollution sources) Conditionally Exempt Small Quantity Generators, less than 100 kg/month of hazardous waste (Resource Conservation and Recovery Act (tracking hazardous waste)) TRANSPORTER (Resource Conservation and Recovery Act (tracking hazardous waste)) Business SIC classification: CRUSHED AND BROKEN STONEBusiness NAICS classification: HAZARDOUS WASTE COLLECTION.Organizations: FREDERICK ANNE (CONTACT/OPERATOR)
, THOMAS M MARX (CONTACT/OWNER)
Alternative names: CHAMPAGNE & MARX EXC INC, MARX ENVIRONMENTAL SERVICES INC
GLASTENDER INCORPORATED (1455 AGRICOLA DR. in SAGINAW, MI)
CRITERIA AND HAZARDOUS AIR POLLUTANT INVENTORY (Inventory of air pollution sources) (Resource Conservation and Recovery Act (tracking hazardous waste)) TRI REPORTER (Tracking of toxic chemicals releasing facilities) Business SIC classification: SHEET METALWORK; SERVICE INDUSTRY MACHINERYBusiness NAICS classification: OTHER COMMERCIAL AND SERVICE INDUSTRY MACHINERY MANUFACTURING.Organizations: HALL, JON (CONTACT/OPERATOR)
Alternative names: GLAS TENDER
MI DEPT/TRANSPORTATION BRIDGE (I-75 AT M-13 ZILWAUKEE RAMP in SAGINAW, MI)
(Resource Conservation and Recovery Act (tracking hazardous waste)) Organizations: MICH DEPT OF TRANSPORTATION (CONTACT/OPERATOR)
Alternative names: MIDOT BRIDGE I-75 AT M-13 ZILWAUKEE RAMP
MI DEPT/TRANSPORTATION BRIDGE (I-675 OVER MCCARTY RD in SAGINAW, MI)
(Resource Conservation and Recovery Act (tracking hazardous waste)) Organizations: MICH DEPT OF TRANSPORTATION (CONTACT/OPERATOR)
Alternative names: MIDOT BRIDGE I-675 OVER MCCARTY RD
MI DEPT/NATURAL RESOURCES (SEC 30 T13N R5E in SAGINAW, MI)
(Resource Conservation and Recovery Act (tracking hazardous waste)) Organizations: MIDNR (CONTACT/OWNER)
Alternative names: CROW ISLAND STATE GAME AREA
Housing units lacking complete plumbing facilities: 0.2%
Housing units lacking complete kitchen facilities: 0.2%
81.9% Utility gas 13.7% Electricity 1.8% Bottled, tank, or LP gas 1.0% Wood 0.9% Other fuel 0.6% No fuel used
Population in 1990: 11,937.
Place of birth for U.S.-born residents:
This state: 10,480Northeast: 192Midwest: 397South: 228West: 175
63% of the 48604 zip code residents lived in the same house 5 years ago.
Out of people who lived in different houses, 60% lived in this county.
Out of people who lived in different counties, 50% lived in Michigan.
94% of the 48604 zip code residents lived in the same house 1 year ago.
Out of people who lived in different houses, 68% moved from this county.
Out of people who lived in different houses, 8% moved from different county within same state.
Out of people who lived in different houses, 13% moved from different state.
Out of people who lived in different houses, 14% moved from abroad.
Private vs. public school enrollment:
Students in private schools in grades 1 to 8 (elementary and middle school): 87
Students in private schools in grades 9 to 12 (high school): 108
Students in private undergraduate colleges: 189
Occupation by median earnings in the past 12 months ($)
113,773 Business and financial operations occupations 110,599 Architecture and engineering occupations 74,918 Law enforcement workers including supervisors 67,352 Arts, design, entertainment, sports, and media occupations 57,661 Management occupations 56,289 Computer and mathematical occupations
Companies with federal contracts located in this zip code:
RMC ENGINE REBUILDING EPUIPMEN (5775 BRIDGEVIEW CTR in SAGINAW, MI; small business) in 2 contracts from 2004 to 2005
$70,150 with Army for Miscellaneous Maintenance and Repair Shop Specialized Equipment. Signed on 2005-04-04. Completion date: 2005-06-17.
with Army for Machining Centers and Way-Type Machines. Signed on 2004-12-22. Completion date: 2004-12-31.
B & W MANAGEMENT SERVICES, INC (4407 CENTER STREET in SAGINAW, MI; small business) in 9 contracts from 2001 to 2006
Contracts for Custodial Janitorial Services, Other Housekeeping Services by NavySigned by year: 2000: $0; 2001: $3,600; 2002: $3,708; 2003: $9,255; 2004: $15,700; 2005: $17,000; 2006: $17,516.
Biggest contracts: with Navy for Custodial Janitorial Services. Signed on 2006-03-02. Completion date: 2004-03-31.
, same as above. Signed on 2005-03-31. Completion date: 2004-03-31.
, same as above. Signed on 2004-03-23. Completion date: 2004-03-31.
, same as above. Signed on 2003-11-22. Completion date: 2004-03-31.
Top industries in this zip code by the number of employees in 2005:
Accommodation and Food Services: Full-Service Restaurants (100-249 employees: 2 establishments, 50-99 employees: 7 establishments, 20-49 employees: 3 establishments, 10-19 employees: 3 establishments, 1-4 employees: 1 establishment)Health Care and Social Assistance: Offices of Physicians (except Mental Health Specialists) (100-249: 1, 50-99: 1, 20-49: 6, 10-19: 9, 5-9: 15, 1-4: 18)Administrative and Support and Waste Management and Remediation Services: Temporary Help Services (100-249: 2, 50-99: 2, 20-49: 1, 5-9: 1)Accommodation and Food Services: Limited-Service Restaurants (50-99: 2, 20-49: 4, 10-19: 5, 5-9: 1, 1-4: 3)Administrative and Support and Waste Management and Remediation Services: Professional Employer Organizations (100-249: 1, 20-49: 1, 1-4: 1)
People in group quarters in 2010:
2,570 people in college/university student housing
11 people in group homes intended for adults
6 people in residential treatment centers for adults
People in group quarters in 2000:
873 people in college dormitories (includes college quarters off campus)
7 people in other group homes
6 people in other noninstitutional group quarters
4 people in agriculture workers' dormitories on farms
Fatal accident statistics in 2011:
Fatal accident count: 2Vehicles involved in fatal accidents: 2Fatal accidents caused by drunken drivers: 1Fatalities: 2Persons involved in fatal accidents: 2Pedestrians involved in fatal accidents: 1
Fatal accident statistics in 2010:
Fatal accident count: 1Vehicles involved in fatal accidents: 2Fatal accidents caused by drunken drivers: 1Fatalities: 1Persons involved in fatal accidents: 3Pedestrians involved in fatal accidents: 0
Home Mortgage Disclosure Act Aggregated Statistics For Year 2009(Based on 10 partial tracts) A) FHA, FSA/RHS & VA B) Conventional C) Refinancings D) Home Improvement Loans F) Non-occupant Loans on G) Loans On Manufactured Number Average Value Number Average Value Number Average Value Number Average Value Number Average Value Number Average Value
LOANS ORIGINATED 61 $75,514 47 $60,435 204 $95,664 17 $20,511 12 $51,387 4 $59,788 APPLICATIONS APPROVED, NOT ACCEPTED 2 $42,465 2 $38,300 21 $95,442 1 $3,230 2 $53,285 0 $0 APPLICATIONS DENIED 8 $86,730 15 $64,157 99 $108,828 25 $27,245 10 $43,181 0 $0 APPLICATIONS WITHDRAWN 10 $57,662 7 $38,493 45 $91,673 1 $35,000 5 $79,272 1 $22,830 FILES CLOSED FOR INCOMPLETENESS 2 $69,495 2 $19,200 6 $116,668 2 $17,125 0 $0 0 $0
Aggregated Statistics For Year 2008(Based on 10 partial tracts) A) FHA, FSA/RHS & VA B) Conventional C) Refinancings D) Home Improvement Loans E) Loans on Dwellings For 5+ Families F) Non-occupant Loans on G) Loans On Manufactured Number Average Value Number Average Value Number Average Value Number Average Value Number Average Value Number Average Value Number Average Value
LOANS ORIGINATED 67 $73,131 64 $78,823 201 $77,176 40 $20,536 5 $857,962 31 $49,848 6 $37,420 APPLICATIONS APPROVED, NOT ACCEPTED 6 $84,312 5 $62,330 25 $78,974 7 $12,187 0 $0 2 $53,950 0 $0 APPLICATIONS DENIED 3 $67,667 23 $54,791 108 $81,965 23 $29,664 0 $0 15 $50,953 3 $26,183 APPLICATIONS WITHDRAWN 8 $76,465 15 $53,673 61 $83,508 10 $34,254 0 $0 5 $26,512 0 $0 FILES CLOSED FOR INCOMPLETENESS 2 $65,775 2 $70,505 2 $87,110 2 $35,440 0 $0 1 $30,120 0 $0
Aggregated Statistics For Year 2007(Based on 10 partial tracts) A) FHA, FSA/RHS & VA B) Conventional C) Refinancings D) Home Improvement Loans E) Loans on Dwellings For 5+ Families F) Non-occupant Loans on G) Loans On Manufactured Number Average Value Number Average Value Number Average Value Number Average Value Number Average Value Number Average Value Number Average Value
LOANS ORIGINATED 49 $85,546 139 $85,326 260 $84,482 48 $22,675 2 $10,028,580 33 $81,195 8 $54,114 APPLICATIONS APPROVED, NOT ACCEPTED 3 $96,683 9 $75,506 32 $92,785 9 $21,131 0 $0 5 $67,462 1 $69,200 APPLICATIONS DENIED 11 $80,812 45 $81,129 282 $85,578 64 $33,771 0 $0 22 $60,198 7 $70,970 APPLICATIONS WITHDRAWN 3 $64,423 10 $87,760 84 $71,345 6 $58,595 0 $0 6 $63,833 0 $0 FILES CLOSED FOR INCOMPLETENESS 0 $0 3 $77,760 31 $79,319 1 $8,080 0 $0 1 $62,450 0 $0
Aggregated Statistics For Year 2006(Based on 10 partial tracts) A) FHA, FSA/RHS & VA B) Conventional C) Refinancings D) Home Improvement Loans E) Loans on Dwellings For 5+ Families F) Non-occupant Loans on G) Loans On Manufactured Number Average Value Number Average Value Number Average Value Number Average Value Number Average Value Number Average Value Number Average Value
LOANS ORIGINATED 41 $84,272 172 $78,795 347 $74,797 82 $29,406 2 $68,275 43 $58,885 5 $46,722 APPLICATIONS APPROVED, NOT ACCEPTED 7 $71,674 32 $79,660 81 $83,939 10 $16,207 0 $0 11 $65,498 2 $65,980 APPLICATIONS DENIED 7 $78,031 59 $73,313 331 $85,073 88 $37,975 0 $0 20 $68,022 5 $43,870 APPLICATIONS WITHDRAWN 1 $59,930 12 $96,819 155 $90,750 7 $92,516 0 $0 4 $103,515 0 $0 FILES CLOSED FOR INCOMPLETENESS 1 $54,700 1 $59,220 52 $104,842 1 $21,400 0 $0 4 $92,385 0 $0
Aggregated Statistics For Year 2005(Based on 10 partial tracts) A) FHA, FSA/RHS & VA B) Conventional C) Refinancings D) Home Improvement Loans E) Loans on Dwellings For 5+ Families F) Non-occupant Loans on G) Loans On Manufactured Number Average Value Number Average Value Number Average Value Number Average Value Number Average Value Number Average Value Number Average Value
LOANS ORIGINATED 49 $84,473 233 $72,746 445 $76,293 97 $24,250 3 $1,094,463 54 $54,045 3 $72,170 APPLICATIONS APPROVED, NOT ACCEPTED 3 $74,097 36 $82,393 84 $77,522 29 $24,597 0 $0 1 $76,210 0 $0 APPLICATIONS DENIED 5 $80,854 74 $65,251 347 $82,349 83 $41,098 0 $0 27 $61,307 6 $42,002 APPLICATIONS WITHDRAWN 2 $84,925 38 $98,706 178 $94,766 20 $128,674 0 $0 16 $112,105 4 $96,110 FILES CLOSED FOR INCOMPLETENESS 1 $83,130 20 $78,806 89 $105,709 3 $49,203 0 $0 4 $79,958 0 $0
Aggregated Statistics For Year 2004(Based on 10 partial tracts) A) FHA, FSA/RHS & VA B) Conventional C) Refinancings D) Home Improvement Loans E) Loans on Dwellings For 5+ Families F) Non-occupant Loans on G) Loans On Manufactured Number Average Value Number Average Value Number Average Value Number Average Value Number Average Value Number Average Value Number Average Value
LOANS ORIGINATED 56 $84,438 212 $78,177 549 $77,380 85 $38,748 1 $344,580 59 $72,000 21 $55,648 APPLICATIONS APPROVED, NOT ACCEPTED 4 $70,500 39 $72,141 91 $80,756 13 $27,357 0 $0 12 $73,616 2 $50,145 APPLICATIONS DENIED 9 $96,713 79 $69,382 334 $79,084 75 $34,069 0 $0 24 $82,168 12 $59,310 APPLICATIONS WITHDRAWN 8 $82,194 17 $104,952 135 $84,928 8 $59,628 0 $0 10 $83,481 0 $0 FILES CLOSED FOR INCOMPLETENESS 0 $0 6 $89,302 62 $87,759 6 $9,498 0 $0 6 $72,600 1 $54,920
Aggregated Statistics For Year 2003(Based on 10 partial tracts) A) FHA, FSA/RHS & VA B) Conventional C) Refinancings D) Home Improvement Loans F) Non-occupant Loans on Number Average Value Number Average Value Number Average Value Number Average Value Number Average Value
LOANS ORIGINATED 79 $80,860 194 $83,160 1,006 $78,247 56 $17,787 69 $55,237 APPLICATIONS APPROVED, NOT ACCEPTED 1 $59,930 19 $99,561 120 $89,583 4 $27,142 8 $68,290 APPLICATIONS DENIED 9 $62,132 35 $72,488 330 $69,039 66 $11,479 18 $57,397 APPLICATIONS WITHDRAWN 9 $81,151 20 $74,738 156 $83,330 2 $10,100 4 $70,250 FILES CLOSED FOR INCOMPLETENESS 1 $36,260 0 $0 30 $83,141 3 $18,873 2 $73,615
Aggregated Statistics For Year 2002(Based on 10 partial tracts) A) FHA, FSA/RHS & VA B) Conventional C) Refinancings D) Home Improvement Loans F) Non-occupant Loans on Number Average Value Number Average Value Number Average Value Number Average Value Number Average Value
LOANS ORIGINATED 88 $73,578 178 $84,687 758 $75,983 71 $15,061 54 $69,951 APPLICATIONS APPROVED, NOT ACCEPTED 2 $60,375 21 $63,453 108 $67,758 10 $26,984 3 $38,693 APPLICATIONS DENIED 1 $20,900 31 $64,484 276 $72,176 34 $10,639 9 $49,291 APPLICATIONS WITHDRAWN 0 $0 9 $68,103 152 $70,715 2 $11,305 4 $44,580 FILES CLOSED FOR INCOMPLETENESS 3 $61,703 6 $72,348 41 $86,728 2 $8,795 1 $31,340
Aggregated Statistics For Year 2001(Based on 10 partial tracts) A) FHA, FSA/RHS & VA B) Conventional C) Refinancings D) Home Improvement Loans E) Loans on Dwellings For 5+ Families F) Non-occupant Loans on Number Average Value Number Average Value Number Average Value Number Average Value Number Average Value Number Average Value
LOANS ORIGINATED 76 $71,953 166 $82,471 619 $72,327 63 $16,630 0 $0 30 $55,041 APPLICATIONS APPROVED, NOT ACCEPTED 1 $102,830 19 $58,913 57 $73,801 25 $34,221 0 $0 4 $22,158 APPLICATIONS DENIED 8 $76,345 48 $57,221 244 $60,453 84 $11,368 2 $308,060 8 $24,658 APPLICATIONS WITHDRAWN 4 $91,018 11 $86,638 88 $61,102 9 $25,663 2 $279,755 4 $37,982 FILES CLOSED FOR INCOMPLETENESS 0 $0 0 $0 25 $73,272 0 $0 0 $0 0 $0
Aggregated Statistics For Year 2000(Based on 10 partial tracts) A) FHA, FSA/RHS & VA B) Conventional C) Refinancings D) Home Improvement Loans E) Loans on Dwellings For 5+ Families F) Non-occupant Loans on Number Average Value Number Average Value Number Average Value Number Average Value Number Average Value Number Average Value
LOANS ORIGINATED 85 $69,306 183 $78,722 273 $54,570 97 $15,246 0 $0 26 $46,937 APPLICATIONS APPROVED, NOT ACCEPTED 10 $77,491 15 $39,039 65 $59,805 31 $19,934 0 $0 3 $43,960 APPLICATIONS DENIED 4 $63,928 46 $65,705 219 $54,922 71 $13,178 1 $21,540 12 $56,234 APPLICATIONS WITHDRAWN 4 $51,335 15 $84,365 96 $53,689 1 $136,750 0 $0 1 $24,580 FILES CLOSED FOR INCOMPLETENESS 2 $56,615 0 $0 42 $70,256 3 $17,763 0 $0 1 $39,950
Aggregated Statistics For Year 1999(Based on 5 partial tracts) A) FHA, FSA/RHS & VA B) Conventional C) Refinancings D) Home Improvement Loans E) Loans on Dwellings For 5+ Families F) Non-occupant Loans on Number Average Value Number Average Value Number Average Value Number Average Value Number Average Value Number Average Value
LOANS ORIGINATED 37 $69,801 98 $76,876 211 $55,558 43 $18,610 1 $1,985,340 12 $51,617 APPLICATIONS APPROVED, NOT ACCEPTED 1 $75,670 6 $57,125 45 $57,163 16 $13,752 0 $0 1 $80,590 APPLICATIONS DENIED 1 $80,880 25 $49,163 92 $53,713 37 $13,424 1 $5,400 7 $41,337 APPLICATIONS WITHDRAWN 1 $72,560 14 $60,941 58 $53,108 10 $33,808 0 $0 2 $45,460 FILES CLOSED FOR INCOMPLETENESS 0 $0 0 $0 12 $49,603 0 $0 0 $0 1 $35,260
Private Mortgage Insurance Companies Aggregated Statistics For Year 2009(Based on 8 partial tracts) A) Conventional B) Refinancings Number Average Value Number Average Value
LOANS ORIGINATED 5 $70,556 4 $125,442 APPLICATIONS APPROVED, NOT ACCEPTED 1 $24,230 2 $122,280 APPLICATIONS DENIED 0 $0 0 $0 APPLICATIONS WITHDRAWN 0 $0 1 $55,990 FILES CLOSED FOR INCOMPLETENESS 0 $0 0 $0
Aggregated Statistics For Year 2008(Based on 10 partial tracts) A) Conventional B) Refinancings C) Non-occupant Loans on Number Average Value Number Average Value Number Average Value
LOANS ORIGINATED 16 $108,071 19 $82,802 4 $53,340 APPLICATIONS APPROVED, NOT ACCEPTED 6 $175,085 13 $127,120 0 $0 APPLICATIONS DENIED 1 $18,310 1 $114,040 1 $97,450 APPLICATIONS WITHDRAWN 1 $40,920 0 $0 0 $0 FILES CLOSED FOR INCOMPLETENESS 0 $0 0 $0 0 $0
Aggregated Statistics For Year 2007(Based on 10 partial tracts) A) Conventional B) Refinancings C) Non-occupant Loans on Number Average Value Number Average Value Number Average Value
LOANS ORIGINATED 54 $75,965 31 $101,131 4 $38,668 APPLICATIONS APPROVED, NOT ACCEPTED 6 $72,880 5 $81,782 1 $93,020 APPLICATIONS DENIED 2 $58,870 0 $0 0 $0 APPLICATIONS WITHDRAWN 1 $62,070 2 $89,090 0 $0 FILES CLOSED FOR INCOMPLETENESS 0 $0 2 $95,010 0 $0
Aggregated Statistics For Year 2006(Based on 10 partial tracts) A) Conventional B) Refinancings C) Non-occupant Loans on Number Average Value Number Average Value Number Average Value
LOANS ORIGINATED 36 $82,756 29 $97,140 4 $73,918 APPLICATIONS APPROVED, NOT ACCEPTED 7 $89,090 11 $100,991 0 $0 APPLICATIONS DENIED 1 $44,940 2 $66,610 0 $0 APPLICATIONS WITHDRAWN 1 $68,490 1 $41,790 0 $0 FILES CLOSED FOR INCOMPLETENESS 0 $0 0 $0 0 $0
Aggregated Statistics For Year 2005(Based on 10 partial tracts) A) Conventional B) Refinancings C) Non-occupant Loans on D) Loans On Manufactured Number Average Value Number Average Value Number Average Value Number Average Value
LOANS ORIGINATED 51 $80,889 35 $91,503 13 $46,017 1 $67,300 APPLICATIONS APPROVED, NOT ACCEPTED 11 $112,174 5 $43,810 1 $24,260 0 $0 APPLICATIONS DENIED 2 $59,115 2 $69,940 0 $0 0 $0 APPLICATIONS WITHDRAWN 2 $70,770 1 $28,270 0 $0 0 $0 FILES CLOSED FOR INCOMPLETENESS 0 $0 0 $0 0 $0 0 $0
Aggregated Statistics For Year 2004(Based on 10 partial tracts) A) Conventional B) Refinancings C) Non-occupant Loans on Number Average Value Number Average Value Number Average Value
LOANS ORIGINATED 59 $91,855 24 $93,812 6 $84,060 APPLICATIONS APPROVED, NOT ACCEPTED 12 $86,201 13 $76,655 1 $25,200 APPLICATIONS DENIED 1 $204,050 0 $0 0 $0 APPLICATIONS WITHDRAWN 0 $0 1 $64,920 0 $0 FILES CLOSED FOR INCOMPLETENESS 0 $0 0 $0 0 $0
Aggregated Statistics For Year 2003(Based on 10 partial tracts) A) Conventional B) Refinancings C) Non-occupant Loans on Number Average Value Number Average Value Number Average Value
LOANS ORIGINATED 68 $84,453 70 $87,456 16 $59,823 APPLICATIONS APPROVED, NOT ACCEPTED 12 $61,999 21 $113,390 1 $89,180 APPLICATIONS DENIED 0 $0 3 $42,640 2 $42,445 APPLICATIONS WITHDRAWN 4 $118,508 3 $79,903 0 $0 FILES CLOSED FOR INCOMPLETENESS 0 $0 0 $0 0 $0
Aggregated Statistics For Year 2002(Based on 10 partial tracts) A) Conventional B) Refinancings C) Non-occupant Loans on Number Average Value Number Average Value Number Average Value
LOANS ORIGINATED 46 $80,533 42 $97,523 5 $47,330 APPLICATIONS APPROVED, NOT ACCEPTED 12 $74,061 6 $125,018 2 $19,150 APPLICATIONS DENIED 0 $0 2 $67,460 1 $23,350 APPLICATIONS WITHDRAWN 2 $65,775 1 $75,620 0 $0 FILES CLOSED FOR INCOMPLETENESS 0 $0 0 $0 0 $0
Aggregated Statistics For Year 2001(Based on 10 partial tracts) A) Conventional B) Refinancings C) Non-occupant Loans on Number Average Value Number Average Value Number Average Value
LOANS ORIGINATED 65 $86,597 46 $86,630 8 $77,378 APPLICATIONS APPROVED, NOT ACCEPTED 11 $80,026 5 $114,780 1 $10,450 APPLICATIONS DENIED 3 $63,587 0 $0 0 $0 APPLICATIONS WITHDRAWN 0 $0 0 $0 0 $0 FILES CLOSED FOR INCOMPLETENESS 0 $0 0 $0 0 $0
Aggregated Statistics For Year 2000(Based on 10 partial tracts) A) Conventional B) Refinancings C) Non-occupant Loans on Number Average Value Number Average Value Number Average Value
LOANS ORIGINATED 57 $74,564 8 $74,091 3 $43,850 APPLICATIONS APPROVED, NOT ACCEPTED 3 $63,680 5 $127,816 2 $53,285 APPLICATIONS DENIED 2 $80,755 0 $0 0 $0 APPLICATIONS WITHDRAWN 0 $0 0 $0 0 $0 FILES CLOSED FOR INCOMPLETENESS 0 $0 0 $0 0 $0
Aggregated Statistics For Year 1999(Based on 5 partial tracts) A) Conventional B) Refinancings C) Non-occupant Loans on Number Average Value Number Average Value Number Average Value
LOANS ORIGINATED 28 $63,731 14 $92,698 2 $42,050 APPLICATIONS APPROVED, NOT ACCEPTED 3 $74,940 1 $66,520 1 $59,040 APPLICATIONS DENIED 1 $50,720 1 $88,530 1 $50,720 APPLICATIONS WITHDRAWN 0 $0 0 $0 0 $0 FILES CLOSED FOR INCOMPLETENESS 0 $0 0 $0 0 $0
2002 - 2018 National Fire Incident Reporting System (NFIRS) incidents See full 2006 National Fire Incident Reporting System statistics for zip code 48604, Michigan
Most common first names in zip code 48604 among deceased individuals Name Count Lived (average)
John 86 77.0 years Mary 80 79.3 years Joseph 55 74.4 years Edward 54 76.2 years William 53 74.2 years Robert 44 67.9 years James 40 67.2 years George 35 74.5 years Helen 34 79.5 years Frank 31 76.5 years
Most common last names in zip code 48604 among deceased individuals Last name Count Lived (average)
Otto 21 83.6 years Brown 21 75.5 years Bauer 20 81.0 years Metiva 16 78.4 years Miller 16 77.1 years Schultz 13 72.8 years Schmidt 13 80.6 years Taylor 13 78.4 years Davis 13 80.5 years Smith 12 74.1 years
Businesses in zip code 48604
Name Count Name Count
7-Eleven 3 Lane Furniture 1 ALDI 1 Little Caesars Pizza 2 AT&T 1 Long John Silver's 1 Abercrombie & Fitch 1 Lowe's 1 Abercrombie Kids 1 Macy's 1 Aeropostale 1 Marriott 2 American Eagle Outfitters 1 Maurices 1 Applebee's 1 McDonald's 1 Arby's 1 Meijer 1 Avenue 1 Men's Wearhouse 1 Barnes & Noble 1 Motherhood Maternity 1 Baskin-Robbins 1 New York & Co 1 Bath & Body Works 2 Nike 5 Buffalo Wild Wings 1 Nissan 1 Burger King 1 OfficeMax 1 Charlotte Russe 1 Old Country Buffet 1 Chuck E. Cheese's 1 Old Navy 1 Comfort Suites 1 Outback 1 Deb 1 Outback Steakhouse 1 Dennys 1 Pac Sun 1 DressBarn 1 Panda Express 1 Dressbarn 1 Payless 2 Express 1 PetSmart 1 Famous Footwear 1 Pier 1 Imports 1 Fashion Bug 1 Plato's Closet 1 FedEx 1 Qdoba Mexican Grill 1 Finish Line 1 RadioShack 1 Firestone Complete Auto Care 1 Rite Aid 1 Foot Locker 1 Rue21 1 GNC 2 Sam's Club 1 GameStop 2 Sears 3 Gap 1 Sephora 1 H&R Block 2 Spencer Gifts 1 Hobby Lobby 1 Sprint Nextel 3 Holiday Inn 1 Staples 1 Hollister Co. 1 Subway 4 Home Depot 1 Super 8 1 Hyundai 1 T-Mobile 3 JCPenney 1 T.G.I. Driday's 1 JoS. A. Bank 1 T.J.Maxx 1 Jones New York 1 Taco Bell 1 Journeys 1 Target 1 Justice 1 Toys"R"Us 1 KFC 1 UPS 4 Kincaid 1 Vans 1 Knights Inn 1 Verizon Wireless 1 Kohl's 1 Victoria's Secret 1 Kroger 1 Walmart 1 La-Z-Boy 2 Wet Seal 1
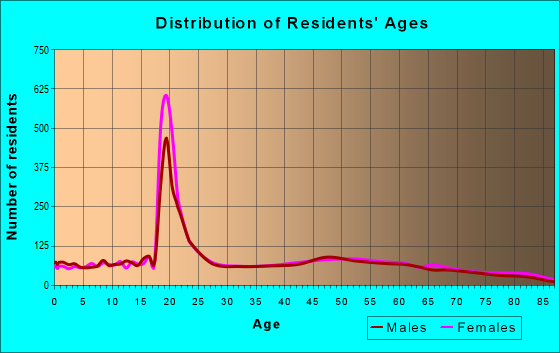
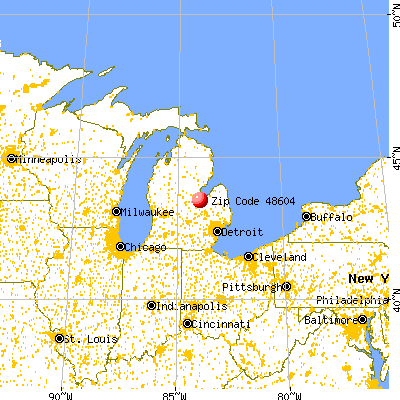


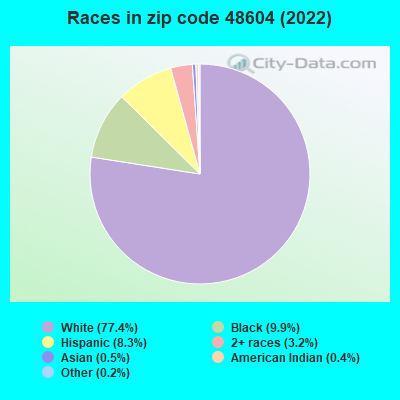


+$588
-$4,492
 Nearest zip codes: 48724, 48710, 48603, 48607, 48602, 48638.
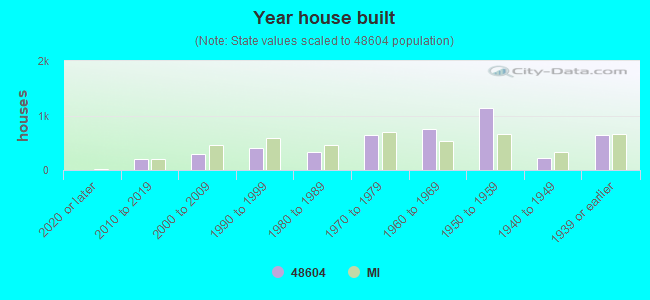
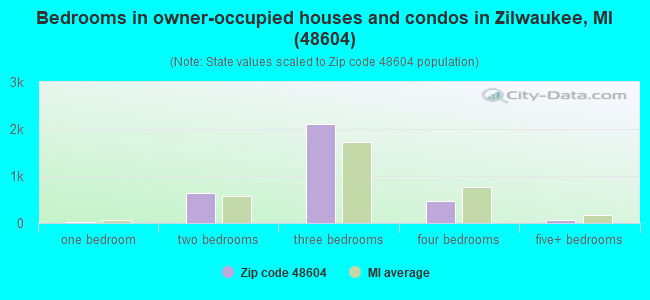
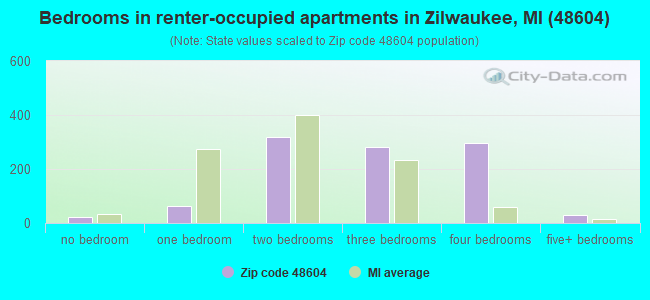
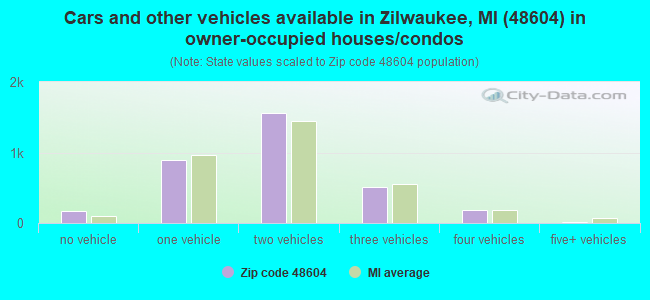
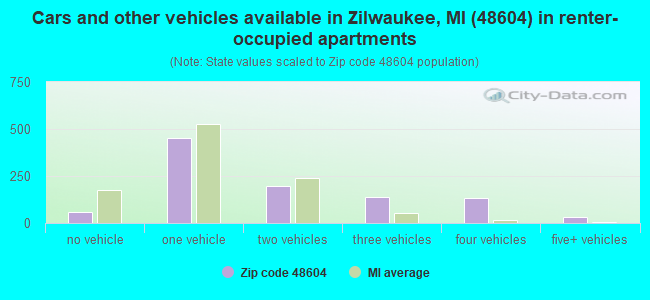


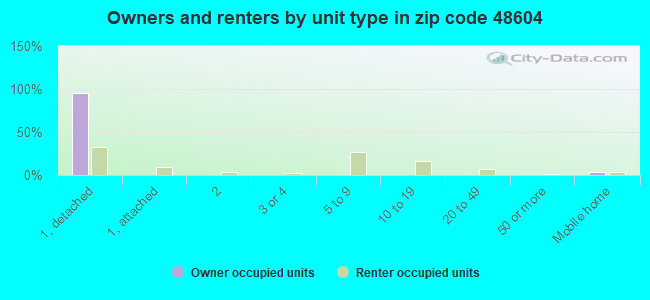


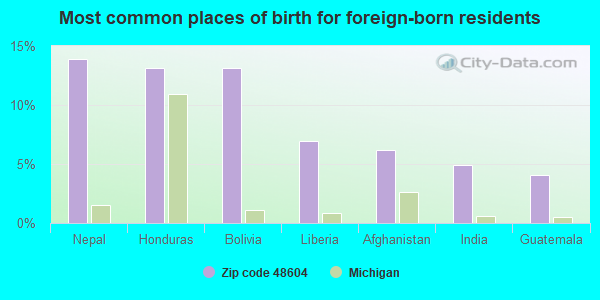
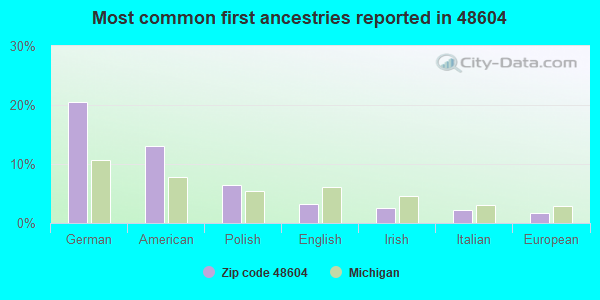
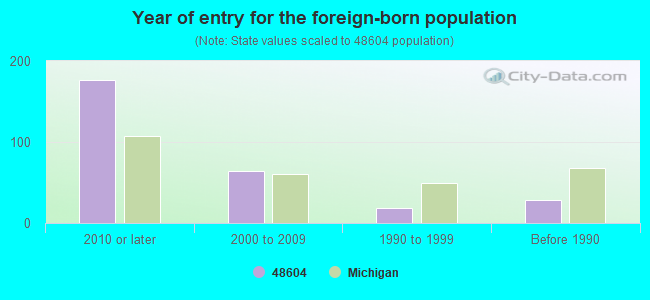


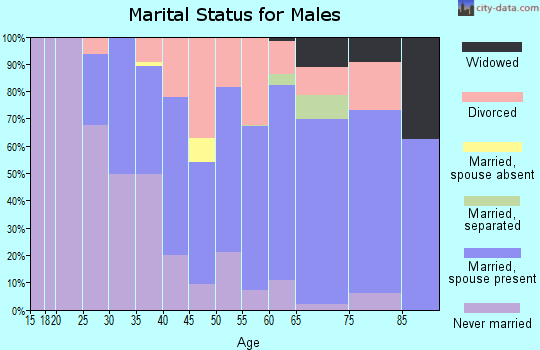

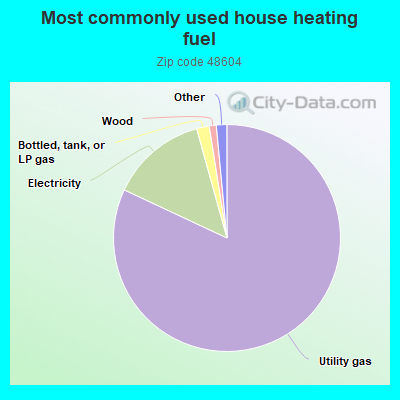
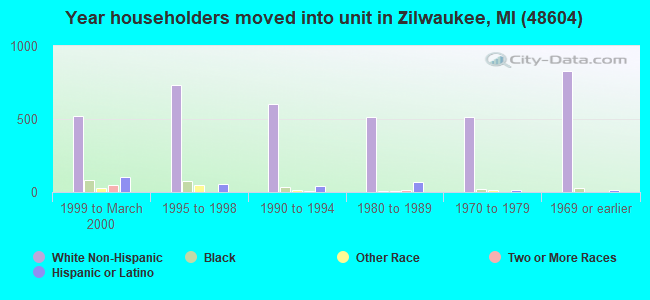
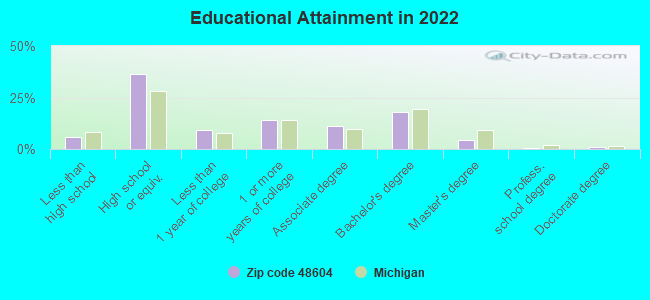
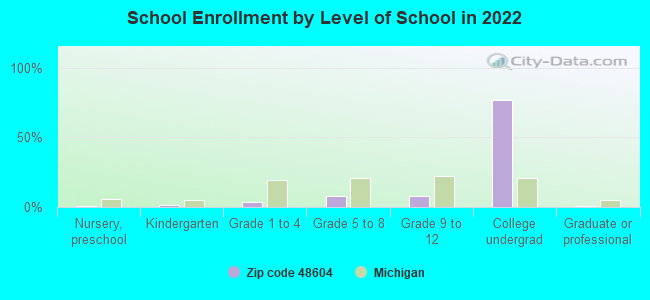
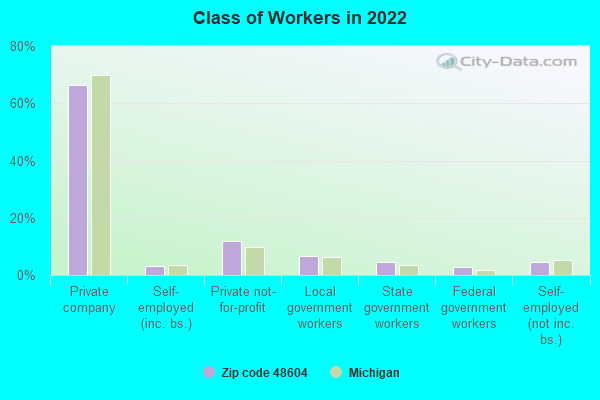
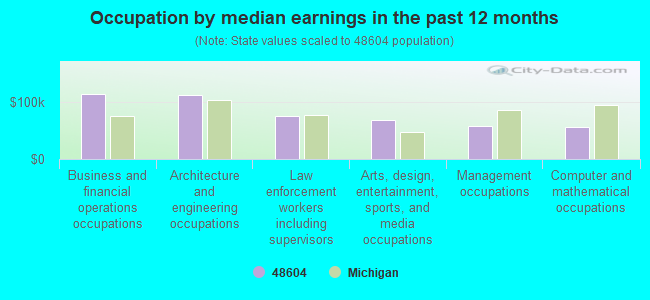
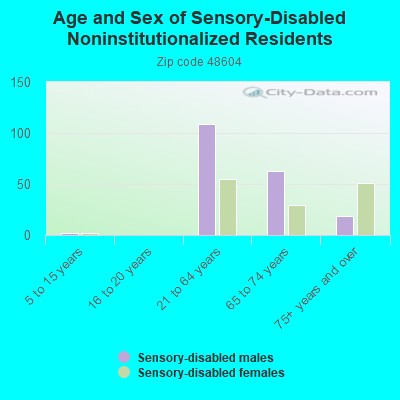
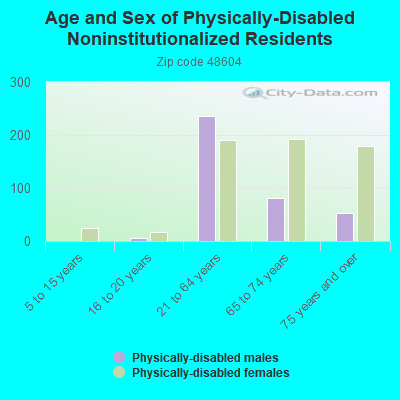
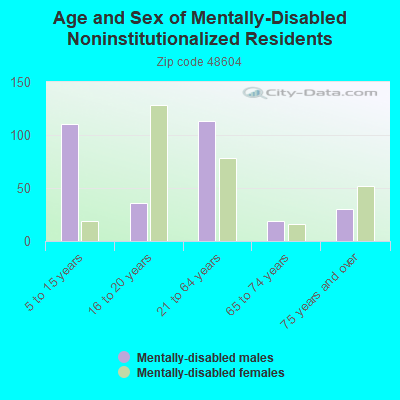
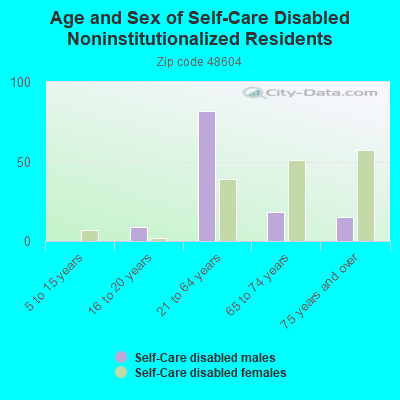
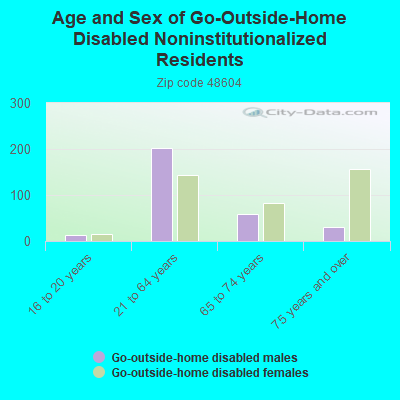
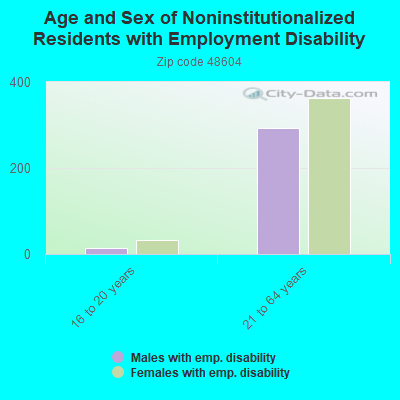
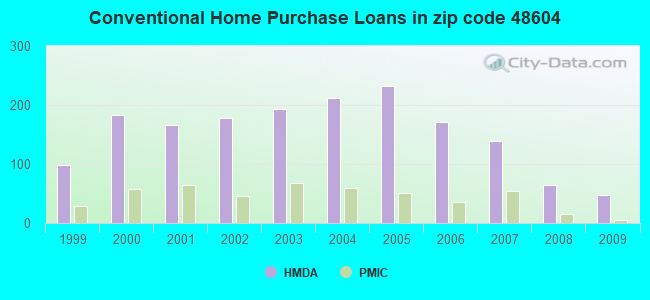
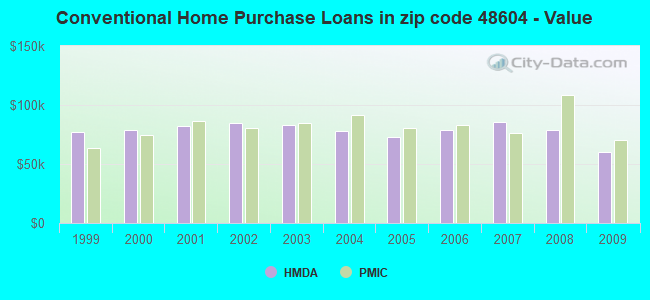
 Based on the data from the years 2002 - 2018 the average number of fire incidents per year is 42. The highest number of fires - 78 took place in 2003, and the least - 16 in 2013. The data has a growing trend.
 When looking into fire subcategories, the most reports belonged to: Structure Fires (45.0%), and Outside Fires (24.4%).