Estimated zip code population in 2022: 27,509 Zip code population in 2010: 30,119 Zip code population in 2000: 32,888
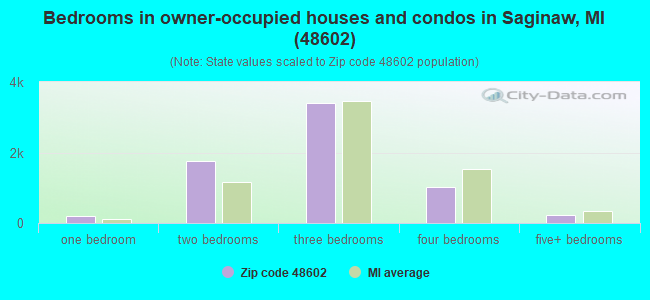
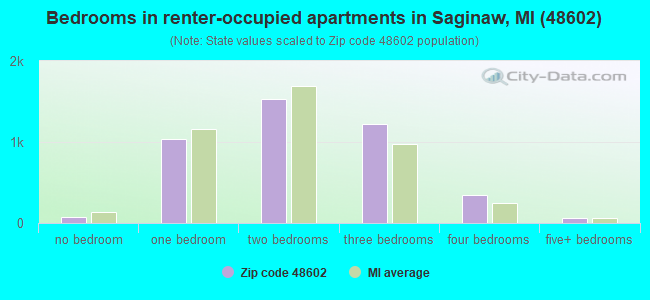
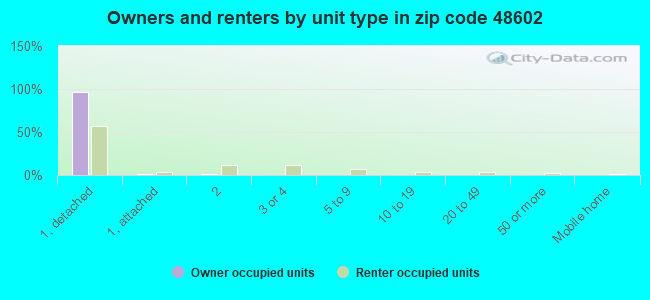
Houses and condos: 12,142 Renter-occupied apartments: 4,277
% of renters here:
39%
State:
27%
March 2022 cost of living index in zip code 48602: 81.6 (low, U.S. average is 100)
Land area: 7.8 sq. mi. Water area: 0.3 sq. mi.
Population density: 3,513 people per square mile
(average).
OSM Map
General Map
Google Map
MSN Map
OSM Map
General Map
Google Map
MSN Map
OSM Map
General Map
Google Map
MSN Map
OSM Map
General Map
Google Map
MSN Map
Please wait while loading the map...
Real estate property taxes paid for housing units in 2022:
This zip code:
2.1% ($1,501)
Michigan:
1.2% ($2,746)
Median real estate property taxes paid for housing units with mortgages in 2022: $1,582 (2.1%) Median real estate property taxes paid for housing units with no mortgage in 2022: $1,410 (2.2%)
Business Search- 14 Million verified businesses
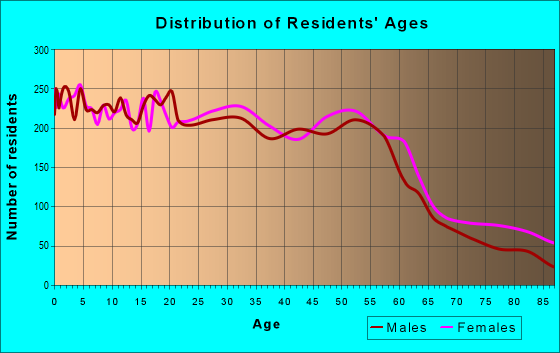
Males: 13,804
(50.2%)
Females: 13,705
(49.8%)
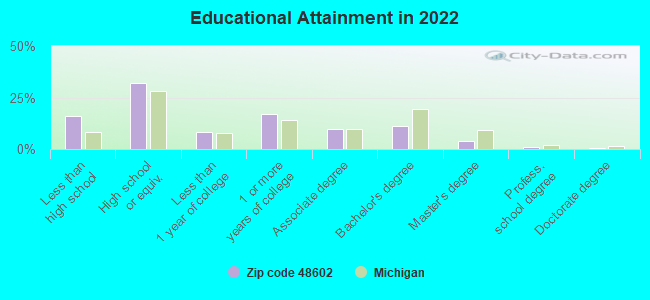
For population 25 years and over in 48602:
High school or higher: 83.4%
Bachelor's degree or higher: 16.5%
Graduate or professional degree: 5.4%
Unemployed: 7.3%
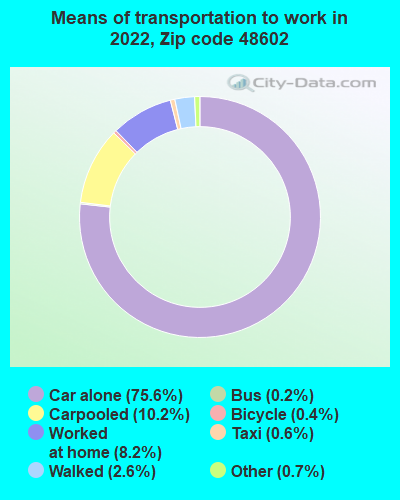
Mean travel time to work (commute): 18.9 minutes
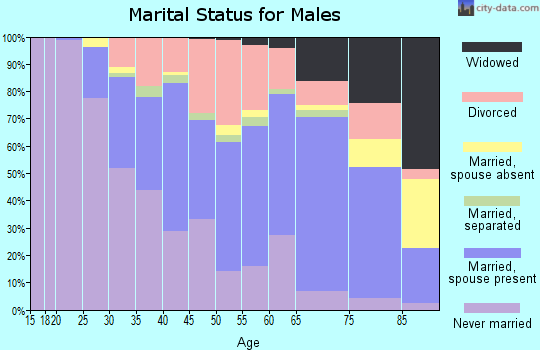
For population 15 years and over in 48602:
Never married: 47.0%
Now married: 32.5%
Separated: 1.7%
Widowed: 5.1%
Divorced: 13.7%
Zip code 48602 compared to state average:
Median household income below state average.
Median house value significantly below state average.
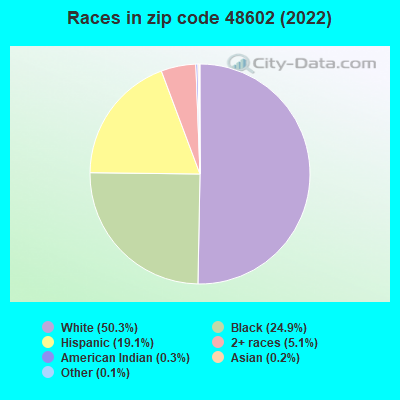
Black race population percentage above state average.
Hispanic race population percentage significantly above state average.
Median age below state average.
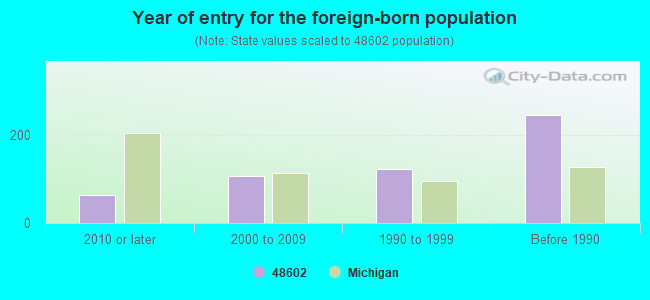
Foreign-born population percentage significantly below state average.
Length of stay since moving in above state average.
House age above state average.
Percentage of population with a bachelor's degree or higher below state average.
Averages for the 2020 tax year for zip code 48602, filed in 2021:
Average Adjusted Gross Income (AGI) in 2020: $35,405 (Individual Income Tax Returns)
Here:
$35,405
State:
$68,945
Salary/wage: $30,761 (reported on 79.5% of returns)
Here:
$30,761
State:
$57,142
(% of AGI for various income ranges: 985.0% for AGIs below $25k, 3080.4% for AGIs $25k-50k, 6297.0% for AGIs $50k-75k, 9042.6% for AGIs $75k-100k, 14530.0% for AGIs $100k-200k, 71846.7% for AGIs over 200k)
Taxable interest for individuals: $671 (reported on 16.6% of returns)
This zip code:
$671
Michigan:
$1,630
(% of AGI for various income ranges: 5.5% for AGIs below $25k, 7.3% for AGIs $25k-50k, 22.4% for AGIs $50k-75k, 37.6% for AGIs $75k-100k, 62.6% for AGIs $100k-200k, 1193.3% for AGIs over 200k)
Ordinary dividends: $3,712 (reported on 6.7% of returns)
Here:
$3,712
State:
$6,972
(% of AGI for various income ranges: 6.2% for AGIs below $25k, 11.0% for AGIs $25k-50k, 36.0% for AGIs $50k-75k, 102.4% for AGIs $75k-100k, 399.3% for AGIs $100k-200k, 2060.0% for AGIs over 200k)
Net capital gain/loss in AGI: +$7,115 (reported on 6.0% of returns)
Here:
+$7,115
State:
+$20,064
(% of AGI for various income ranges: 2.0% for AGIs below $25k, 7.6% for AGIs $25k-50k, 49.4% for AGIs $50k-75k, 131.1% for AGIs $75k-100k, 424.1% for AGIs $100k-200k, 9340.0% for AGIs over 200k)
Profit/loss from business: +$6,177 (reported on 11.7% of returns)
Here:
+$6,177
State:
+$11,172
(% of AGI for various income ranges: 72.4% for AGIs below $25k, 50.3% for AGIs $25k-50k, 60.8% for AGIs $50k-75k, 120.3% for AGIs $75k-100k, 254.1% for AGIs $100k-200k, 7696.7% for AGIs over 200k)
Taxable individual retirement arrangement distribution: $12,110 (reported on 4.9% of returns)
48602:
$12,110
Michigan:
$19,803
(% of AGI for various income ranges: 18.5% for AGIs below $25k, 47.3% for AGIs $25k-50k, 142.8% for AGIs $50k-75k, 316.3% for AGIs $75k-100k, 593.3% for AGIs $100k-200k, 2600.0% for AGIs over 200k)
Total itemized deductions: $28,141 (reported on 1.8% of returns)
Here:
$28,141
State:
$34,117
(% of AGI for various income ranges: 8.0% for AGIs below $25k, 34.4% for AGIs $25k-50k, 101.0% for AGIs $50k-75k, 233.2% for AGIs $75k-100k, 589.3% for AGIs $100k-200k, 4090.0% for AGIs over 200k)
Charity contributions: $11,547 (reported on 1.5% of returns)
Here:
$11,547
State:
$13,548
(% of AGI for various income ranges: 9.3% for AGIs $25k-50k, 35.8% for AGIs $50k-75k, 64.7% for AGIs $75k-100k, 229.3% for AGIs $100k-200k, 2243.3% for AGIs over 200k)
Taxes paid: $5,714 (reported on 1.8% of returns)
48602:
$5,714
State:
$7,972
(% of AGI for various income ranges: 1.0% for AGIs below $25k, 5.6% for AGIs $25k-50k, 16.0% for AGIs $50k-75k, 56.3% for AGIs $75k-100k, 146.3% for AGIs $100k-200k, 873.3% for AGIs over 200k)
Earned income credit: $2,537 (reported on 31.0% of returns)
Here:
$2,537
State:
$2,251
(% of AGI for various income ranges: 132.9% for AGIs below $25k, 109.9% for AGIs $25k-50k, 2.9% for AGIs $50k-75k)
Percentage of individuals using paid preparers for their 2020 taxes: 94.4%
Here:
94%
State:
93%
(% for various income ranges: 94.1% for AGIs below $25k, 94.8% for AGIs $25k-50k, 94.0% for AGIs $50k-75k, 92.9% for AGIs $75k-100k, 95.6% for AGIs $100k-200k, 100.0% for AGIs over 200k)
Averages for the 2012 tax year for zip code 48602, filed in 2013:
Average Adjusted Gross Income (AGI) in 2012: $34,488 (Individual Income Tax Returns)
Here:
$34,488
State:
$55,609
Salary/wage: $27,759 (reported on 81.8% of returns)
Here:
$27,759
State:
$46,782
(% of AGI for various income ranges: 72.1% for AGIs below $25k, 75.9% for AGIs $25k-50k, 75.4% for AGIs $50k-75k, 72.3% for AGIs $75k-100k, 65.1% for AGIs $100k-200k, 30.8% for AGIs over 200k)
Taxable interest for individuals: $805 (reported on 23.5% of returns)
This zip code:
$805
Michigan:
$1,491
(% of AGI for various income ranges: 0.6% for AGIs below $25k, 0.5% for AGIs $25k-50k, 0.6% for AGIs $50k-75k, 0.5% for AGIs $75k-100k, 0.6% for AGIs $100k-200k, 0.6% for AGIs over 200k)
Ordinary dividends: $4,033 (reported on 10.0% of returns)
Here:
$4,033
State:
$6,225
(% of AGI for various income ranges: 0.7% for AGIs below $25k, 0.4% for AGIs $25k-50k, 0.9% for AGIs $50k-75k, 1.1% for AGIs $75k-100k, 2.1% for AGIs $100k-200k, 2.5% for AGIs over 200k)
Net capital gain/loss in AGI: +$3,740 (reported on 6.8% of returns)
Here:
+$3,740
State:
+$9,326
(% of AGI for various income ranges: 0.2% for AGIs $50k-75k, 1.2% for AGIs $100k-200k, 3.8% for AGIs over 200k)
Profit/loss from business: +$7,613 (reported on 12.3% of returns)
Here:
+$7,613
State:
+$11,523
(% of AGI for various income ranges: 7.8% for AGIs below $25k, 1.7% for AGIs $25k-50k, 1.0% for AGIs $50k-75k, 1.4% for AGIs $75k-100k, 1.8% for AGIs $100k-200k, 1.2% for AGIs over 200k)
Taxable individual retirement arrangement distribution: $11,317 (reported on 7.4% of returns)
48602:
$11,317
Michigan:
$15,298
(% of AGI for various income ranges: 1.4% for AGIs below $25k, 2.1% for AGIs $25k-50k, 2.4% for AGIs $50k-75k, 3.3% for AGIs $75k-100k, 5.4% for AGIs $100k-200k, 1.8% for AGIs over 200k)
Total itemized deductions: $18,727 (19% of AGI, reported on 14.8% of returns)
Here:
$18,727
State:
$21,628
Here:
19.1% of AGI
State:
18.4% of AGI
(% of AGI for various income ranges: 3.7% for AGIs below $25k, 6.4% for AGIs $25k-50k, 8.5% for AGIs $50k-75k, 9.1% for AGIs $75k-100k, 12.4% for AGIs $100k-200k, 11.6% for AGIs over 200k)
Charity contributions: $4,977 (reported on 12.1% of returns)
Here:
$4,977
State:
$4,225
(% of AGI for various income ranges: 0.4% for AGIs below $25k, 1.1% for AGIs $25k-50k, 1.9% for AGIs $50k-75k, 1.9% for AGIs $75k-100k, 2.7% for AGIs $100k-200k, 3.4% for AGIs over 200k)
Taxes paid: $7,271 (reported on 14.8% of returns)
48602:
$7,271
State:
$8,327
(% of AGI for various income ranges: 0.6% for AGIs below $25k, 1.8% for AGIs $25k-50k, 2.9% for AGIs $50k-75k, 3.6% for AGIs $75k-100k, 5.2% for AGIs $100k-200k, 6.7% for AGIs over 200k)
Earned income credit: $2,571 (reported on 32.8% of returns)
Here:
$2,571
State:
$2,306
(% of AGI for various income ranges: 10.4% for AGIs below $25k, 1.5% for AGIs $25k-50k)
Percentage of individuals using paid preparers for their 2012 taxes: 52.1%
Here:
52%
State:
57%
(% for various income ranges: 48.5% for AGIs below $25k, 53.2% for AGIs $25k-50k, 58.7% for AGIs $50k-75k, 61.5% for AGIs $75k-100k, 71.4% for AGIs $100k-200k, 87.5% for AGIs over 200k)
Averages for the 2004 tax year for zip code 48602, filed in 2005:
Average Adjusted Gross Income (AGI) in 2004: $31,554 (Individual Income Tax Returns)
Here:
$31,554
State:
$48,204
Salary/wage: $28,891 (reported on 86.5% of returns)
Here:
$28,891
State:
$42,791
(% of AGI for various income ranges: 80.8% for AGIs below $10k, 75.1% for AGIs $10k-25k, 82.2% for AGIs $25k-50k, 84.0% for AGIs $50k-75k, 81.5% for AGIs $75k-100k, 69.5% for AGIs over 100k)
Taxable interest for individuals: $1,143 (reported on 37.1% of returns)
This zip code:
$1,143
Michigan:
$1,725
(% of AGI for various income ranges: 2.5% for AGIs below $10k, 1.8% for AGIs $10k-25k, 0.9% for AGIs $25k-50k, 0.8% for AGIs $50k-75k, 1.0% for AGIs $75k-100k, 2.4% for AGIs over 100k)
Taxable dividends: $2,539 (reported on 15.4% of returns)
Here:
$2,539
State:
$3,420
(% of AGI for various income ranges: 1.6% for AGIs below $10k, 1.1% for AGIs $10k-25k, 0.7% for AGIs $25k-50k, 0.8% for AGIs $50k-75k, 1.1% for AGIs $75k-100k, 2.9% for AGIs over 100k)
Net capital gain/loss: +$2,727 (reported on 10.9% of returns)
Here:
+$2,727
State:
+$8,532
(% of AGI for various income ranges: -1.1% for AGIs below $10k, -0.0% for AGIs $10k-25k, 0.3% for AGIs $25k-50k, 0.4% for AGIs $50k-75k, 0.7% for AGIs $75k-100k, 4.4% for AGIs over 100k)
Profit/loss from business: +$5,900 (reported on 10.6% of returns)
Here:
+$5,900
State:
+$9,547
(% of AGI for various income ranges: 6.3% for AGIs below $10k, 2.8% for AGIs $10k-25k, 1.1% for AGIs $25k-50k, 1.2% for AGIs $50k-75k, 1.0% for AGIs $75k-100k, 3.5% for AGIs over 100k)
IRA payment deduction: $2,000 (reported on 1.6% of returns)
48602:
$2,000
Michigan:
$2,875
(% of AGI for various income ranges: 0.1% for AGIs below $10k, 0.2% for AGIs $10k-25k, 0.2% for AGIs $25k-50k, 0.1% for AGIs $50k-75k)
Self-employed pension: $13,700 (reported on 0.2% of returns)
Here:
$13,700
Michigan:
$13,826
Total itemized deductions: $13,866 (22% of AGI, reported on 23.7% of returns)
Here:
$13,866
State:
$18,509
Here:
21.8% of AGI
State:
20.7% of AGI
(% of AGI for various income ranges: 5.0% for AGIs below $10k, 5.6% for AGIs $10k-25k, 10.0% for AGIs $25k-50k, 11.8% for AGIs $50k-75k, 13.1% for AGIs $75k-100k, 13.3% for AGIs over 100k)
Charity contributions deductions: $2,784 (4% of AGI, reported on 21.1% of returns)
Here:
$2,784
State:
$3,365
Here:
4.2% of AGI
State:
3.6% of AGI
(% of AGI for various income ranges: 0.2% for AGIs below $10k, 0.8% for AGIs $10k-25k, 1.4% for AGIs $25k-50k, 1.9% for AGIs $50k-75k, 2.7% for AGIs $75k-100k, 3.2% for AGIs over 100k)
Total tax: $4,194 (reported on 66.6% of returns)
48602:
$4,194
State:
$7,691
(% of AGI for various income ranges: 1.7% for AGIs below $10k, 3.5% for AGIs $10k-25k, 6.4% for AGIs $25k-50k, 9.1% for AGIs $50k-75k, 10.9% for AGIs $75k-100k, 18.2% for AGIs over 100k)
Earned income credit: $1,869 (reported on 25.6% of returns)
Here:
$1,869
State:
$1,737
Percentage of individuals using paid preparers for their 2004 taxes: 62.3%
Here:
62%
State:
60%
(% for various income ranges: 56.5% for AGIs below $10k, 62.7% for AGIs $10k-25k, 63.6% for AGIs $25k-50k, 65.7% for AGIs $50k-75k, 66.0% for AGIs $75k-100k, 74.3% for AGIs over 100k)
Likely homosexual households (counted as self-reported same-sex unmarried-partner households)
Lesbian couples: 0.3% of all households
Gay men: 0.0% of all households
Household received Food Stamps/SNAP in the past 12 months: 4,183 Household did not receive Food Stamps/SNAP in the past 12 months: 6,969
Women who had a birth in the past 12 months: 351 (186 now married, 161 unmarried) Women who did not have a birth in the past 12 months: 6,271 (1,490 now married, 4,803 unmarried)
Housing units in zip code 48602 with a mortgage: 3,764 (213 second mortgage, 197 both second mortgage and home equity loan) Houses without a mortgage: 134
Median monthly owner costs for units with a mortgage: $977 Median monthly owner costs for units without a mortgage: $463
Residents with income below the poverty level in 2022:
This zip code:
29.5%
Whole state:
13.4%
Residents with income below 50% of the poverty level in 2022:
This zip code:
16.1%
Whole state:
6.9%
Median number of rooms in houses and condos:
Here:
6.2
State:
6.5
Median number of rooms in apartments:
Here:
4.7
State:
4.3
Notable locations in this zip code not listed on our city pages
Notable locations in zip code 48602: Green Point Environmental Learning Center (A), Germania Town and Country Club (B), Saginaw Fire Department Station 2 (C), Saginaw Fire Department Station 4 (D), Butman-Fish Branch Library (E), Saginaw Railway Museum (F), Theodore Roethke House (G), Mid-Michigan Children's Museum (H), Saginaw Art Museum (I), Saginaw County Courthouse (J), Saginaw County Sheriff's Office (K). Display/hide their locations on the map
Churches in zip code 48602 include: Bethlehem Lutheran Church (A), True Life Apostolic Church (B), Church of God Seventh Day (C), Community Christian Reformed Church (D), Saint John Episcopal Church (E), West Michigan Avenue United Methodist Church (F), Faith Harvest Church (G), Saginaw Bay United Methodist Church (H), Living Hope Church (I). Display/hide their locations on the map
Parks in zip code 48602 include: Borchard Park (1), Herig Park (2), Green Point Nature Center (3), Skivington Park (4), Merrill Park Center (5), Bliss Park Historical Marker (6), Saginaw Oil Industry Historical Marker (7), Saginaw Valley Lumbering Era Historical Marker (8), Theodore H Roethke Childhood Home Historical Marker (9). Display/hide their locations on the map
2,535 married couples with children.
3,910 single-parent households (649 men, 3,261 women).
95.5% of residents of 48602 zip code speak English at home.
2.9% of residents speak Spanish at home (55% very well, 16% well, 26% not well, 3% not at all).
0.8% of residents speak other Indo-European language at home (97% very well, 3% well).
0.3% of residents speak Asian or Pacific Island language at home (91% very well, 3% well, 6% not at all).
0.1% of residents speak other language at home (100% very well).
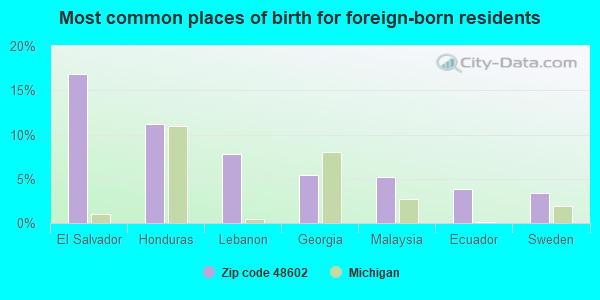
Foreign born population: 388 (1.4%) (68.0% of them are naturalized citizens)
Major facilities with environmental interests located in this zip code:
ARTHUR HILL H SCHOOL (3115 MACKINAW in SAGINAW, MI)
AIR MINOR (AIRS/AFS) (National Center for Education Statistics) - STATE ID-00125 Conditionally Exempt Small Quantity Generators, less than 100 kg/month of hazardous waste (Resource Conservation and Recovery Act (tracking hazardous waste)) Business SIC classification: ELEMENTARY AND SECONDARY SCHOOLS Organizations: CITY OF SAGINAW SCHOOL DISTRICT (CONTACT/OWNER)
, SAGINAW CITY SCHOOL DISTRICT (SCHOOL DISTRICT)
Alternative names: ARTHUR HILL HIGH SCHOOL
ACADEMY FOR TECHNOLOGY & ENTERPRISE (2102 WEISS STREET in SAGINAW, MI)
(National Center for Education Statistics) - STATE ID-08049 Conditionally Exempt Small Quantity Generators, less than 100 kg/month of hazardous waste (Resource Conservation and Recovery Act (tracking hazardous waste)) Organizations: SAGINAW PUBLIC SCHOOLS (CONTACT/OPERATOR)
Alternative names: CAREER OPPORTUNITIES CENTER, CAREER OPPORTUNITY CTR, SAGINAW CAREER COMPLEX
FUERBRINGER SCHOOL (2138 N. CAROLINA STREET in SAGINAW, MI)
(Geographic Names Information System) (National Center for Education Statistics) - STATE ID-01337 Organizations: SAGINAW CITY SCHOOL DISTRICT (SCHOOL DISTRICT)
CHESTER F. MILLER SCHOOL (2020 BROCKWAY STREET in SAGINAW, MI)
(National Center for Education Statistics) - STATE ID-00667 Organizations: SAGINAW CITY SCHOOL DISTRICT (SCHOOL DISTRICT)
MERRILL PARK ELEMENTARY SCHOOL (1800 GROUT STREET in SAGINAW, MI)
(National Center for Education Statistics) - STATE ID-02521 Organizations: SAGINAW CITY SCHOOL DISTRICT (SCHOOL DISTRICT)
MI DEPT/ENVIRONMENTAL QUALITY (1934 W MICHIGAN AVE in SAGINAW, MI)
(Resource Conservation and Recovery Act (tracking hazardous waste)) Business NAICS classification: OFFICES OF BANK HOLDING COMPANIES. Organizations: HERITAGE FEDERAL SAVINGS (CONTACT/OPERATOR)
, STATE OF MICHIGAN (CONTACT/OWNER)
Alternative names: HERITAGE FEDERAL SAVINGS
GARBER BUICK CO (315 W. GENESEE in SAGINAW, MI)
HAZARDOUS WASTE BIENNIAL REPORTER (Resource Conservation and Recovery Act (tracking hazardous waste)) (Resource Conservation and Recovery Act (tracking hazardous waste)) Organizations: GARBER DICK (CONTACT/OWNER)
MI DEPT/TRANSPORTATION (100 - 1000 S NIAGARA in SAGINAW, MI)
(Resource Conservation and Recovery Act (tracking hazardous waste)) Organizations: MICH DEPT OF TRANSPORTATION (CONTACT/OPERATOR)
ALL SEASONS AUTOMOTIVE (300 N MICHIGAN in SAGINAW, MI)
(Resource Conservation and Recovery Act (tracking hazardous waste)) Organizations: SARROW BILL (CONTACT/OWNER)
FORMER ACTION AUTO 49 (1411 COURT ST in SAGINAW, MI)
(Resource Conservation and Recovery Act (tracking hazardous waste)) Organizations: NETZ LP CARE OF THE LCP GROUP (CONTACT/OWNER)
Housing units lacking complete plumbing facilities: 2.2% Housing units lacking complete kitchen facilities: 4.1%
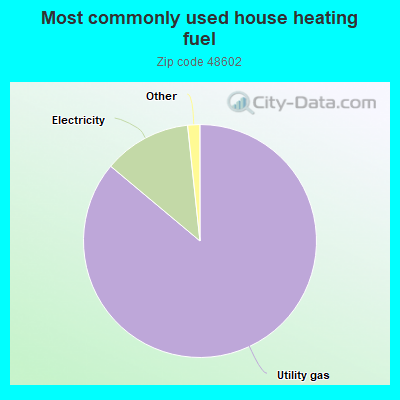
86.1%Utility gas
12.2%Electricity
0.7%No fuel used
0.5%Bottled, tank, or LP gas
Population in 1990: 34,096.
Place of birth for U.S.-born residents:
This state: 23,844
Northeast: 276
Midwest: 1,090
South: 1,394
West: 275
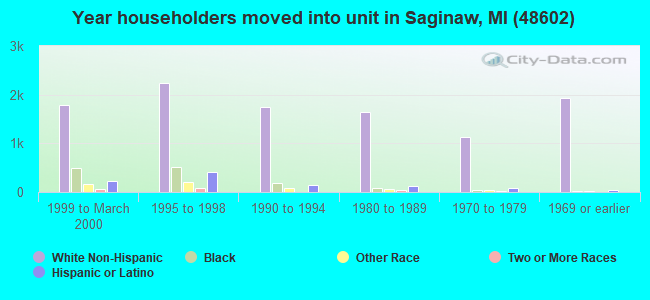
56% of the 48602 zip code residents lived in the same house 5 years ago. Out of people who lived in different houses, 76% lived in this county. Out of people who lived in different counties, 50% lived in Michigan.
89% of the 48602 zip code residents lived in the same house 1 year ago. Out of people who lived in different houses, 58% moved from this county. Out of people who lived in different houses, 29% moved from different county within same state. Out of people who lived in different houses, 11% moved from different state. Out of people who lived in different houses, 1% moved from abroad.
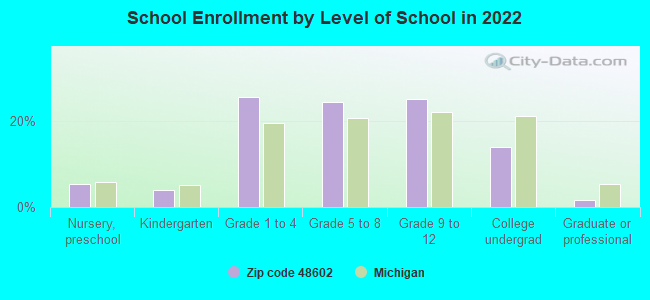
Private vs. public school enrollment:
Students in private schools in grades 1 to 8 (elementary and middle school): 328
Here:
10.4%
Michigan:
12.4%
Students in private schools in grades 9 to 12 (high school): 94
Here:
6.0%
Michigan:
9.8%
Students in private undergraduate colleges: 80
Here:
9.0%
Michigan:
14.9%
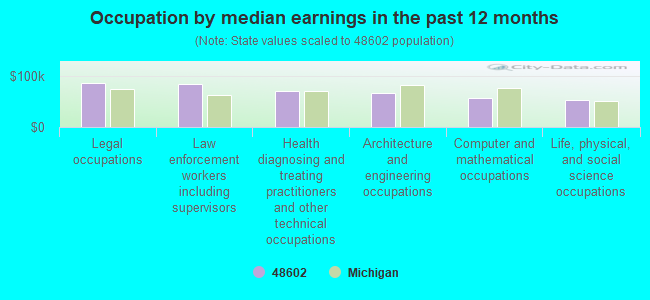
Occupation by median earnings in the past 12 months ($)
85,709Legal occupations
83,479Law enforcement workers including supervisors
70,131Health diagnosing and treating practitioners and other technical occupations
65,465Architecture and engineering occupations
57,181Computer and mathematical occupations
51,986Life, physical, and social science occupations
Companies with federal contracts located in this zip code (SAGINAW, MI):
THOMSON SAGINAW BALL SCREW LLC (628 N HAMILTON ST) : $10,311,053 in 95 contractsfrom 1999 to 2006
Contracts for Miscellaneous Aircraft Accessories and Components, Bearings, Antifriction, Unmounted, Miscellaneous Engine Accessories, Aircraft, Radar Equipment, Except Airborne, and moreby Defense Logistics Agency, Air Force, Navy Signed by year:2000: $2,304,020; 2001: $1,447,230; 2002: $4,180,373; 2003: $1,714,463; 2004: $464,049; 2005: $0; 2006: $24,564.
Biggest contracts:
$1,124,640 with Defense Logistics Agency for Miscellaneous Aircraft Accessories and Components. Signed on 2002-01-16. Completion date: 2002-09-03.
$924,787 with Air Force for Miscellaneous Aircraft Accessories and Components. Signed on 2003-05-13. Completion date: 2004-02-20.
$654,160, same as above.Signed on 2003-08-01. Completion date: 2004-07-01.
$628,966, same as above.Signed on 2002-12-23. Completion date: 2003-06-30.
LINEAR MOTION, LLC (628 N HAMILTON ST; small business) 1000 employees, $0 revenue. : $1,196,763 in 40 contractsfrom 2003 to 2006
Contracts for Miscellaneous Aircraft Accessories and Components, Miscellaneous Engine Accessories, Aircraft by Defense Logistics Agency, Air Force Signed by year:2000: $0; 2001: $0; 2002: $0; 2003: $166,673; 2004: $763,769; 2005: $153,697; 2006: $112,624.
Biggest contracts:
$107,113 with Defense Logistics Agency for Miscellaneous Aircraft Accessories and Components. Signed on 2004-11-10. Completion date: 2005-07-20.
$105,798, same as above.Signed on 2003-10-22. Completion date: 2004-07-14.
$98,616, same as above.Signed on 2004-03-19. Completion date: 2005-01-21.
$98,616, same as above.Signed on 2004-01-30. Completion date: 2004-11-05.
COVENANT HEALTHCARE ()
$46,185 with Department of Veterans Affairs for Laboratory Testing Services. Signed on 2005-10-01. Completion date: 2005-12-31.
CITY ENVIRONMENTAL SERVICES, I (1311 N NIAGARA STREET) : $1,580 in 2 contractsin 2003
$1,580 with Army for Trash/Garbage Collection Services - Including Portable Sanitation Services. Signed on 2003-02-18. Completion date: 2004-03-31.
$0, same as above.Signed on 2003-02-18. Completion date: 2004-03-31.
Top industries in this zip code by the number of employees in 2005:
Health Care and Social Assistance: General Medical and Surgical Hospitals (over 1000 employees: 2 establishments, 250-499 employees: 2 establishments, 50-99 employees: 1 establishment)
Administrative and Support and Waste Management and Remediation Services: Janitorial Services (500-999: 1, 1-4: 1)
Health Care and Social Assistance: Nursing Care Facilities (100-249: 3)
Health Care and Social Assistance: Offices of Physicians (except Mental Health Specialists) (100-249: 1, 50-99: 1, 20-49: 1, 10-19: 5, 5-9: 17, 1-4: 11)
2002 - 2018 National Fire Incident Reporting System (NFIRS) incidents
Based on the data from the years 2002 - 2018 the average number of fires per year is 150. The highest number of fires - 207 took place in 2007, and the least - 117 in 2018. The data has a dropping trend.
When looking into fire subcategories, the most reports belonged to: Structure Fires (56.2%), and Outside Fires (26.3%).
Fire incident types reported to NFIRS in Zip Code 48602
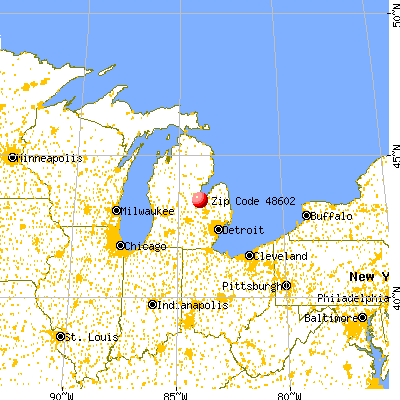


 Nearest zip codes: 48607, 48638, 48724, 48603, 48604, 48601.
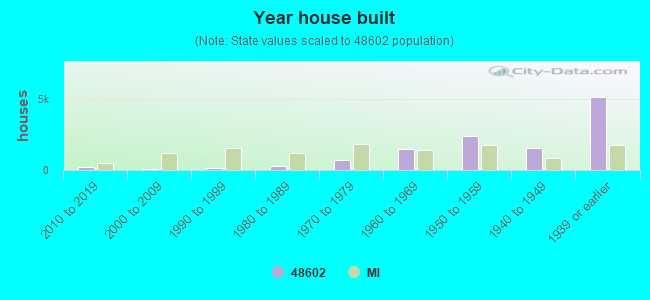


 Based on the data from the years 2002 - 2018 the average number of fires per year is 150. The highest number of fires - 207 took place in 2007, and the least - 117 in 2018. The data has a dropping trend.
 When looking into fire subcategories, the most reports belonged to: Structure Fires (56.2%), and Outside Fires (26.3%).