Estimated zip code population in 2022: 2,573 Zip code population in 2010: 2,680 Zip code population in 2000: 3,420
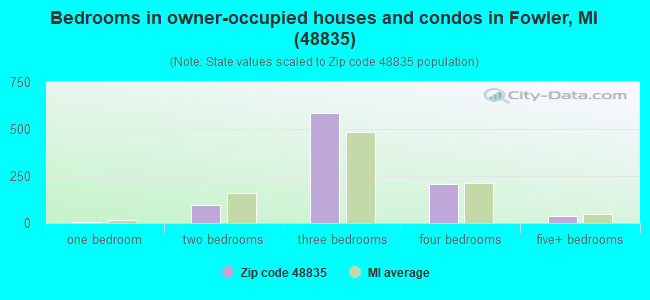
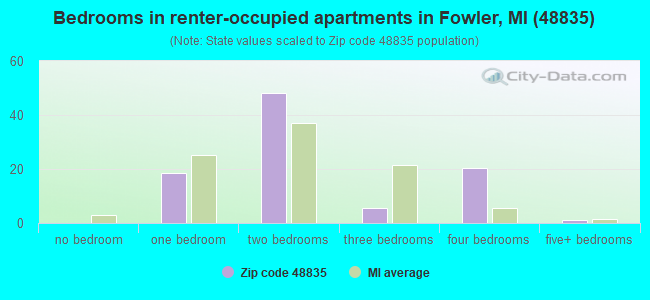
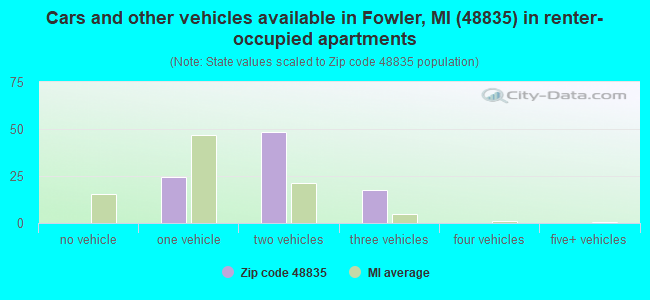
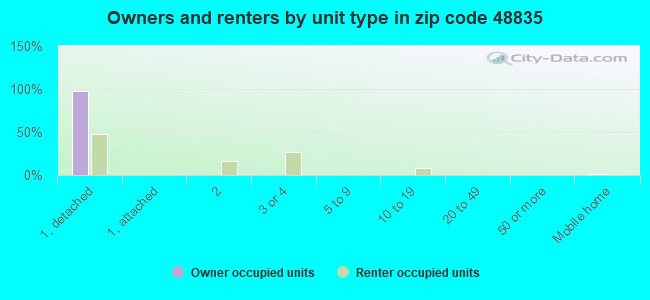
Houses and condos: 1,069 Renter-occupied apartments: 91
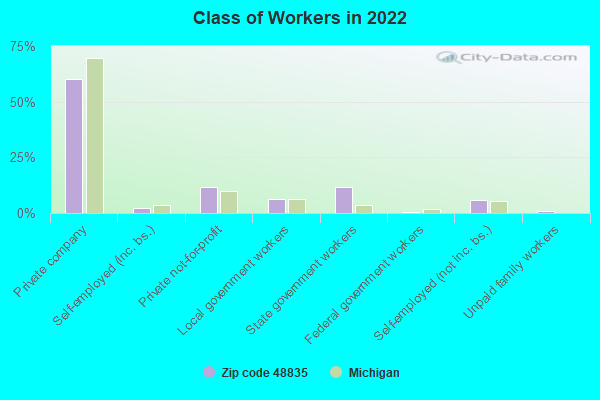
% of renters here:
9%
State:
27%
March 2022 cost of living index in zip code 48835: 80.9 (low, U.S. average is 100)
Land area: 56.0 sq. mi. Water area: 0.4 sq. mi.
Population density: 46 people per square mile
(very low).
OSM Map
General Map
Google Map
MSN Map
OSM Map
General Map
Google Map
MSN Map
OSM Map
General Map
Google Map
MSN Map
OSM Map
General Map
Google Map
MSN Map
Please wait while loading the map...
Real estate property taxes paid for housing units in 2022:
This zip code:
1.0% ($2,081)
Michigan:
1.2% ($2,746)
Median real estate property taxes paid for housing units with mortgages in 2022: $2,383 (1.0%) Median real estate property taxes paid for housing units with no mortgage in 2022: $1,843 (1.0%)
Business Search- 14 Million verified businesses
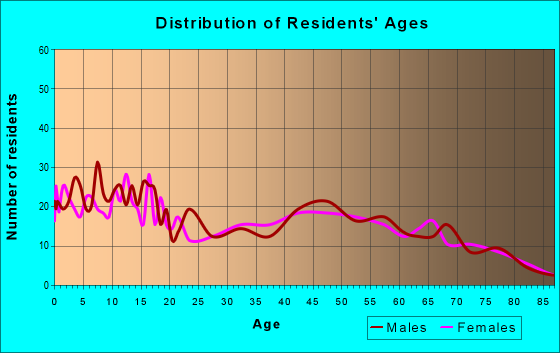
Males: 1,274
(49.5%)
Females: 1,299
(50.5%)
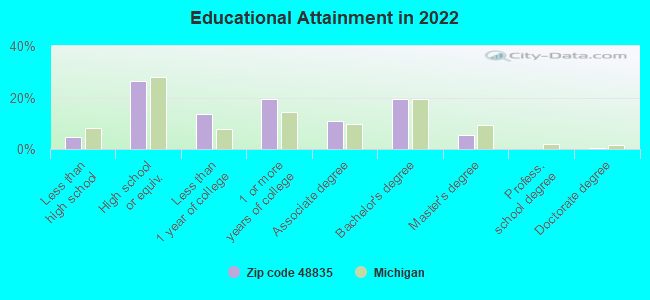
For population 25 years and over in 48835:
High school or higher: 95.0%
Bachelor's degree or higher: 25.1%
Graduate or professional degree: 5.8%
Unemployed: 1.7%
Mean travel time to work (commute): 25.5 minutes
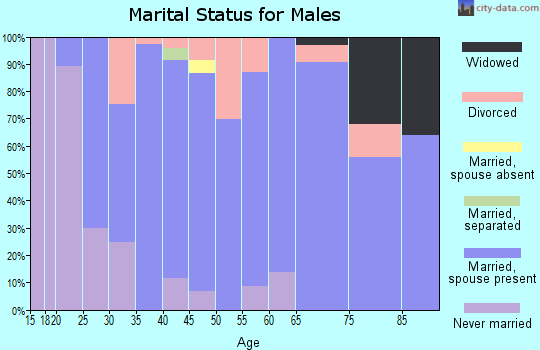
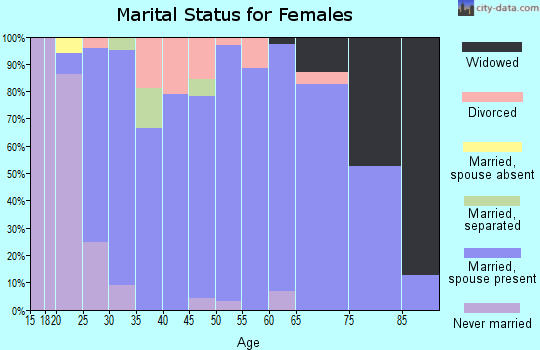
For population 15 years and over in 48835:
Never married: 24.6%
Now married: 63.2%
Separated: 1.1%
Widowed: 6.3%
Divorced: 4.8%
Zip code 48835 compared to state average:
Unemployed percentage below state average.
Black race population percentage significantly below state average.
Hispanic race population percentage significantly below state average.
Foreign-born population percentage significantly below state average.
Renting percentage significantly below state average.
Length of stay since moving in significantly above state average.
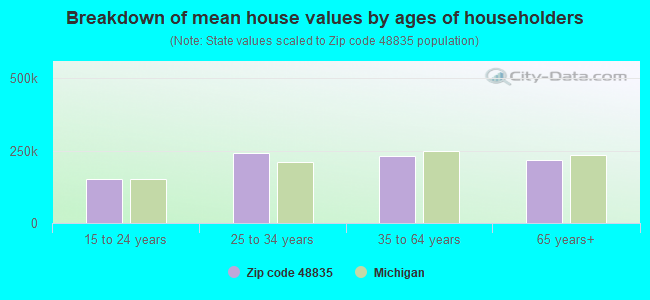
Estimated median house/condo value in 2022: $208,108
48835:
$208,108
Michigan:
$224,400
According to our research of Michigan and other state lists, there were 2 registered sex offenders living in 48835 zip code as of April 27, 2024. The ratio of all residents to sex offenders in zip code 48835 is 1,474 to 1. The ratio of registered sex offenders to all residents in this zip code is much lower than the state average.
Median resident age:
This zip code:
42.3 years
Michigan median age:
40.3 years
Average household size:
This zip code:
2.5 people
Michigan:
2.4 people
Averages for the 2020 tax year for zip code 48835, filed in 2021:
Average Adjusted Gross Income (AGI) in 2020: $69,129 (Individual Income Tax Returns)
Here:
$69,129
State:
$68,945
Salary/wage: $57,549 (reported on 77.2% of returns)
Here:
$57,549
State:
$57,142
(% of AGI for various income ranges: 1030.0% for AGIs below $25k, 3533.0% for AGIs $25k-50k, 5844.3% for AGIs $50k-75k, 8977.0% for AGIs $75k-100k, 15436.0% for AGIs $100k-200k)
Taxable interest for individuals: $1,454 (reported on 51.2% of returns)
This zip code:
$1,454
Michigan:
$1,630
(% of AGI for various income ranges: 28.5% for AGIs below $25k, 76.5% for AGIs $25k-50k, 116.4% for AGIs $50k-75k, 84.0% for AGIs $75k-100k, 128.7% for AGIs $100k-200k)
Ordinary dividends: $3,156 (reported on 21.3% of returns)
Here:
$3,156
State:
$6,972
(% of AGI for various income ranges: 33.5% for AGIs below $25k, 49.0% for AGIs $25k-50k, 107.9% for AGIs $50k-75k, 88.0% for AGIs $75k-100k, 196.0% for AGIs $100k-200k)
Net capital gain/loss in AGI: +$16,390 (reported on 22.8% of returns)
Here:
+$16,390
State:
+$20,064
(% of AGI for various income ranges: 22.5% for AGIs below $25k, 107.0% for AGIs $25k-50k, 142.1% for AGIs $50k-75k, 171.0% for AGIs $75k-100k, 639.3% for AGIs $100k-200k)
Profit/loss from business: +$8,227 (reported on 11.8% of returns)
Here:
+$8,227
State:
+$11,172
(% of AGI for various income ranges: 69.0% for AGIs below $25k, 132.5% for AGIs $25k-50k, 164.3% for AGIs $50k-75k, 101.0% for AGIs $75k-100k, 333.3% for AGIs $100k-200k)
Taxable individual retirement arrangement distribution: $13,417 (reported on 14.2% of returns)
48835:
$13,417
Michigan:
$19,803
(% of AGI for various income ranges: 81.5% for AGIs below $25k, 213.0% for AGIs $25k-50k, 442.1% for AGIs $50k-75k, 347.0% for AGIs $75k-100k, 573.3% for AGIs $100k-200k)
Total itemized deductions: $31,475 (reported on 3.1% of returns)
Here:
$31,475
State:
$34,117
(% of AGI for various income ranges: 839.3% for AGIs $100k-200k)
Charity contributions: $10,567 (reported on 2.4% of returns)
Here:
$10,567
State:
$13,548
(% of AGI for various income ranges: 211.3% for AGIs $100k-200k)
Taxes paid: $6,600 (reported on 3.1% of returns)
48835:
$6,600
State:
$7,972
(% of AGI for various income ranges: 176.0% for AGIs $100k-200k)
Earned income credit: $2,014 (reported on 5.5% of returns)
Here:
$2,014
State:
$2,251
(% of AGI for various income ranges: 30.5% for AGIs below $25k, 40.0% for AGIs $25k-50k)
Percentage of individuals using paid preparers for their 2020 taxes: 95.3%
Here:
95%
State:
93%
(% for various income ranges: 94.1% for AGIs below $25k, 96.6% for AGIs $25k-50k, 95.2% for AGIs $50k-75k, 93.3% for AGIs $75k-100k, 95.8% for AGIs $100k-200k, 100.0% for AGIs over 200k)
Averages for the 2012 tax year for zip code 48835, filed in 2013:
Average Adjusted Gross Income (AGI) in 2012: $53,337 (Individual Income Tax Returns)
Here:
$53,337
State:
$55,609
Salary/wage: $41,544 (reported on 83.6% of returns)
Here:
$41,544
State:
$46,782
(% of AGI for various income ranges: 66.4% for AGIs below $25k, 68.3% for AGIs $25k-50k, 73.6% for AGIs $50k-75k, 70.8% for AGIs $75k-100k, 79.7% for AGIs $100k-200k)
Taxable interest for individuals: $1,605 (reported on 50.0% of returns)
This zip code:
$1,605
Michigan:
$1,491
(% of AGI for various income ranges: 2.8% for AGIs below $25k, 1.7% for AGIs $25k-50k, 0.4% for AGIs $50k-75k, 1.1% for AGIs $75k-100k, 1.2% for AGIs $100k-200k, 3.4% for AGIs over 200k)
Ordinary dividends: $2,604 (reported on 21.9% of returns)
Here:
$2,604
State:
$6,225
(% of AGI for various income ranges: 2.5% for AGIs below $25k, 1.0% for AGIs $25k-50k, 0.5% for AGIs $50k-75k, 1.5% for AGIs $75k-100k, 1.1% for AGIs $100k-200k)
Net capital gain/loss in AGI: +$11,665 (reported on 20.3% of returns)
Here:
+$11,665
State:
+$9,326
(% of AGI for various income ranges: 0.8% for AGIs $25k-50k, 7.3% for AGIs $50k-75k, 1.8% for AGIs $75k-100k, 14.0% for AGIs $100k-200k)
Profit/loss from business: +$5,467 (reported on 9.4% of returns)
Here:
+$5,467
State:
+$11,523
(% of AGI for various income ranges: 5.2% for AGIs below $25k, 1.3% for AGIs $50k-75k, 1.7% for AGIs $75k-100k)
Taxable individual retirement arrangement distribution: $10,869 (reported on 12.5% of returns)
48835:
$10,869
Michigan:
$15,298
(% of AGI for various income ranges: 3.2% for AGIs below $25k, 3.6% for AGIs $25k-50k, 2.3% for AGIs $50k-75k, 2.5% for AGIs $75k-100k, 2.9% for AGIs $100k-200k)
Total itemized deductions: $16,870 (17% of AGI, reported on 25.8% of returns)
Here:
$16,870
State:
$21,628
Here:
17.3% of AGI
State:
18.4% of AGI
(% of AGI for various income ranges: 8.1% for AGIs below $25k, 4.5% for AGIs $25k-50k, 8.0% for AGIs $50k-75k, 7.9% for AGIs $75k-100k, 13.6% for AGIs $100k-200k)
Charity contributions: $3,111 (reported on 21.1% of returns)
Here:
$3,111
State:
$4,225
(% of AGI for various income ranges: 0.9% for AGIs below $25k, 0.5% for AGIs $25k-50k, 0.8% for AGIs $50k-75k, 1.3% for AGIs $75k-100k, 2.5% for AGIs $100k-200k)
Taxes paid: $6,206 (reported on 25.8% of returns)
48835:
$6,206
State:
$8,327
(% of AGI for various income ranges: 1.1% for AGIs below $25k, 1.1% for AGIs $25k-50k, 2.2% for AGIs $50k-75k, 3.1% for AGIs $75k-100k, 6.2% for AGIs $100k-200k)
Earned income credit: $1,991 (reported on 8.6% of returns)
Here:
$1,991
State:
$2,306
(% of AGI for various income ranges: 2.6% for AGIs below $25k, 0.8% for AGIs $25k-50k)
Percentage of individuals using paid preparers for their 2012 taxes: 65.6%
Here:
66%
State:
57%
(% for various income ranges: 57.4% for AGIs below $25k, 72.4% for AGIs $25k-50k, 68.4% for AGIs $50k-75k, 68.8% for AGIs $75k-100k, 80.0% for AGIs $100k-200k)
Averages for the 2004 tax year for zip code 48835, filed in 2005:
Average Adjusted Gross Income (AGI) in 2004: $43,341 (Individual Income Tax Returns)
Here:
$43,341
State:
$48,204
Salary/wage: $39,974 (reported on 85.6% of returns)
Here:
$39,974
State:
$42,791
(% of AGI for various income ranges: 104.7% for AGIs below $10k, 60.9% for AGIs $10k-25k, 74.9% for AGIs $25k-50k, 84.0% for AGIs $50k-75k, 88.9% for AGIs $75k-100k, 67.8% for AGIs over 100k)
Taxable interest for individuals: $1,404 (reported on 67.7% of returns)
This zip code:
$1,404
Michigan:
$1,725
(% of AGI for various income ranges: 18.2% for AGIs below $10k, 6.2% for AGIs $10k-25k, 2.3% for AGIs $25k-50k, 1.5% for AGIs $50k-75k, 0.7% for AGIs $75k-100k, 2.0% for AGIs over 100k)
Taxable dividends: $1,267 (reported on 32.7% of returns)
Here:
$1,267
State:
$3,420
(% of AGI for various income ranges: 4.0% for AGIs below $10k, 2.2% for AGIs $10k-25k, 0.9% for AGIs $25k-50k, 0.7% for AGIs $50k-75k, 0.5% for AGIs $75k-100k, 1.1% for AGIs over 100k)
Net capital gain/loss: +$5,310 (reported on 25.0% of returns)
Here:
+$5,310
State:
+$8,532
(% of AGI for various income ranges: -2.6% for AGIs below $10k, 0.5% for AGIs $10k-25k, 1.4% for AGIs $25k-50k, 1.1% for AGIs $50k-75k, 1.6% for AGIs $75k-100k, 11.2% for AGIs over 100k)
Profit/loss from business: +$6,062 (reported on 10.1% of returns)
Here:
+$6,062
State:
+$9,547
(% of AGI for various income ranges: 4.5% for AGIs below $10k, 2.3% for AGIs $10k-25k, 1.4% for AGIs $25k-50k, 2.2% for AGIs $50k-75k, 0.7% for AGIs $75k-100k, 0.6% for AGIs over 100k)
IRA payment deduction: $3,667 (reported on 2.5% of returns)
48835:
$3,667
Michigan:
$2,875
Self-employed pension: $6,150 (reported on 1.4% of returns)
Here:
$6,150
Michigan:
$13,826
Total itemized deductions: $15,531 (22% of AGI, reported on 30.2% of returns)
Here:
$15,531
State:
$18,509
Here:
21.7% of AGI
State:
20.7% of AGI
(% of AGI for various income ranges: 10.9% for AGIs $10k-25k, 9.5% for AGIs $25k-50k, 9.7% for AGIs $50k-75k, 11.7% for AGIs $75k-100k, 13.6% for AGIs over 100k)
Charity contributions deductions: $2,666 (4% of AGI, reported on 27.1% of returns)
Here:
$2,666
State:
$3,365
Here:
3.6% of AGI
State:
3.6% of AGI
(% of AGI for various income ranges: 1.0% for AGIs $10k-25k, 1.4% for AGIs $25k-50k, 1.2% for AGIs $50k-75k, 1.8% for AGIs $75k-100k, 2.9% for AGIs over 100k)
Total tax: $4,682 (reported on 78.8% of returns)
48835:
$4,682
State:
$7,691
(% of AGI for various income ranges: 2.4% for AGIs below $10k, 4.0% for AGIs $10k-25k, 6.7% for AGIs $25k-50k, 7.6% for AGIs $50k-75k, 9.1% for AGIs $75k-100k, 13.3% for AGIs over 100k)
Earned income credit: $1,638 (reported on 4.8% of returns)
Here:
$1,638
State:
$1,737
Percentage of individuals using paid preparers for their 2004 taxes: 66.1%
Here:
66%
State:
60%
(% for various income ranges: 52.0% for AGIs below $10k, 67.3% for AGIs $10k-25k, 68.0% for AGIs $25k-50k, 68.9% for AGIs $50k-75k, 73.6% for AGIs $75k-100k, 73.9% for AGIs over 100k)
Household received Food Stamps/SNAP in the past 12 months: 31 Household did not receive Food Stamps/SNAP in the past 12 months: 971
Women who had a birth in the past 12 months: 25 (26 now married, 0 unmarried) Women who did not have a birth in the past 12 months: 538 (289 now married, 247 unmarried)
Housing units in zip code 48835 with a mortgage: 484 (47 second mortgage, 42 both second mortgage and home equity loan) Houses without a mortgage: 33
Median monthly owner costs for units with a mortgage: $1,370 Median monthly owner costs for units without a mortgage: $461
Residents with income below the poverty level in 2022:
This zip code:
2.2%
Whole state:
13.4%
Residents with income below 50% of the poverty level in 2022:
This zip code:
1.5%
Whole state:
6.9%
Median number of rooms in houses and condos:
Here:
6.6
State:
6.5
Median number of rooms in apartments:
Here:
4.4
State:
4.3
Notable locations in this zip code not listed on our city pages
Notable locations in zip code 48835: Arens Brothers Dairy Farm (A), Rock N Oak Dairy (B), Havengreen Organic Dairy (C), Hufnagel Dairy (D), Blue Pine Dairy (E), T and H Dairy (F), Wieber Dairy (G), Bancroft Farms (H), Piggott Farms (I), Rocky Island Farm (J), Fitzpatrick Farms (K), Schneider Dairy Farm (L), Schafer Farms (M), Dallas Township Fire and Rescue (N). Display/hide their locations on the map
Size of family households: 395 2-persons, 107 3-persons, 67 4-persons, 91 5-persons, 82 6-persons, 13 7-or-more-persons
Size of nonfamily households: 207 1-person, 36 2-persons, 9 4-persons
534 married couples with children.
57 single-parent households (12 men, 45 women).
97.2% of residents of 48835 zip code speak English at home.
2.4% of residents speak Spanish at home (21% very well, 40% well, 40% not well).
0.4% of residents speak other Indo-European language at home (100% very well).
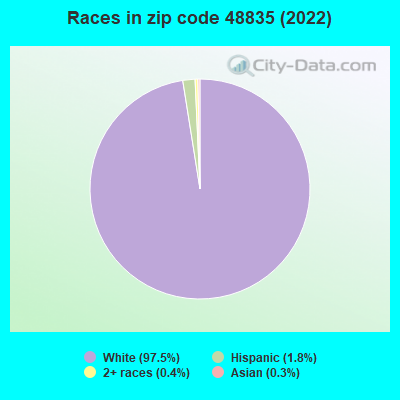
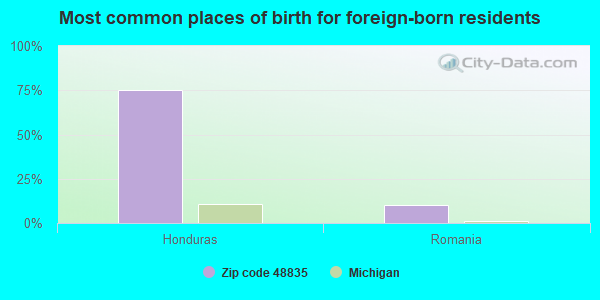
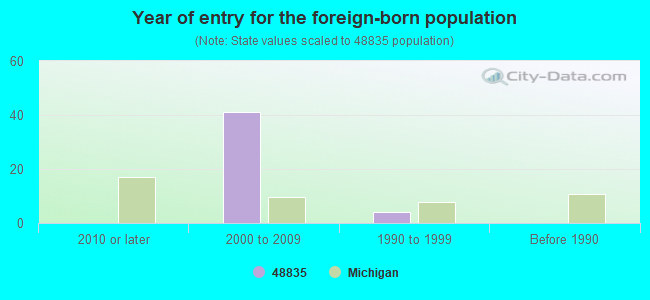
Foreign born population: 46 (1.8%) (13.1% of them are naturalized citizens)
This zip code:
1.8%
Whole state:
6.9%
75%Honduras
10%Romania
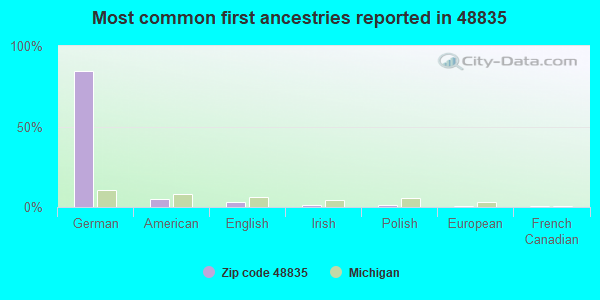
84%German
5%American
3%English
1%Irish
1%Polish
0%European
0%French Canadian
Year of entry for the foreign-born population
02010 or later
412000 to 2009
41990 to 1999
0Before 1990
Facilities with environmental interests located in this zip code:
FOWLER HIGH SCHOOL (700 S. WRIGHT ROAD in FOWLER, MI)
(National Center for Education Statistics) - STATE ID-01284 Organizations: FOWLER PUBLIC SCHOOLS (SCHOOL DISTRICT)
FOWLER WWSL (10723 NORTH DR in FOWLER, MI)
National Pollutant Discharge Elimination System NON-MAJOR (Tracking pollutant discharge elimination systems) - permit National Pollutant Discharge Elimination System NON-MAJOR (Tracking pollutant discharge elimination systems) - permit Business SIC classification: SEWERAGE SYSTEMS Organizations: VILLAGE OF FOWLER (CONTACT/OWNER)
BERLYN ACRES LLC (2356 THELEN RD in FOWLER, MI)
National Pollutant Discharge Elimination System NON-MAJOR (Tracking pollutant discharge elimination systems) - permit Business SIC classification: DAIRY FARMS Alternative names: BERLYN ACRES-CAFO
GTE NORTH INC FOWLER (12018 TALLMAN RD in FOWLER, MI)
(Resource Conservation and Recovery Act (tracking hazardous waste))
FAIRLANE MFG CO INC (616 S MAIN in FOWLER, MI)
Conditionally Exempt Small Quantity Generators, less than 100 kg/month of hazardous waste (Resource Conservation and Recovery Act (tracking hazardous waste))
Housing units lacking complete plumbing facilities: 0.8%
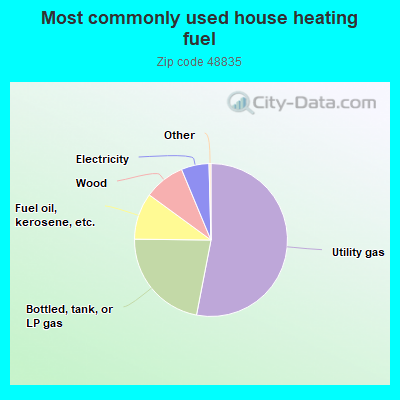
53.2%Utility gas
22.2%Bottled, tank, or LP gas
9.9%Fuel oil, kerosene, etc.
8.7%Wood
5.9%Electricity
Population in 1990: 2,253. Population change in the 1990s: +1,167 (+51.8%).
Place of birth for U.S.-born residents:
This state: 2,354
Northeast: 36
Midwest: 55
South: 28
West: 47
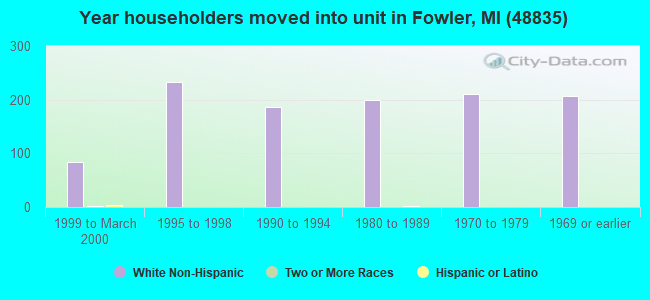
76% of the 48835 zip code residents lived in the same house 5 years ago. Out of people who lived in different houses, 67% lived in this county. Out of people who lived in different counties, 50% lived in Michigan.
98% of the 48835 zip code residents lived in the same house 1 year ago. Out of people who lived in different houses, 44% moved from this county. Out of people who lived in different houses, 44% moved from different county within same state. Out of people who lived in different houses, 26% moved from different state.
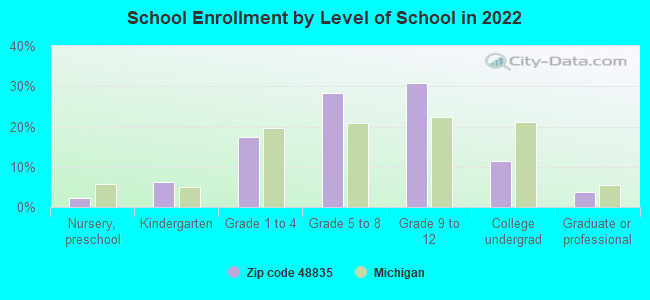
Private vs. public school enrollment:
Students in private schools in grades 1 to 8 (elementary and middle school): 47
Here:
18.7%
Michigan:
12.4%
Students in private schools in grades 9 to 12 (high school): 3
Here:
1.8%
Michigan:
9.8%
Students in private undergraduate colleges: 13
Here:
21.0%
Michigan:
14.9%
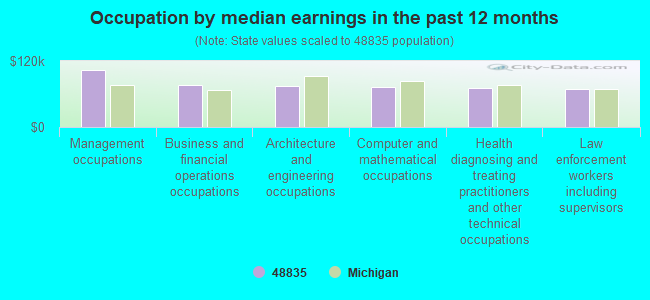
Occupation by median earnings in the past 12 months ($)
103,267Management occupations
75,736Business and financial operations occupations
73,672Architecture and engineering occupations
72,371Computer and mathematical occupations
71,286Health diagnosing and treating practitioners and other technical occupations
69,130Law enforcement workers including supervisors
Top industries in this zip code by the number of employees in 2005:
Other Services (except Public Administration): Religious Organizations (20-49 employees: 1 establishment)
Construction: Poured Concrete Foundation and Structure Contractors (20-49: 1)
Construction: Commercial and Institutional Building Construction (20-49: 1)
Wholesale Trade: Farm and Garden Machinery and Equipment Merchant Wholesalers (10-19: 1, 1-4: 1)
Construction: New Housing Operative Builders (10-19: 1)
Construction: Water and Sewer Line and Related Structures Construction (10-19: 1)
People in group quarters in 2000:
4 people in other noninstitutional group quarters
Fatal accident statistics in 2014:
Fatal accident count: 1
Vehicles involved in fatal accidents: 2
Fatal accidents caused by drunken drivers: 0
Fatalities: 1
Persons involved in fatal accidents: 3
Pedestrians involved in fatal accidents: 0
Fatal accident statistics in 2011:
Fatal accident count: 1
Vehicles involved in fatal accidents: 1
Fatal accidents caused by drunken drivers: 1
Fatalities: 1
Persons involved in fatal accidents: 3
Pedestrians involved in fatal accidents: 0
Home Mortgage Disclosure Act Aggregated Statistics For Year 2009 (Based on 6 partial tracts)
A) FHA, FSA/RHS & VA Home Purchase Loans
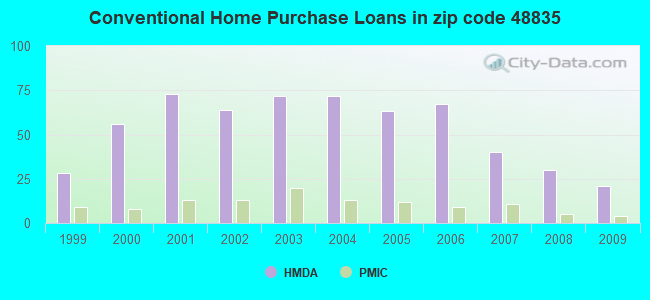
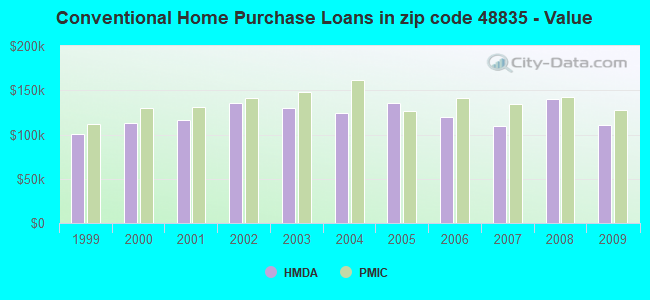
B) Conventional Home Purchase Loans
C) Refinancings
D) Home Improvement Loans
F) Non-occupant Loans on < 5 Family Dwellings (A B C & D)
G) Loans On Manufactured Home Dwelling (A B C & D)
Number
Average Value
Number
Average Value
Number
Average Value
Number
Average Value
Number
Average Value
Number
Average Value
LOANS ORIGINATED
20
$100,230
21
$111,230
145
$124,602
11
$39,094
5
$83,552
1
$157,980
APPLICATIONS APPROVED, NOT ACCEPTED
1
$65,170
2
$55,665
8
$125,992
0
$0
0
$0
0
$0
APPLICATIONS DENIED
2
$76,000
3
$116,190
37
$153,834
7
$38,491
2
$148,685
0
$0
APPLICATIONS WITHDRAWN
1
$148,080
4
$72,125
24
$138,876
1
$17,980
0
$0
0
$0
FILES CLOSED FOR INCOMPLETENESS
0
$0
0
$0
4
$170,695
0
$0
0
$0
0
$0
Aggregated Statistics For Year 2008 (Based on 6 partial tracts)
A) FHA, FSA/RHS & VA Home Purchase Loans
B) Conventional Home Purchase Loans
C) Refinancings
D) Home Improvement Loans
F) Non-occupant Loans on < 5 Family Dwellings (A B C & D)
G) Loans On Manufactured Home Dwelling (A B C & D)
Number
Average Value
Number
Average Value
Number
Average Value
Number
Average Value
Number
Average Value
Number
Average Value
LOANS ORIGINATED
15
$110,019
30
$139,613
88
$123,877
18
$22,179
3
$133,467
6
$56,810
APPLICATIONS APPROVED, NOT ACCEPTED
1
$137,370
2
$71,920
7
$142,616
1
$74,260
0
$0
1
$110,760
APPLICATIONS DENIED
2
$126,415
6
$104,413
39
$141,439
4
$66,728
2
$52,990
4
$90,585
APPLICATIONS WITHDRAWN
3
$162,053
2
$178,980
14
$151,445
2
$88,595
0
$0
0
$0
FILES CLOSED FOR INCOMPLETENESS
0
$0
2
$126,795
2
$143,735
2
$8,860
0
$0
0
$0
Aggregated Statistics For Year 2007 (Based on 6 partial tracts)
A) FHA, FSA/RHS & VA Home Purchase Loans
B) Conventional Home Purchase Loans
C) Refinancings
D) Home Improvement Loans
F) Non-occupant Loans on < 5 Family Dwellings (A B C & D)
G) Loans On Manufactured Home Dwelling (A B C & D)
Number
Average Value
Number
Average Value
Number
Average Value
Number
Average Value
Number
Average Value
Number
Average Value
LOANS ORIGINATED
3
$113,867
40
$109,467
103
$106,453
38
$39,981
3
$78,043
3
$84,987
APPLICATIONS APPROVED, NOT ACCEPTED
0
$0
5
$157,434
14
$106,062
2
$97,410
0
$0
0
$0
APPLICATIONS DENIED
2
$140,395
14
$143,039
50
$130,898
12
$58,746
4
$143,920
3
$60,320
APPLICATIONS WITHDRAWN
0
$0
4
$111,495
20
$162,922
4
$112,178
0
$0
0
$0
FILES CLOSED FOR INCOMPLETENESS
0
$0
0
$0
7
$140,947
0
$0
0
$0
0
$0
Aggregated Statistics For Year 2006 (Based on 6 partial tracts)
A) FHA, FSA/RHS & VA Home Purchase Loans
B) Conventional Home Purchase Loans
C) Refinancings
D) Home Improvement Loans
F) Non-occupant Loans on < 5 Family Dwellings (A B C & D)
G) Loans On Manufactured Home Dwelling (A B C & D)
Number
Average Value
Number
Average Value
Number
Average Value
Number
Average Value
Number
Average Value
Number
Average Value
LOANS ORIGINATED
6
$141,142
67
$119,454
120
$118,284
39
$39,361
7
$83,320
10
$100,626
APPLICATIONS APPROVED, NOT ACCEPTED
0
$0
9
$118,148
30
$111,810
2
$74,615
0
$0
1
$105,130
APPLICATIONS DENIED
0
$0
17
$139,465
71
$136,884
12
$67,444
3
$137,427
3
$88,360
APPLICATIONS WITHDRAWN
1
$141,060
7
$129,351
38
$153,178
0
$0
1
$60,410
1
$88,310
FILES CLOSED FOR INCOMPLETENESS
0
$0
1
$35,960
15
$143,134
2
$37,480
0
$0
0
$0
Aggregated Statistics For Year 2005 (Based on 6 partial tracts)
A) FHA, FSA/RHS & VA Home Purchase Loans
B) Conventional Home Purchase Loans
C) Refinancings
D) Home Improvement Loans
F) Non-occupant Loans on < 5 Family Dwellings (A B C & D)
G) Loans On Manufactured Home Dwelling (A B C & D)
Number
Average Value
Number
Average Value
Number
Average Value
Number
Average Value
Number
Average Value
Number
Average Value
LOANS ORIGINATED
7
$126,071
63
$136,066
162
$121,040
27
$42,476
9
$99,558
7
$69,976
APPLICATIONS APPROVED, NOT ACCEPTED
0
$0
11
$150,645
25
$130,546
6
$41,458
0
$0
1
$78,440
APPLICATIONS DENIED
0
$0
13
$93,432
84
$125,695
13
$32,847
3
$57,067
6
$54,028
APPLICATIONS WITHDRAWN
1
$33,080
9
$129,931
56
$136,474
5
$166,886
0
$0
2
$81,775
FILES CLOSED FOR INCOMPLETENESS
0
$0
2
$153,640
20
$149,776
1
$30,290
1
$51,060
1
$30,290
Aggregated Statistics For Year 2004 (Based on 6 partial tracts)
A) FHA, FSA/RHS & VA Home Purchase Loans
B) Conventional Home Purchase Loans
C) Refinancings
D) Home Improvement Loans
F) Non-occupant Loans on < 5 Family Dwellings (A B C & D)
G) Loans On Manufactured Home Dwelling (A B C & D)
Number
Average Value
Number
Average Value
Number
Average Value
Number
Average Value
Number
Average Value
Number
Average Value
LOANS ORIGINATED
12
$120,174
72
$124,572
204
$117,989
28
$33,761
6
$107,922
7
$98,124
APPLICATIONS APPROVED, NOT ACCEPTED
2
$87,840
6
$120,635
19
$120,233
4
$68,288
0
$0
1
$37,380
APPLICATIONS DENIED
0
$0
10
$109,239
63
$128,167
10
$42,346
2
$85,760
5
$47,410
APPLICATIONS WITHDRAWN
0
$0
5
$122,430
33
$124,985
1
$62,730
1
$74,420
1
$62,150
FILES CLOSED FOR INCOMPLETENESS
0
$0
3
$101,737
25
$135,907
1
$65,290
0
$0
0
$0
Aggregated Statistics For Year 2003 (Based on 6 partial tracts)
A) FHA, FSA/RHS & VA Home Purchase Loans
B) Conventional Home Purchase Loans
C) Refinancings
D) Home Improvement Loans
F) Non-occupant Loans on < 5 Family Dwellings (A B C & D)
Number
Average Value
Number
Average Value
Number
Average Value
Number
Average Value
Number
Average Value
LOANS ORIGINATED
12
$88,450
72
$129,482
441
$115,694
21
$24,508
6
$71,985
APPLICATIONS APPROVED, NOT ACCEPTED
0
$0
8
$85,795
34
$127,082
3
$12,863
1
$133,780
APPLICATIONS DENIED
0
$0
12
$83,714
68
$127,592
3
$49,170
2
$99,595
APPLICATIONS WITHDRAWN
0
$0
8
$162,882
35
$144,607
0
$0
1
$65,710
FILES CLOSED FOR INCOMPLETENESS
0
$0
3
$100,910
12
$122,520
0
$0
0
$0
Aggregated Statistics For Year 2002 (Based on 6 partial tracts)
A) FHA, FSA/RHS & VA Home Purchase Loans
B) Conventional Home Purchase Loans
C) Refinancings
D) Home Improvement Loans
F) Non-occupant Loans on < 5 Family Dwellings (A B C & D)
Number
Average Value
Number
Average Value
Number
Average Value
Number
Average Value
Number
Average Value
LOANS ORIGINATED
11
$119,379
64
$135,929
324
$118,251
24
$22,725
7
$82,596
APPLICATIONS APPROVED, NOT ACCEPTED
0
$0
9
$130,374
25
$118,907
3
$12,733
1
$53,650
APPLICATIONS DENIED
1
$76,240
8
$70,704
51
$102,078
10
$16,103
1
$55,390
APPLICATIONS WITHDRAWN
0
$0
6
$105,957
18
$111,523
0
$0
0
$0
FILES CLOSED FOR INCOMPLETENESS
2
$96,240
1
$91,340
14
$109,369
0
$0
1
$35,960
Aggregated Statistics For Year 2001 (Based on 6 partial tracts)
A) FHA, FSA/RHS & VA Home Purchase Loans
B) Conventional Home Purchase Loans
C) Refinancings
D) Home Improvement Loans
F) Non-occupant Loans on < 5 Family Dwellings (A B C & D)
Number
Average Value
Number
Average Value
Number
Average Value
Number
Average Value
Number
Average Value
LOANS ORIGINATED
4
$99,652
73
$115,839
211
$102,713
43
$19,187
7
$66,641
APPLICATIONS APPROVED, NOT ACCEPTED
1
$70,100
3
$94,677
21
$112,681
10
$23,625
0
$0
APPLICATIONS DENIED
0
$0
7
$103,489
55
$105,307
8
$21,745
0
$0
APPLICATIONS WITHDRAWN
1
$80,550
4
$76,920
25
$113,945
1
$25,170
1
$56,250
FILES CLOSED FOR INCOMPLETENESS
0
$0
0
$0
8
$103,296
1
$14,380
0
$0
Aggregated Statistics For Year 2000 (Based on 6 partial tracts)
A) FHA, FSA/RHS & VA Home Purchase Loans
B) Conventional Home Purchase Loans
C) Refinancings
D) Home Improvement Loans
F) Non-occupant Loans on < 5 Family Dwellings (A B C & D)
Number
Average Value
Number
Average Value
Number
Average Value
Number
Average Value
Number
Average Value
LOANS ORIGINATED
8
$104,528
56
$112,721
69
$81,368
51
$14,480
1
$51,920
APPLICATIONS APPROVED, NOT ACCEPTED
0
$0
3
$106,753
13
$80,726
9
$21,971
1
$120,950
APPLICATIONS DENIED
0
$0
5
$90,000
35
$74,997
12
$19,528
0
$0
APPLICATIONS WITHDRAWN
0
$0
3
$66,427
14
$93,613
1
$103,250
0
$0
FILES CLOSED FOR INCOMPLETENESS
0
$0
2
$155,340
4
$81,120
0
$0
0
$0
Aggregated Statistics For Year 1999 (Based on 3 partial tracts)
A) FHA, FSA/RHS & VA Home Purchase Loans
B) Conventional Home Purchase Loans
C) Refinancings
D) Home Improvement Loans
F) Non-occupant Loans on < 5 Family Dwellings (A B C & D)
2002 - 2018 National Fire Incident Reporting System (NFIRS) incidents
Based on the data from the years 2002 - 2018 the average number of fire incidents per year is 9. The highest number of fires - 25 took place in 2018, and the least - 2 in 2011. The data has an increasing trend.
When looking into fire subcategories, the most reports belonged to: Structure Fires (55.6%), and Outside Fires (29.4%).
Fire incident types reported to NFIRS in Zip Code 48835
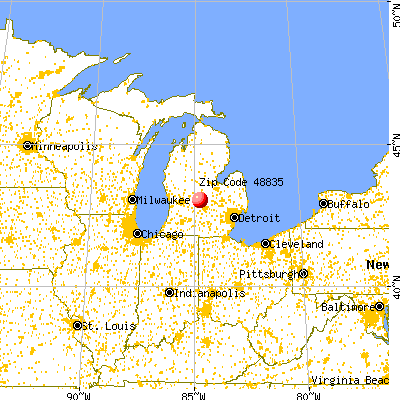


 Nearest zip codes: 48853, 48873, 48894, 48845, 48871, 48860.


 Based on the data from the years 2002 - 2018 the average number of fire incidents per year is 9. The highest number of fires - 25 took place in 2018, and the least - 2 in 2011. The data has an increasing trend.
 When looking into fire subcategories, the most reports belonged to: Structure Fires (55.6%), and Outside Fires (29.4%).