Estimated zip code population in 2022: 8,296 Zip code population in 2010: 7,884 Zip code population in 2000: 7,839
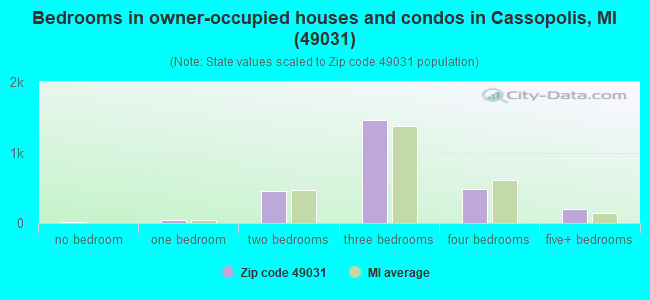
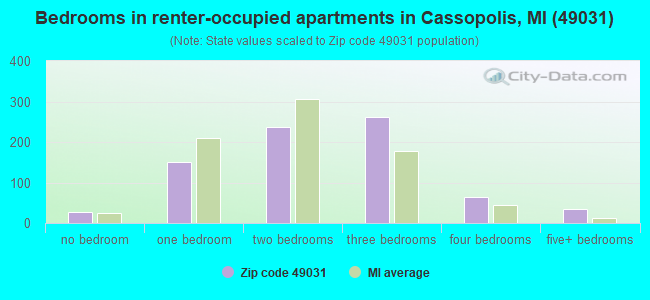
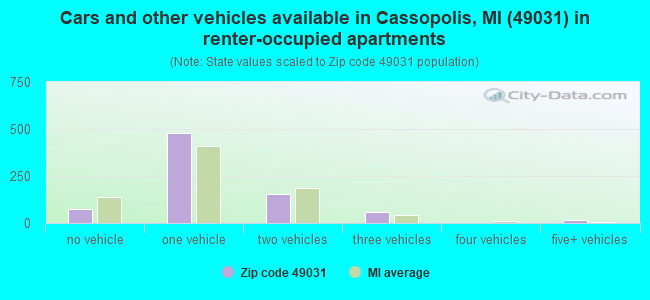
Houses and condos: 4,291 Renter-occupied apartments: 778
% of renters here:
23%
State:
27%
March 2022 cost of living index in zip code 49031: 81.4 (low, U.S. average is 100)
Land area: 114.4 sq. mi. Water area: 4.9 sq. mi.
Population density: 73 people per square mile
(very low).
OSM Map
General Map
Google Map
MSN Map
OSM Map
General Map
Google Map
MSN Map
OSM Map
General Map
Google Map
MSN Map
OSM Map
General Map
Google Map
MSN Map
Please wait while loading the map...
Real estate property taxes paid for housing units in 2022:
This zip code:
0.8% ($1,854)
Michigan:
1.2% ($2,746)
Median real estate property taxes paid for housing units with mortgages in 2022: $2,041 (0.9%) Median real estate property taxes paid for housing units with no mortgage in 2022: $1,466 (0.9%)
Averages for the 2020 tax year for zip code 49031, filed in 2021:
Average Adjusted Gross Income (AGI) in 2020: $71,056 (Individual Income Tax Returns)
Here:
$71,056
State:
$68,945
Salary/wage: $54,276 (reported on 80.1% of returns)
Here:
$54,276
State:
$57,142
(% of AGI for various income ranges: 1004.5% for AGIs below $25k, 3543.9% for AGIs $25k-50k, 5808.7% for AGIs $50k-75k, 9370.0% for AGIs $75k-100k, 15920.4% for AGIs $100k-200k, 85252.5% for AGIs over 200k)
Taxable interest for individuals: $1,988 (reported on 29.6% of returns)
This zip code:
$1,988
Michigan:
$1,630
(% of AGI for various income ranges: 11.3% for AGIs below $25k, 14.0% for AGIs $25k-50k, 78.7% for AGIs $50k-75k, 37.7% for AGIs $75k-100k, 169.2% for AGIs $100k-200k, 2607.5% for AGIs over 200k)
Ordinary dividends: $11,185 (reported on 17.4% of returns)
Here:
$11,185
State:
$6,972
(% of AGI for various income ranges: 24.6% for AGIs below $25k, 44.7% for AGIs $25k-50k, 80.5% for AGIs $50k-75k, 58.6% for AGIs $75k-100k, 308.1% for AGIs $100k-200k, 12637.5% for AGIs over 200k)
Net capital gain/loss in AGI: +$23,726 (reported on 16.2% of returns)
Here:
+$23,726
State:
+$20,064
(% of AGI for various income ranges: 30.0% for AGIs below $25k, 33.2% for AGIs $25k-50k, 52.1% for AGIs $50k-75k, 111.4% for AGIs $75k-100k, 730.4% for AGIs $100k-200k, 26730.0% for AGIs over 200k)
Profit/loss from business: +$14,976 (reported on 14.2% of returns)
Here:
+$14,976
State:
+$11,172
(% of AGI for various income ranges: 98.7% for AGIs below $25k, 121.4% for AGIs $25k-50k, 179.0% for AGIs $50k-75k, 397.7% for AGIs $75k-100k, 767.3% for AGIs $100k-200k, 5592.5% for AGIs over 200k)
Taxable individual retirement arrangement distribution: $22,847 (reported on 12.3% of returns)
49031:
$22,847
Michigan:
$19,803
(% of AGI for various income ranges: 71.5% for AGIs below $25k, 110.8% for AGIs $25k-50k, 206.4% for AGIs $50k-75k, 460.9% for AGIs $75k-100k, 911.5% for AGIs $100k-200k, 10627.5% for AGIs over 200k)
Total itemized deductions: $36,133 (reported on 5.1% of returns)
Here:
$36,133
State:
$34,117
(% of AGI for various income ranges: 113.4% for AGIs below $25k, 242.8% for AGIs $50k-75k, 754.2% for AGIs $100k-200k, 6665.0% for AGIs over 200k)
Charity contributions: $13,593 (reported on 4.0% of returns)
Here:
$13,593
State:
$13,548
(% of AGI for various income ranges: 54.4% for AGIs $50k-75k, 186.2% for AGIs $100k-200k, 3017.5% for AGIs over 200k)
Taxes paid: $8,194 (reported on 5.1% of returns)
49031:
$8,194
State:
$7,972
(% of AGI for various income ranges: 17.1% for AGIs below $25k, 56.9% for AGIs $50k-75k, 228.5% for AGIs $100k-200k, 1297.5% for AGIs over 200k)
Earned income credit: $2,146 (reported on 16.0% of returns)
Here:
$2,146
State:
$2,251
(% of AGI for various income ranges: 83.7% for AGIs below $25k, 71.7% for AGIs $25k-50k)
Percentage of individuals using paid preparers for their 2020 taxes: 94.0%
Here:
94%
State:
93%
(% for various income ranges: 93.1% for AGIs below $25k, 94.6% for AGIs $25k-50k, 94.0% for AGIs $50k-75k, 90.9% for AGIs $75k-100k, 95.5% for AGIs $100k-200k, 100.0% for AGIs over 200k)
Averages for the 2012 tax year for zip code 49031, filed in 2013:
Average Adjusted Gross Income (AGI) in 2012: $53,693 (Individual Income Tax Returns)
Here:
$53,693
State:
$55,609
Salary/wage: $41,218 (reported on 80.7% of returns)
Here:
$41,218
State:
$46,782
(% of AGI for various income ranges: 71.4% for AGIs below $25k, 77.6% for AGIs $25k-50k, 75.9% for AGIs $50k-75k, 71.4% for AGIs $75k-100k, 64.2% for AGIs $100k-200k, 34.3% for AGIs over 200k)
Taxable interest for individuals: $1,887 (reported on 31.8% of returns)
This zip code:
$1,887
Michigan:
$1,491
(% of AGI for various income ranges: 1.4% for AGIs below $25k, 0.9% for AGIs $25k-50k, 1.2% for AGIs $50k-75k, 0.9% for AGIs $75k-100k, 0.8% for AGIs $100k-200k, 1.5% for AGIs over 200k)
Ordinary dividends: $6,381 (reported on 17.2% of returns)
Here:
$6,381
State:
$6,225
(% of AGI for various income ranges: 1.6% for AGIs below $25k, 0.8% for AGIs $25k-50k, 0.9% for AGIs $50k-75k, 1.4% for AGIs $75k-100k, 1.5% for AGIs $100k-200k, 4.3% for AGIs over 200k)
Net capital gain/loss in AGI: +$21,335 (reported on 13.6% of returns)
Here:
+$21,335
State:
+$9,326
(% of AGI for various income ranges: 0.5% for AGIs $25k-50k, 0.5% for AGIs $50k-75k, 1.6% for AGIs $75k-100k, 3.5% for AGIs $100k-200k, 16.6% for AGIs over 200k)
Profit/loss from business: +$8,674 (reported on 14.8% of returns)
Here:
+$8,674
State:
+$11,523
(% of AGI for various income ranges: 6.0% for AGIs below $25k, 2.4% for AGIs $25k-50k, 1.8% for AGIs $50k-75k, 2.3% for AGIs $75k-100k, 4.8% for AGIs $100k-200k)
Taxable individual retirement arrangement distribution: $14,302 (reported on 12.8% of returns)
49031:
$14,302
Michigan:
$15,298
(% of AGI for various income ranges: 3.7% for AGIs below $25k, 3.2% for AGIs $25k-50k, 3.4% for AGIs $50k-75k, 2.8% for AGIs $75k-100k, 9.1% for AGIs $100k-200k)
Total itemized deductions: $24,566 (20% of AGI, reported on 24.3% of returns)
Here:
$24,566
State:
$21,628
Here:
20.2% of AGI
State:
18.4% of AGI
(% of AGI for various income ranges: 8.2% for AGIs below $25k, 7.9% for AGIs $25k-50k, 9.8% for AGIs $50k-75k, 10.2% for AGIs $75k-100k, 12.3% for AGIs $100k-200k, 14.7% for AGIs over 200k)
Charity contributions: $4,874 (reported on 18.1% of returns)
Here:
$4,874
State:
$4,225
(% of AGI for various income ranges: 0.9% for AGIs below $25k, 0.7% for AGIs $25k-50k, 1.1% for AGIs $50k-75k, 1.4% for AGIs $75k-100k, 2.1% for AGIs $100k-200k, 2.7% for AGIs over 200k)
Taxes paid: $8,668 (reported on 23.7% of returns)
49031:
$8,668
State:
$8,327
(% of AGI for various income ranges: 1.9% for AGIs below $25k, 2.0% for AGIs $25k-50k, 2.9% for AGIs $50k-75k, 3.3% for AGIs $75k-100k, 4.9% for AGIs $100k-200k, 5.8% for AGIs over 200k)
Earned income credit: $2,213 (reported on 20.8% of returns)
Here:
$2,213
State:
$2,306
(% of AGI for various income ranges: 6.8% for AGIs below $25k, 1.3% for AGIs $25k-50k)
Percentage of individuals using paid preparers for their 2012 taxes: 59.3%
Here:
59%
State:
57%
(% for various income ranges: 52.8% for AGIs below $25k, 62.2% for AGIs $25k-50k, 60.9% for AGIs $50k-75k, 66.7% for AGIs $75k-100k, 66.7% for AGIs $100k-200k, 87.5% for AGIs over 200k)
Averages for the 2004 tax year for zip code 49031, filed in 2005:
Average Adjusted Gross Income (AGI) in 2004: $46,476 (Individual Income Tax Returns)
Here:
$46,476
State:
$48,204
Salary/wage: $37,018 (reported on 85.1% of returns)
Here:
$37,018
State:
$42,791
(% of AGI for various income ranges: 122.1% for AGIs below $10k, 77.1% for AGIs $10k-25k, 83.1% for AGIs $25k-50k, 82.6% for AGIs $50k-75k, 81.9% for AGIs $75k-100k, 42.3% for AGIs over 100k)
Taxable interest for individuals: $2,011 (reported on 41.5% of returns)
This zip code:
$2,011
Michigan:
$1,725
(% of AGI for various income ranges: 7.0% for AGIs below $10k, 2.5% for AGIs $10k-25k, 1.3% for AGIs $25k-50k, 1.1% for AGIs $50k-75k, 1.0% for AGIs $75k-100k, 2.4% for AGIs over 100k)
Taxable dividends: $3,727 (reported on 19.8% of returns)
Here:
$3,727
State:
$3,420
(% of AGI for various income ranges: 3.6% for AGIs below $10k, 1.0% for AGIs $10k-25k, 0.9% for AGIs $25k-50k, 0.9% for AGIs $50k-75k, 0.7% for AGIs $75k-100k, 2.7% for AGIs over 100k)
Net capital gain/loss: +$16,408 (reported on 17.1% of returns)
Here:
+$16,408
State:
+$8,532
(% of AGI for various income ranges: -1.0% for AGIs below $10k, 1.4% for AGIs $10k-25k, 0.7% for AGIs $25k-50k, 1.6% for AGIs $50k-75k, 2.7% for AGIs $75k-100k, 14.0% for AGIs over 100k)
Profit/loss from business: +$9,157 (reported on 16.3% of returns)
Here:
+$9,157
State:
+$9,547
(% of AGI for various income ranges: 8.6% for AGIs below $10k, 5.0% for AGIs $10k-25k, 3.2% for AGIs $25k-50k, 2.2% for AGIs $50k-75k, 1.0% for AGIs $75k-100k, 3.9% for AGIs over 100k)
IRA payment deduction: $3,096 (reported on 2.7% of returns)
49031:
$3,096
Michigan:
$2,875
(% of AGI for various income ranges: 0.3% for AGIs $10k-25k, 0.3% for AGIs $25k-50k, 0.4% for AGIs $50k-75k, 0.1% for AGIs over 100k)
Self-employed pension: $10,688 (reported on 0.5% of returns)
Here:
$10,688
Michigan:
$13,826
Total itemized deductions: $17,750 (17% of AGI, reported on 26.4% of returns)
Here:
$17,750
State:
$18,509
Here:
17.5% of AGI
State:
20.7% of AGI
(% of AGI for various income ranges: 18.0% for AGIs below $10k, 7.1% for AGIs $10k-25k, 8.9% for AGIs $25k-50k, 11.1% for AGIs $50k-75k, 11.3% for AGIs $75k-100k, 10.2% for AGIs over 100k)
Charity contributions deductions: $3,733 (3% of AGI, reported on 21.0% of returns)
Here:
$3,733
State:
$3,365
Here:
3.3% of AGI
State:
3.6% of AGI
(% of AGI for various income ranges: 1.0% for AGIs below $10k, 1.0% for AGIs $10k-25k, 1.1% for AGIs $25k-50k, 1.4% for AGIs $50k-75k, 1.4% for AGIs $75k-100k, 2.5% for AGIs over 100k)
Total tax: $8,250 (reported on 73.5% of returns)
49031:
$8,250
State:
$7,691
(% of AGI for various income ranges: 3.5% for AGIs below $10k, 4.3% for AGIs $10k-25k, 6.8% for AGIs $25k-50k, 8.6% for AGIs $50k-75k, 10.6% for AGIs $75k-100k, 22.3% for AGIs over 100k)
Earned income credit: $1,652 (reported on 16.3% of returns)
Here:
$1,652
State:
$1,737
Percentage of individuals using paid preparers for their 2004 taxes: 65.9%
Here:
66%
State:
60%
(% for various income ranges: 54.7% for AGIs below $10k, 67.7% for AGIs $10k-25k, 68.7% for AGIs $25k-50k, 68.2% for AGIs $50k-75k, 67.3% for AGIs $75k-100k, 78.8% for AGIs over 100k)
Household received Food Stamps/SNAP in the past 12 months: 384 Household did not receive Food Stamps/SNAP in the past 12 months: 3,030
Women who had a birth in the past 12 months: 151 (102 now married, 49 unmarried) Women who did not have a birth in the past 12 months: 1,341 (559 now married, 780 unmarried)
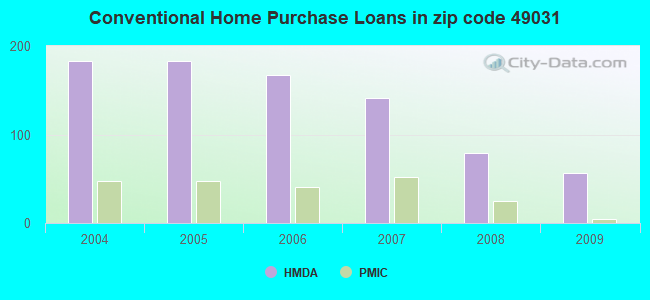
Housing units in zip code 49031 with a mortgage: 1,495 (214 second mortgage, 217 both second mortgage and home equity loan) Houses without a mortgage: 45
Median monthly owner costs for units with a mortgage: $1,391 Median monthly owner costs for units without a mortgage: $507
Residents with income below the poverty level in 2022:
This zip code:
11.3%
Whole state:
13.4%
Residents with income below 50% of the poverty level in 2022:
This zip code:
4.2%
Whole state:
6.9%
Median number of rooms in houses and condos:
Here:
6.7
State:
6.5
Median number of rooms in apartments:
Here:
4.6
State:
4.3
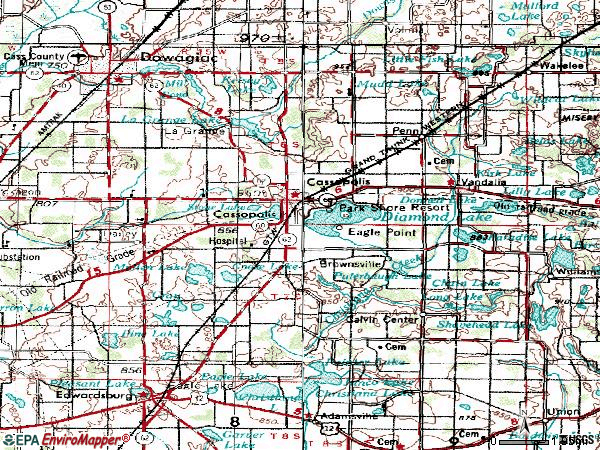
Notable locations in this zip code not listed on our city pages
Notable locations in zip code 49031: Living Waters Camp (A), Camp Baber (B), Camp Manitou (C), Lake Regional Conference Camp (D), Camp Cozy (E), Camp Bryan (F), Redfield Hall (G), Park Shore Golf Course (H), Diamond Lake Golf Club (I), Penn Station (J), Cassopolis Station (K), Cass County Fairgrounds (L), Cool Springs Campground (M), Park Shore Resort (N), Edwardsburg Fire Department North Station (O), LifeCare Ambulance Services Cassopolis (P), Cassopolis Police Department (Q), Cassopolis Volunteer Fire Department (R), Cass County Sheriff Department (S), Cass District Library-Cassopolis (T). Display/hide their locations on the map
Churches in zip code 49031 include: Volinia Baptist Church (A), Bethel Church (B), Diamond Lake Church (C), Pleasant View Church (D), Diamond Cove Missionary Church (E), Kingdom Hall of Jehovah's Witnesses (F), Christ Temple Church (G), Peoples Protestant II Church (H), Saint Paul Lutheran Church (I). Display/hide their locations on the map
Cemeteries: Bethel Cemetery (1), Brady Cemetery (2), Calvin Center Cemetery (3), Chain Lake Cemetery (4), Mount Zion Cemetery (5), Reams-Norton Cemetery (6), Prairie Grove Cemetery (7). Display/hide their locations on the map
Lakes: Puterbaugh Lake (A), Long Lake (B), Little Fish Lake (C), Painter Lake (D), Leninger Lake (E), Lafferty Lake (F), La Grange Lake (G), Kelsey Lake (H). Display/hide their locations on the map
Parks in zip code 49031 include: Harmon Park (1), Stevens Memorial Park (2), Veterans Memorial and Beeson Street Park (3), Bonine Elk Park (4), Underground Railroad Historical Marker (5), Cass County Courthouse Historical Marker (6), Chain Lake Baptist Church and Cemetery Historical Marker (7). Display/hide their locations on the map
In group quarters: 149 (-1 institutionalized population)
Size of family households: 1,159 2-persons, 593 3-persons, 348 4-persons, 143 5-persons, 61 6-persons, 49 7-or-more-persons
Size of nonfamily households: 878 1-person, 147 2-persons, 38 4-persons
1,051 married couples with children.
340 single-parent households (100 men, 240 women).
96.6% of residents of 49031 zip code speak English at home.
0.7% of residents speak Spanish at home (100% very well).
1.2% of residents speak other Indo-European language at home (96% very well, 4% well).
1.6% of residents speak Asian or Pacific Island language at home (38% very well, 45% well, 16% not well).
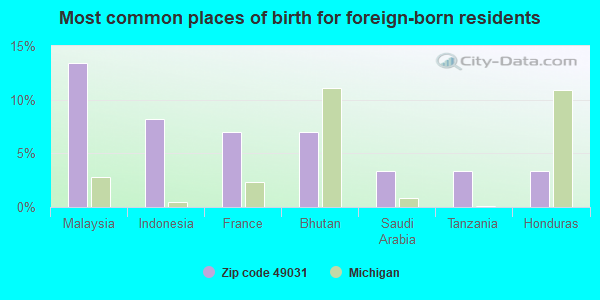
Foreign born population: 328 (4.0%) (61.3% of them are naturalized citizens)
This zip code:
4.0%
Whole state:
6.9%
13%Malaysia
8%Indonesia
7%France
7%Bhutan
3%Saudi Arabia
3%Tanzania
3%Honduras
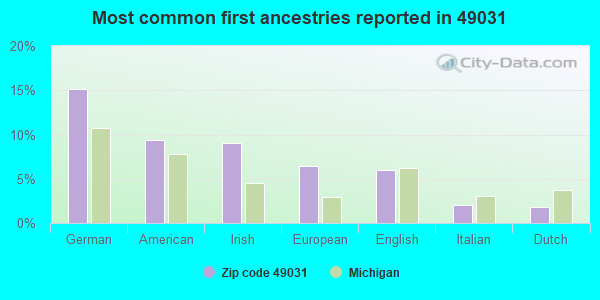
15%German
9%American
9%Irish
6%European
6%English
2%Italian
2%Dutch
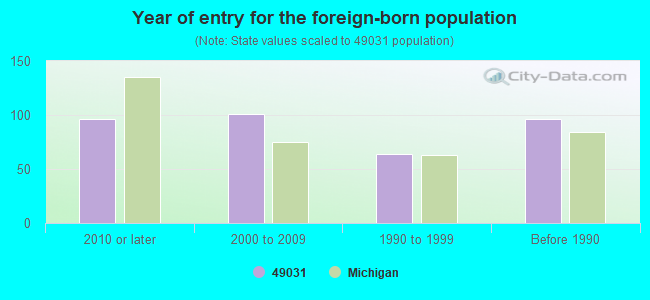
Year of entry for the foreign-born population
962010 or later
1012000 to 2009
641990 to 1999
96Before 1990
Facilities with environmental interests located in this zip code:
FRANK SQUIRES EARLY ELEM. SCHOOL (CENTER STREET in CASSOPOLIS, MI)
(National Center for Education Statistics) - STATE ID-01296 Organizations: CASSOPOLIS PUBLIC SCHOOLS (SCHOOL DISTRICT)
MI DEPT/ENVIRONMENTAL QUALITY (NORTH STREET in CASSOPOLIS, MI)
(Resource Conservation and Recovery Act (tracking hazardous waste)) Alternative names: MI DEPT/DEQ
GEORGE ARMSTRONG (62086 CARLTON in CASSOPOLIS, MI)
(Resource Conservation and Recovery Act (tracking hazardous waste)) Business NAICS classification: RESIDENTIAL REMODELERS.
DIAMOND FORD INC (980 E STATE ST in CASSOPOLIS, MI)
(Resource Conservation and Recovery Act (tracking hazardous waste)) Alternative names: HAYDEN BEARDSLEE FORD INC
ED LOWE FOUNDATION (21805 KELSEY LAKE ST in CASSOPOLIS, MI)
(Resource Conservation and Recovery Act (tracking hazardous waste))
AMERI-KART CORPORATION (19300 GRANGE ST in CASSOPOLIS, MI)
Conditionally Exempt Small Quantity Generators, less than 100 kg/month of hazardous waste (Resource Conservation and Recovery Act (tracking hazardous waste)) Organizations: AMERI-KART CORP MICHIGAN DIVISION (CONTACT/OPERATOR)
Alternative names: BEST PLASTICS INC
BIG ROCK VALLEY (58220 DECATUR RD in CASSOPOLIS, MI)
Conditionally Exempt Small Quantity Generators, less than 100 kg/month of hazardous waste (Resource Conservation and Recovery Act (tracking hazardous waste)) - notification Organizations: LOWE EDWARD FOUNDATION (CONTACT/OWNER)
Housing units lacking complete plumbing facilities: 2.1% Housing units lacking complete kitchen facilities: 2.6%
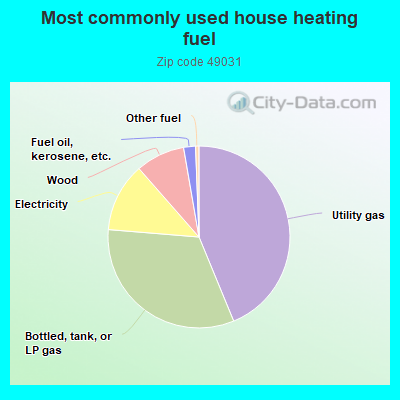
43.6%Utility gas
32.4%Bottled, tank, or LP gas
12.2%Electricity
8.7%Wood
2.1%Fuel oil, kerosene, etc.
0.6%Other fuel
Population in 1990: 6,622. Population change in the 1990s: +1,217 (+18.4%).
Place of birth for U.S.-born residents:
This state: 3,756
Northeast: 345
Midwest: 3,296
South: 448
West: 143
62% of the 49031 zip code residents lived in the same house 5 years ago. Out of people who lived in different houses, 53% lived in this county. Out of people who lived in different counties, 50% lived in Michigan.
93% of the 49031 zip code residents lived in the same house 1 year ago. Out of people who lived in different houses, 38% moved from this county. Out of people who lived in different houses, 33% moved from different county within same state. Out of people who lived in different houses, 31% moved from different state. Out of people who lived in different houses, 2% moved from abroad.
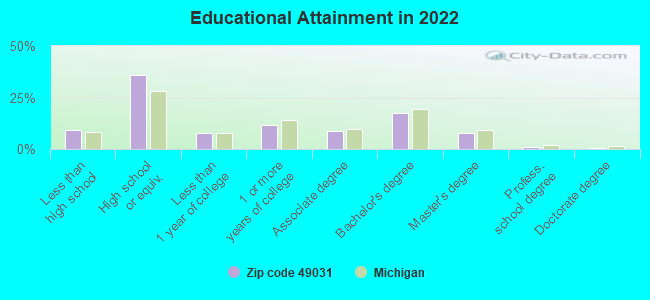
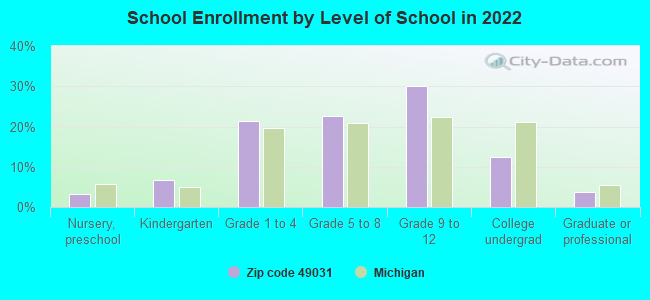
Private vs. public school enrollment:
Students in private schools in grades 1 to 8 (elementary and middle school): 34
Here:
5.3%
Michigan:
12.4%
Students in private schools in grades 9 to 12 (high school): 22
Here:
5.0%
Michigan:
9.8%
Students in private undergraduate colleges: 11
Here:
6.0%
Michigan:
14.9%
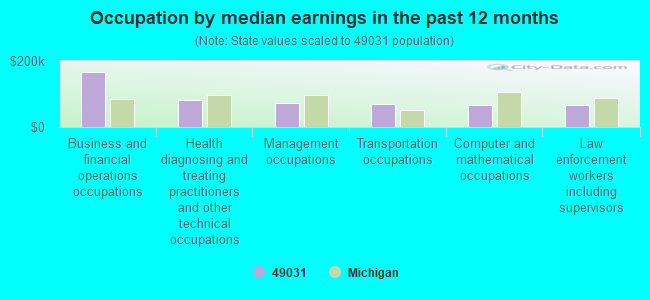
Occupation by median earnings in the past 12 months ($)
168,169Business and financial operations occupations
81,110Health diagnosing and treating practitioners and other technical occupations
73,835Management occupations
70,314Transportation occupations
67,292Computer and mathematical occupations
66,745Law enforcement workers including supervisors
Companies with federal contracts located in this zip code:
MORGOLD INC (18409 QUAKER ST in CASSOPOLIS, MI; small business) : $151,194 in 5 contractsfrom 2001 to 2005
Contracts for Valves, Nonpowered, Relays and Solenoids by Defense Logistics Agency Signed by year:2000: $0; 2001: $85,272; 2002: $0; 2003: $0; 2004: $61,106; 2005: $4,816; 2006: $0.
Biggest contracts:
$85,272 with Defense Logistics Agency for Valves, Nonpowered. Signed on 2001-09-30. Completion date: 2002-01-28.
$31,364 with Defense Logistics Agency for Relays and Solenoids. Signed on 2004-05-21. Completion date: 2004-09-18.
$14,871, same as above.Signed on 2004-12-15. Completion date: 2005-02-22.
$14,871, same as above.Signed on 2004-12-15. Completion date: 2005-02-22.
BERGEN RC HELICOPTERS INC (1101 FOLLETT DR in CASSOPOLIS, MI; small business) : $4,685 in 2 contractsfrom 2003 to 2004
$4,600 with Army for Aircraft, Rotary Wing. Signed on 2003-12-19. Completion date: 2004-01-30.
$85, same as above.Signed on 2004-09-12. Completion date: 2004-01-30.
Top industries in this zip code by the number of employees in 2005:
Health Care and Social Assistance: Outpatient Mental Health and Substance Abuse Centers (100-249 employees: 1 establishment)
Health Care and Social Assistance: Services for the Elderly and Persons with Disabilities (50-99: 1)
Utilities: Electric Power Distribution (50-99: 1)
Health Care and Social Assistance: Residential Mental Retardation Facilities (10-19: 3)
2002 - 2018 National Fire Incident Reporting System (NFIRS) incidents
According to the data from the years 2002 - 2018 the average number of fire incidents per year is 41. The highest number of reported fires - 70 took place in 2006, and the least - 11 in 2014. The data has a rising trend.
When looking into fire subcategories, the most reports belonged to: Structure Fires (53.0%), and Outside Fires (29.1%).
Fire incident types reported to NFIRS in Zip Code 49031
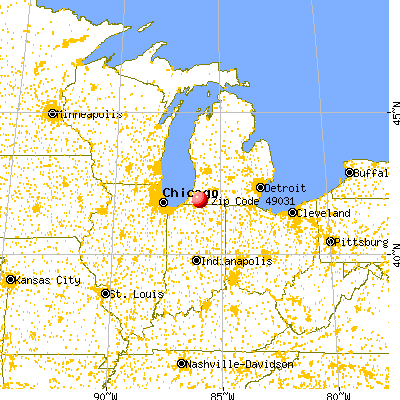


 Nearest zip codes: 49095, 49112, 49061, 49130, 49047, 46514.


 According to the data from the years 2002 - 2018 the average number of fire incidents per year is 41. The highest number of reported fires - 70 took place in 2006, and the least - 11 in 2014. The data has a rising trend.
 When looking into fire subcategories, the most reports belonged to: Structure Fires (53.0%), and Outside Fires (29.1%).