Estimated zip code population in 2022: 12,151 Zip code population in 2010: 11,065 Zip code population in 2000: 11,302
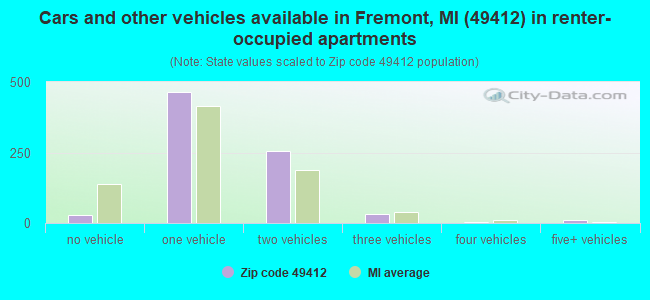
Houses and condos: 5,216 Renter-occupied apartments: 795
% of renters here:
17%
State:
27%
March 2022 cost of living index in zip code 49412: 81.7 (low, U.S. average is 100)
Land area: 106.2 sq. mi. Water area: 4.7 sq. mi.
Population density: 114 people per square mile
(very low).
OSM Map
General Map
Google Map
MSN Map
OSM Map
General Map
Google Map
MSN Map
OSM Map
General Map
Google Map
MSN Map
OSM Map
General Map
Google Map
MSN Map
Please wait while loading the map...
Real estate property taxes paid for housing units in 2022:
This zip code:
1.3% ($2,485)
Michigan:
1.2% ($2,746)
Median real estate property taxes paid for housing units with mortgages in 2022: $2,701 (1.3%) Median real estate property taxes paid for housing units with no mortgage in 2022: $2,180 (1.3%)
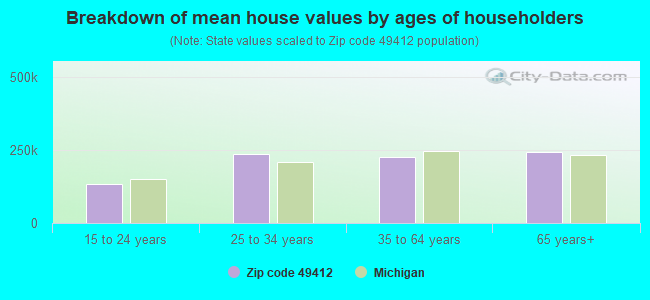
Estimated median house/condo value in 2022: $190,255
49412:
$190,255
Michigan:
$224,400
According to our research of Michigan and other state lists, there were 41 registered sex offenders living in 49412 zip code as of April 27, 2024. The ratio of all residents to sex offenders in zip code 49412 is 274 to 1. The ratio of registered sex offenders to all residents in this zip code is near the state average.
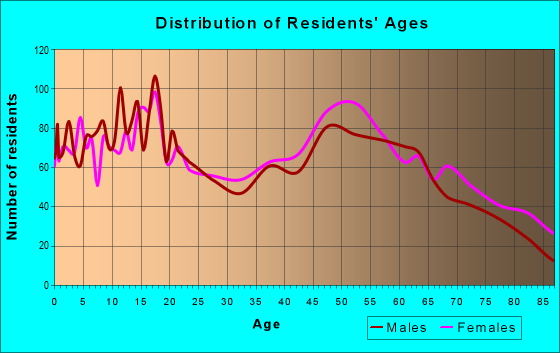
Median resident age:
This zip code:
40.3 years
Michigan median age:
40.3 years
Average household size:
This zip code:
2.6 people
Michigan:
2.4 people
Averages for the 2020 tax year for zip code 49412, filed in 2021:
Average Adjusted Gross Income (AGI) in 2020: $59,003 (Individual Income Tax Returns)
Here:
$59,003
State:
$68,945
Salary/wage: $47,983 (reported on 75.6% of returns)
Here:
$47,983
State:
$57,142
(% of AGI for various income ranges: 1074.9% for AGIs below $25k, 3232.2% for AGIs $25k-50k, 6111.7% for AGIs $50k-75k, 9111.5% for AGIs $75k-100k, 15568.1% for AGIs $100k-200k, 53242.5% for AGIs over 200k)
Taxable interest for individuals: $1,425 (reported on 33.8% of returns)
This zip code:
$1,425
Michigan:
$1,630
(% of AGI for various income ranges: 26.4% for AGIs below $25k, 18.3% for AGIs $25k-50k, 38.1% for AGIs $50k-75k, 74.6% for AGIs $75k-100k, 204.3% for AGIs $100k-200k, 2072.5% for AGIs over 200k)
Ordinary dividends: $7,190 (reported on 17.7% of returns)
Here:
$7,190
State:
$6,972
(% of AGI for various income ranges: 37.9% for AGIs below $25k, 36.7% for AGIs $25k-50k, 88.3% for AGIs $50k-75k, 121.0% for AGIs $75k-100k, 350.0% for AGIs $100k-200k, 9452.5% for AGIs over 200k)
Net capital gain/loss in AGI: +$13,188 (reported on 17.4% of returns)
Here:
+$13,188
State:
+$20,064
(% of AGI for various income ranges: 22.0% for AGIs below $25k, 29.7% for AGIs $25k-50k, 108.3% for AGIs $50k-75k, 209.7% for AGIs $75k-100k, 576.5% for AGIs $100k-200k, 20595.0% for AGIs over 200k)
Profit/loss from business: +$14,536 (reported on 13.3% of returns)
Here:
+$14,536
State:
+$11,172
(% of AGI for various income ranges: 81.3% for AGIs below $25k, 147.6% for AGIs $25k-50k, 411.5% for AGIs $50k-75k, 293.8% for AGIs $75k-100k, 819.5% for AGIs $100k-200k, 3442.5% for AGIs over 200k)
Taxable individual retirement arrangement distribution: $18,749 (reported on 13.7% of returns)
49412:
$18,749
Michigan:
$19,803
(% of AGI for various income ranges: 126.9% for AGIs below $25k, 179.9% for AGIs $25k-50k, 360.8% for AGIs $50k-75k, 599.2% for AGIs $75k-100k, 1633.2% for AGIs $100k-200k)
Total itemized deductions: $39,590 (reported on 3.9% of returns)
Here:
$39,590
State:
$34,117
(% of AGI for various income ranges: 53.3% for AGIs below $25k, 158.3% for AGIs $50k-75k, 247.7% for AGIs $75k-100k, 570.0% for AGIs $100k-200k, 9137.5% for AGIs over 200k)
Charity contributions: $23,594 (reported on 3.1% of returns)
Here:
$23,594
State:
$13,548
(% of AGI for various income ranges: 58.5% for AGIs $50k-75k, 85.9% for AGIs $75k-100k, 233.0% for AGIs $100k-200k, 6172.5% for AGIs over 200k)
Taxes paid: $7,386 (reported on 3.9% of returns)
49412:
$7,386
State:
$7,972
(% of AGI for various income ranges: 9.8% for AGIs below $25k, 36.3% for AGIs $50k-75k, 48.5% for AGIs $75k-100k, 131.4% for AGIs $100k-200k, 1357.5% for AGIs over 200k)
Earned income credit: $2,063 (reported on 13.9% of returns)
Here:
$2,063
State:
$2,251
(% of AGI for various income ranges: 66.7% for AGIs below $25k, 69.9% for AGIs $25k-50k, 4.6% for AGIs $50k-75k)
Percentage of individuals using paid preparers for their 2020 taxes: 95.4%
Here:
95%
State:
93%
(% for various income ranges: 94.2% for AGIs below $25k, 94.6% for AGIs $25k-50k, 96.5% for AGIs $50k-75k, 96.6% for AGIs $75k-100k, 97.0% for AGIs $100k-200k, 100.0% for AGIs over 200k)
Averages for the 2012 tax year for zip code 49412, filed in 2013:
Average Adjusted Gross Income (AGI) in 2012: $48,044 (Individual Income Tax Returns)
Here:
$48,044
State:
$55,609
Salary/wage: $40,715 (reported on 77.7% of returns)
Here:
$40,715
State:
$46,782
(% of AGI for various income ranges: 63.8% for AGIs below $25k, 71.2% for AGIs $25k-50k, 74.0% for AGIs $50k-75k, 71.0% for AGIs $75k-100k, 66.8% for AGIs $100k-200k, 42.5% for AGIs over 200k)
Taxable interest for individuals: $1,419 (reported on 36.8% of returns)
This zip code:
$1,419
Michigan:
$1,491
(% of AGI for various income ranges: 1.8% for AGIs below $25k, 1.0% for AGIs $25k-50k, 0.7% for AGIs $50k-75k, 1.0% for AGIs $75k-100k, 1.0% for AGIs $100k-200k, 1.3% for AGIs over 200k)
Ordinary dividends: $4,860 (reported on 21.3% of returns)
Here:
$4,860
State:
$6,225
(% of AGI for various income ranges: 1.8% for AGIs below $25k, 1.4% for AGIs $25k-50k, 1.7% for AGIs $50k-75k, 1.2% for AGIs $75k-100k, 2.6% for AGIs $100k-200k, 4.4% for AGIs over 200k)
Net capital gain/loss in AGI: +$4,934 (reported on 17.8% of returns)
Here:
+$4,934
State:
+$9,326
(% of AGI for various income ranges: 0.6% for AGIs $25k-50k, 0.8% for AGIs $50k-75k, 1.2% for AGIs $75k-100k, 2.3% for AGIs $100k-200k, 6.0% for AGIs over 200k)
Profit/loss from business: +$10,049 (reported on 14.0% of returns)
Here:
+$10,049
State:
+$11,523
(% of AGI for various income ranges: 7.5% for AGIs below $25k, 3.4% for AGIs $25k-50k, 1.8% for AGIs $50k-75k, 2.6% for AGIs $75k-100k, 1.9% for AGIs $100k-200k, 2.8% for AGIs over 200k)
Taxable individual retirement arrangement distribution: $15,278 (reported on 16.0% of returns)
49412:
$15,278
Michigan:
$15,298
(% of AGI for various income ranges: 6.1% for AGIs below $25k, 5.7% for AGIs $25k-50k, 4.5% for AGIs $50k-75k, 5.0% for AGIs $75k-100k, 8.1% for AGIs $100k-200k)
Self-employment retirement plans: $19,350 (reported on 0.4% of returns)
49412:
$19,350
Michigan:
$20,834
Total itemized deductions: $20,451 (21% of AGI, reported on 26.1% of returns)
Here:
$20,451
State:
$21,628
Here:
21.2% of AGI
State:
18.4% of AGI
(% of AGI for various income ranges: 8.8% for AGIs below $25k, 7.9% for AGIs $25k-50k, 10.1% for AGIs $50k-75k, 12.1% for AGIs $75k-100k, 13.7% for AGIs $100k-200k, 12.6% for AGIs over 200k)
Charity contributions: $5,645 (reported on 21.7% of returns)
Here:
$5,645
State:
$4,225
(% of AGI for various income ranges: 1.2% for AGIs below $25k, 1.4% for AGIs $25k-50k, 2.1% for AGIs $50k-75k, 2.5% for AGIs $75k-100k, 3.9% for AGIs $100k-200k, 3.6% for AGIs over 200k)
Taxes paid: $6,813 (reported on 26.1% of returns)
49412:
$6,813
State:
$8,327
(% of AGI for various income ranges: 1.4% for AGIs below $25k, 2.2% for AGIs $25k-50k, 3.1% for AGIs $50k-75k, 3.9% for AGIs $75k-100k, 5.2% for AGIs $100k-200k, 5.4% for AGIs over 200k)
Earned income credit: $2,126 (reported on 16.2% of returns)
Here:
$2,126
State:
$2,306
(% of AGI for various income ranges: 5.1% for AGIs below $25k, 1.2% for AGIs $25k-50k)
Percentage of individuals using paid preparers for their 2012 taxes: 62.1%
Here:
62%
State:
57%
(% for various income ranges: 55.6% for AGIs below $25k, 62.4% for AGIs $25k-50k, 66.7% for AGIs $50k-75k, 71.4% for AGIs $75k-100k, 70.7% for AGIs $100k-200k, 87.5% for AGIs over 200k)
Averages for the 2004 tax year for zip code 49412, filed in 2005:
Average Adjusted Gross Income (AGI) in 2004: $42,142 (Individual Income Tax Returns)
Here:
$42,142
State:
$48,204
Salary/wage: $37,353 (reported on 80.4% of returns)
Here:
$37,353
State:
$42,791
(% of AGI for various income ranges: 147.1% for AGIs below $10k, 64.8% for AGIs $10k-25k, 76.2% for AGIs $25k-50k, 77.1% for AGIs $50k-75k, 78.1% for AGIs $75k-100k, 57.1% for AGIs over 100k)
Taxable interest for individuals: $1,712 (reported on 55.9% of returns)
This zip code:
$1,712
Michigan:
$1,725
(% of AGI for various income ranges: 13.6% for AGIs below $10k, 4.1% for AGIs $10k-25k, 1.6% for AGIs $25k-50k, 1.3% for AGIs $50k-75k, 1.6% for AGIs $75k-100k, 2.8% for AGIs over 100k)
Taxable dividends: $3,330 (reported on 26.6% of returns)
Here:
$3,330
State:
$3,420
(% of AGI for various income ranges: 9.2% for AGIs below $10k, 2.4% for AGIs $10k-25k, 1.3% for AGIs $25k-50k, 1.2% for AGIs $50k-75k, 1.0% for AGIs $75k-100k, 3.6% for AGIs over 100k)
Net capital gain/loss: +$8,743 (reported on 24.1% of returns)
Here:
+$8,743
State:
+$8,532
(% of AGI for various income ranges: 7.7% for AGIs below $10k, 2.5% for AGIs $10k-25k, 1.5% for AGIs $25k-50k, 1.8% for AGIs $50k-75k, 2.6% for AGIs $75k-100k, 12.2% for AGIs over 100k)
Profit/loss from business: +$8,270 (reported on 15.5% of returns)
Here:
+$8,270
State:
+$9,547
(% of AGI for various income ranges: 4.0% for AGIs below $10k, 5.0% for AGIs $10k-25k, 3.1% for AGIs $25k-50k, 2.6% for AGIs $50k-75k, 2.2% for AGIs $75k-100k, 3.3% for AGIs over 100k)
IRA payment deduction: $2,836 (reported on 3.0% of returns)
49412:
$2,836
Michigan:
$2,875
(% of AGI for various income ranges: 0.3% for AGIs $10k-25k, 0.3% for AGIs $25k-50k, 0.2% for AGIs $50k-75k, 0.2% for AGIs $75k-100k, 0.1% for AGIs over 100k)
Self-employed pension: $9,219 (reported on 0.6% of returns)
Here:
$9,219
Michigan:
$13,826
Total itemized deductions: $17,321 (22% of AGI, reported on 31.7% of returns)
Here:
$17,321
State:
$18,509
Here:
22.1% of AGI
State:
20.7% of AGI
(% of AGI for various income ranges: 21.6% for AGIs below $10k, 9.4% for AGIs $10k-25k, 11.8% for AGIs $25k-50k, 12.8% for AGIs $50k-75k, 13.1% for AGIs $75k-100k, 14.8% for AGIs over 100k)
Charity contributions deductions: $5,096 (6% of AGI, reported on 27.2% of returns)
Here:
$5,096
State:
$3,365
Here:
6.2% of AGI
State:
3.6% of AGI
(% of AGI for various income ranges: 1.1% for AGIs below $10k, 1.7% for AGIs $10k-25k, 2.1% for AGIs $25k-50k, 2.8% for AGIs $50k-75k, 2.9% for AGIs $75k-100k, 5.3% for AGIs over 100k)
Total tax: $5,903 (reported on 72.6% of returns)
49412:
$5,903
State:
$7,691
(% of AGI for various income ranges: 3.9% for AGIs below $10k, 4.0% for AGIs $10k-25k, 6.3% for AGIs $25k-50k, 8.2% for AGIs $50k-75k, 10.0% for AGIs $75k-100k, 16.8% for AGIs over 100k)
Earned income credit: $1,680 (reported on 12.6% of returns)
Here:
$1,680
State:
$1,737
Percentage of individuals using paid preparers for their 2004 taxes: 63.6%
Here:
64%
State:
60%
(% for various income ranges: 57.6% for AGIs below $10k, 62.2% for AGIs $10k-25k, 63.2% for AGIs $25k-50k, 69.5% for AGIs $50k-75k, 64.8% for AGIs $75k-100k, 74.6% for AGIs over 100k)
Household received Food Stamps/SNAP in the past 12 months: 663 Household did not receive Food Stamps/SNAP in the past 12 months: 3,986
Women who had a birth in the past 12 months: 263 (218 now married, 48 unmarried) Women who did not have a birth in the past 12 months: 2,214 (976 now married, 1,235 unmarried)
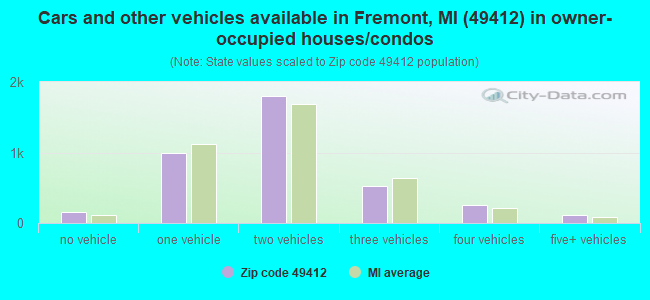
Housing units in zip code 49412 with a mortgage: 2,025 (128 second mortgage, 3 home equity loan, 113 both second mortgage and home equity loan) Houses without a mortgage: 72
Median monthly owner costs for units with a mortgage: $1,274 Median monthly owner costs for units without a mortgage: $494
Residents with income below the poverty level in 2022:
This zip code:
17.3%
Whole state:
13.4%
Residents with income below 50% of the poverty level in 2022:
This zip code:
13.2%
Whole state:
6.9%
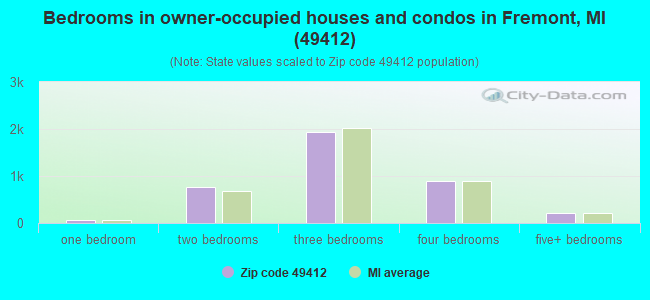
Median number of rooms in houses and condos:
Here:
6.7
State:
6.5
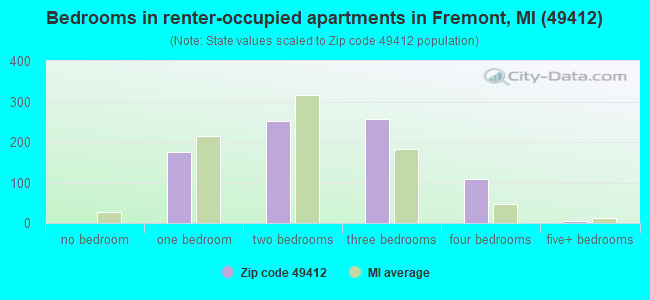
Median number of rooms in apartments:
Here:
4.6
State:
4.3
Notable locations in this zip code not listed on our city pages
Notable locations in zip code 49412: Camp Echo (A), Lake Park Campground (B), Briar Hill Golf Course (C), Summer Breeze Par Three Golf Course (D), Ramshorn on the Lakes Golf Course (E), Newaygo County Fairgrounds (F), Northwood Golf Course (G), Fremont City Hall (H), Sherman Township Hall (I), Fremont Area District Library (J), Life Emergency Medical Services Fremont Station (K), Fremont Fire Department (L). Display/hide their locations on the map
Churches in zip code 49412 include: East Denver Church (A), Fremont Wesleyan Church (B), Fremont United Methodist Church (C), Reeman Christian Reformed Church (D), Saint Michael Church of Brunswick (E), Kingdom Hall of Jehovah's Witnesses (F), Faith Baptist Church (G), Church of the Living Christ (H), First Reformed Church (I). Display/hide their locations on the map
Cemeteries: Bull Cemetery (1), Saint Michaels Cemetery (2), Dayton Center Cemetery (3), Clark Cemetery (4), Mount Calvary Cemetery (5), Maple Grove Cemetery (6), Reeman Cemetery (7). Display/hide their locations on the map
Lakes and swamps: Lorden Lake (A), Peck Lake (B), Bolen Lake (C), Clarks Lake (D), Crystal Lake (E), Evans Lake (F), Kempf Lake (G), Kemperman Lake (H). Display/hide their locations on the map
Streams, rivers, and creeks: Brayden Creek (A), Dragoo Creek (B), Graham Creek (C), Bowman Drain (D), Williams Creek (E), Butler Creek (F), Dry Run (G). Display/hide their locations on the map
Parks in zip code 49412 include: Sheridan Park (1), Fremont Lake Park (2), Arboretum Park (3), WJ Branstrom Park (4), Veterans Memorial Park (5). Display/hide their locations on the map
2,150 married couples with children.
568 single-parent households (119 men, 449 women).
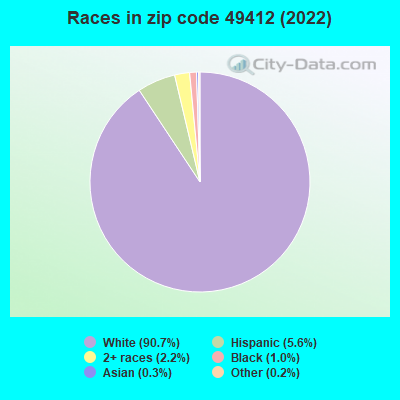
93.7% of residents of 49412 zip code speak English at home.
3.5% of residents speak Spanish at home (73% very well, 24% well, 3% not well).
2.4% of residents speak other Indo-European language at home (76% very well, 20% well, 3% not well).
0.4% of residents speak Asian or Pacific Island language at home (66% very well, 34% well).
0.2% of residents speak other language at home (8% well, 92% not well).
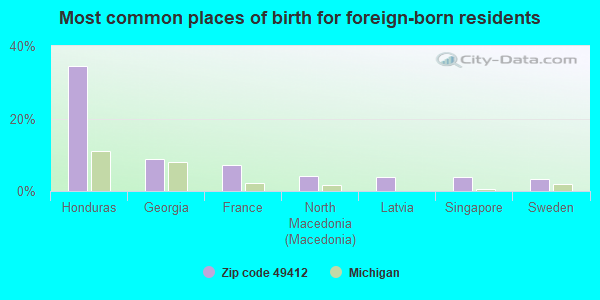
Foreign born population: 236 (1.9%) (46.7% of them are naturalized citizens)
This zip code:
1.9%
Whole state:
6.9%
34%Honduras
9%Georgia
7%France
4%North Macedonia (Macedonia)
4%Latvia
4%Singapore
3%Sweden
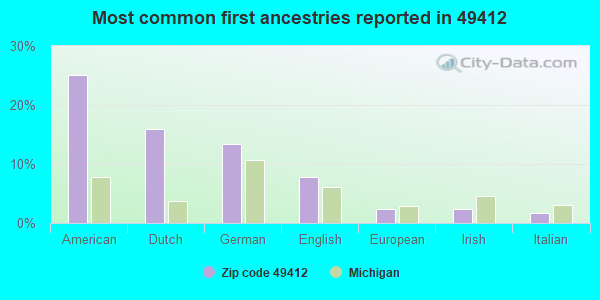
25%American
16%Dutch
13%German
8%English
2%European
2%Irish
2%Italian
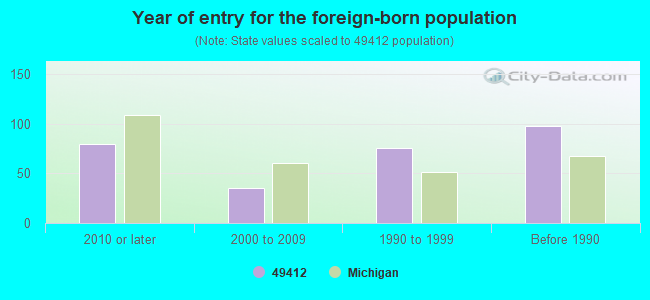
Year of entry for the foreign-born population
802010 or later
352000 to 2009
761990 to 1999
98Before 1990
Major facilities with environmental interests located in this zip code:
GERBER PRODUCTS CO (445 STATE ST in FREMONT, MI)
ENFORCEMENT/COMPLIANCE ACTIVITY (Integrated Compliance Information System) - ICIS-05-1985-0071, FORMAL ENFORCEMENT ACTION, ICIS-HQ-2001-4000, ICIS-HQ-2001-3098, (Integrated Compliance Information System) - ICIS-05-1985-0071, FORMAL ENFORCEMENT ACTION, ICIS-HQ-2001-4000, ICIS-HQ-2001-3098, National Pollutant Discharge Elimination System NON-MAJOR (Tracking pollutant discharge elimination systems) - permit Small Quantity Generators, between 100 kg and 1000 kg of hazardous waste/month (Resource Conservation and Recovery Act (tracking hazardous waste)) - notification Business SIC classification: DRY, CONDENSED, AND EVAPORATED DAIRY PRODUCTS; CANNED SPECIALTIES; CEREAL BREAKFAST FOODS Business NAICS classification: SPECIALTY CANNING. Organizations: GERBER PRODUCTS CO. (CONTACT/OPERATOR)
ENGINEERED POLYMER SOLUTIONS INC. D/B/A VALSPAR COATINGS (411 NORTH DARLING ANENUE in FREMONT, MI)
COMPLIANCE ACTIVITY (Tracking inspections of insecticide, fungicide, and rodenticide, and toxic substances) CRITERIA AND HAZARDOUS AIR POLLUTANT INVENTORY (Inventory of air pollution sources) AIR MAJOR ("Best Available" air pollution technologies tracking) HAZARDOUS WASTE BIENNIAL REPORTER (Resource Conservation and Recovery Act (tracking hazardous waste)) Large Quantity Generators, more that 1000 kg of hazardous waste/month (Resource Conservation and Recovery Act (tracking hazardous waste)) - notification TRI REPORTER (Tracking of toxic chemicals releasing facilities) Business SIC classification: FURNITURE AND FIXTURES; PAINTS, VARNISHES, LACQUERS, ENAMELS, AND ALLIED PRODUCTS; LUBRICATING OILS AND GREASES Business NAICS classification: PETROLEUM LUBRICATING OIL AND GREASE MANUFACTURING.; PAINT AND COATING MANUFACTURING. Organizations: ENGINEERED POLYMER SOLUTIONS, INC. (CONTACT/OPERATOR)
Alternative names: ENGINEERED POLYMER SOLUTIONS INC. (DBA VALSPAR COATINGS), ENGINEERED POLYMER SOLUTIONS INC. (DBA VALSPAR COATINGS), GUARDSMAN PRODUCTS, GUARDSMAN PRODUCTS, INC., LILLY IND. INC. GUARDSMAN PRODS., LILLY INDUSTRIES INC SPECIALTY BUSINESS, VALSPAR CORP FREEMONT FAC, VALSPAR CORP. - FREMONT, valspar corporation GUARDSMAN PRODUCTS, VALSPAR INDUSTRIES USA, INC.
FREMONT CENTER (4575 W. 48TH STREET in FREMONT, MI)
(National Center for Education Statistics) - STATE ID-07222 Organizations: NEWAYGO ISD (SCHOOL DISTRICT)
FREMONT EDUCATION AND ACTIVITY CENTER (4633 W. 48TH STREET in FREMONT, MI)
(National Center for Education Statistics) - STATE ID-08955 Organizations: NEWAYGO ISD (SCHOOL DISTRICT)
FREMONT HIGH SCHOOL (204 E. MAIN STREET in FREMONT, MI)
(National Center for Education Statistics) - STATE ID-01324 Organizations: FREMONT PUBLIC SCHOOL DISTRICT (SCHOOL DISTRICT)
FREMONT MIDDLE SCHOOL (500 W. WOODROW STREET in FREMONT, MI)
(National Center for Education Statistics) - STATE ID-01977 Organizations: FREMONT PUBLIC SCHOOL DISTRICT (SCHOOL DISTRICT)
FREMONT RADIATOR (5594 S WARNER in FREMONT, MI)
(Resource Conservation and Recovery Act (tracking hazardous waste)) Business NAICS classification: OTHER AUTOMOTIVE MECHANICAL AND ELECTRICAL REPAIR AND MAINTENANCE. Organizations: WARREN STROVEN (CONTACT/OPERATOR)
AMERITECH CORP (25 E MAIN ST in FREMONT, MI)
(Resource Conservation and Recovery Act (tracking hazardous waste))
FREMONT CO-OP PRODUCE CO INC (540 W MAIN ST in FREMONT, MI)
COMPLIANCE ACTIVITY (Tracking inspections of insecticide, fungicide, and rodenticide, and toxic substances) Alternative names: FREMON COOPERATIVE PRODUCE CO
ADVANCE AUTO PARTS (1016 WEST MAIN STREET in FREMONT, MI)
Small Quantity Generators, between 100 kg and 1000 kg of hazardous waste/month (Resource Conservation and Recovery Act (tracking hazardous waste)) Organizations: ADVANCE STORES COMPANY, INCORPORATED (CONTACT/OPERATOR)
ASHCROFTS GROCERY (10450 S. WARNER AVENUE in FREMONT, MI)
Small Quantity Generators, between 100 kg and 1000 kg of hazardous waste/month (Resource Conservation and Recovery Act (tracking hazardous waste)) Organizations: RODNEY HATHAWAY (CONTACT/OPERATOR)
FREEDOM CHEVROLET PONTIAC INC (7052 WEST 48TH ST in FREMONT, MI)
Small Quantity Generators, between 100 kg and 1000 kg of hazardous waste/month (Resource Conservation and Recovery Act (tracking hazardous waste)) - notification Business NAICS classification: AUTOMOTIVE BODY, PAINT, AND INTERIOR REPAIR AND MAINTENANCE. Organizations: FREEDOM CHEV PONTIAC INC (CONTACT/OPERATOR)
FREMONT PUBLIC SCHOOLS BUS GARAGE (616 LAKE DR in FREMONT, MI)
Small Quantity Generators, between 100 kg and 1000 kg of hazardous waste/month (Resource Conservation and Recovery Act (tracking hazardous waste))
Housing units lacking complete plumbing facilities: 0.9% Housing units lacking complete kitchen facilities: 2.7%
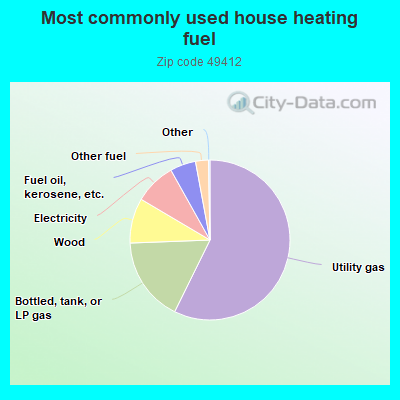
57.3%Utility gas
17.1%Bottled, tank, or LP gas
9.1%Wood
8.4%Electricity
5.2%Fuel oil, kerosene, etc.
2.6%Other fuel
Population in 1990: 7,946. Population change in the 1990s: +3,356 (+42.2%).
Place of birth for U.S.-born residents:
This state: 10,450
Northeast: 189
Midwest: 650
South: 380
West: 168
62% of the 49412 zip code residents lived in the same house 5 years ago. Out of people who lived in different houses, 50% lived in this county. Out of people who lived in different counties, 50% lived in Michigan.
94% of the 49412 zip code residents lived in the same house 1 year ago. Out of people who lived in different houses, 63% moved from this county. Out of people who lived in different houses, 28% moved from different county within same state. Out of people who lived in different houses, 10% moved from different state.
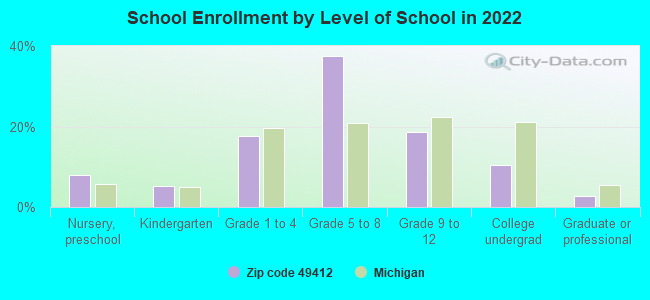
Private vs. public school enrollment:
Students in private schools in grades 1 to 8 (elementary and middle school): 240
Here:
16.2%
Michigan:
12.4%
Students in private schools in grades 9 to 12 (high school): 13
Here:
2.7%
Michigan:
9.8%
Students in private undergraduate colleges: 92
Here:
33.7%
Michigan:
14.9%
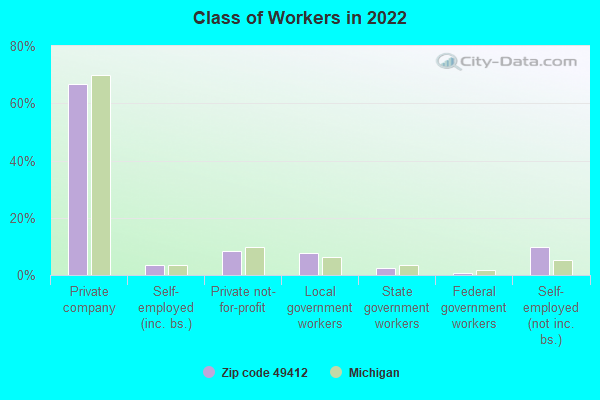
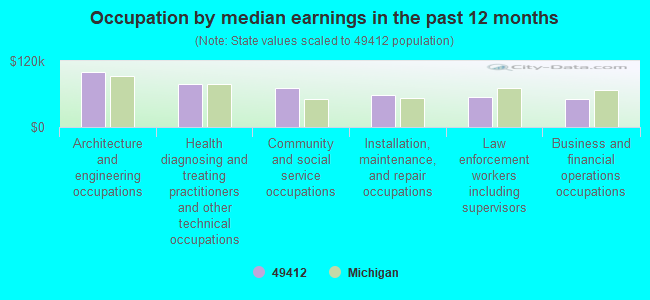
Occupation by median earnings in the past 12 months ($)
100,829Architecture and engineering occupations
78,605Health diagnosing and treating practitioners and other technical occupations
71,138Community and social service occupations
57,774Installation, maintenance, and repair occupations
55,312Law enforcement workers including supervisors
50,597Business and financial operations occupations
Top industries in this zip code by the number of employees in 2005:
Management of Companies and Enterprises: Corporate, Subsidiary, and Regional Managing Offices (500-999 employees: 1 establishment, 100-249 employees: 1 establishment)
Health Care and Social Assistance: General Medical and Surgical Hospitals (500-999: 1)
Health Care and Social Assistance: Nursing Care Facilities (100-249: 2)
2002 - 2018 National Fire Incident Reporting System (NFIRS) incidents
Based on the data from the years 2002 - 2018 the average number of fire incidents per year is 38. The highest number of reported fires - 60 took place in 2003, and the least - 9 in 2010. The data has a growing trend.
When looking into fire subcategories, the most incidents belonged to: Structure Fires (57.4%), and Outside Fires (27.3%).
Fire incident types reported to NFIRS in Zip Code 49412
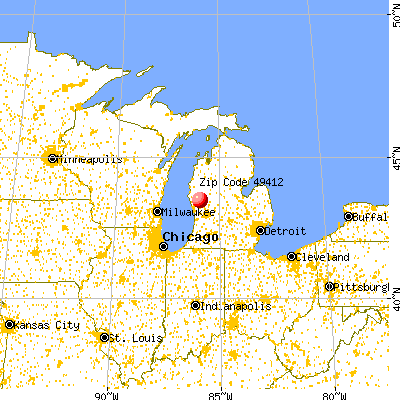


 Nearest zip codes: 49425, 49327, 49421, 49303, 49349, 49457.
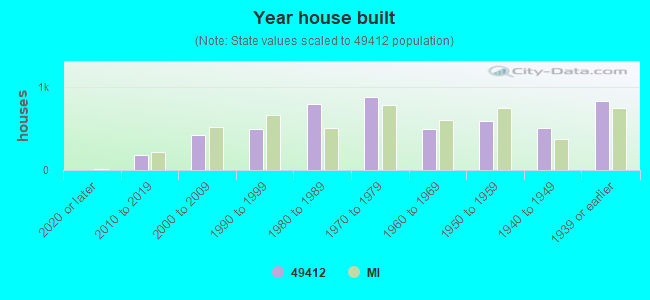


 Based on the data from the years 2002 - 2018 the average number of fire incidents per year is 38. The highest number of reported fires - 60 took place in 2003, and the least - 9 in 2010. The data has a growing trend.
 When looking into fire subcategories, the most incidents belonged to: Structure Fires (57.4%), and Outside Fires (27.3%).