Estimated zip code population in 2022: 6,499 Zip code population in 2010: 6,902 Zip code population in 2000: 6,762
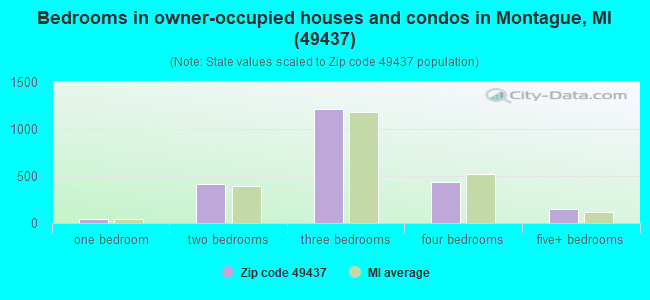
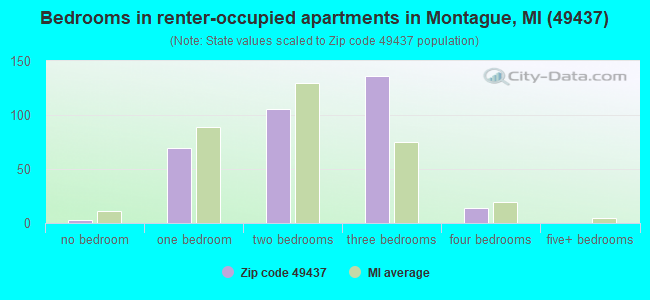
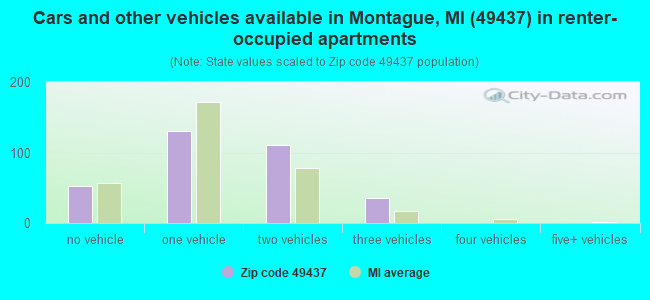
Houses and condos: 3,192 Renter-occupied apartments: 331
% of renters here:
13%
State:
27%
March 2022 cost of living index in zip code 49437: 80.6 (low, U.S. average is 100)
Land area: 64.5 sq. mi. Water area: 15.0 sq. mi.
Population density: 101 people per square mile
(very low).
OSM Map
General Map
Google Map
MSN Map
OSM Map
General Map
Google Map
MSN Map
OSM Map
General Map
Google Map
MSN Map
OSM Map
General Map
Google Map
MSN Map
Please wait while loading the map...
Real estate property taxes paid for housing units in 2022:
This zip code:
1.4% ($2,763)
Michigan:
1.2% ($2,746)
Median real estate property taxes paid for housing units with mortgages in 2022: $2,839 (1.6%) Median real estate property taxes paid for housing units with no mortgage in 2022: $2,685 (1.2%)
Business Search- 14 Million verified businesses
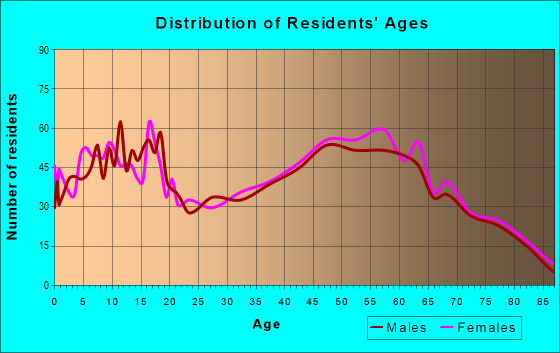
Males: 3,215
(49.5%)
Females: 3,284
(50.5%)
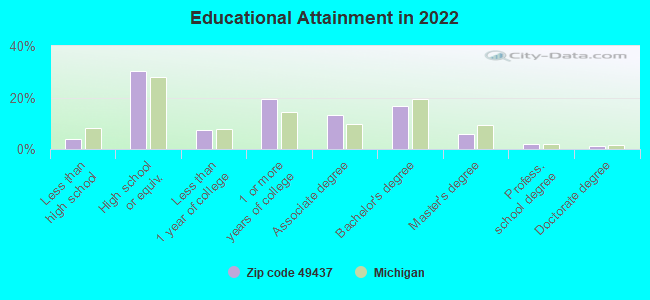
For population 25 years and over in 49437:
High school or higher: 95.4%
Bachelor's degree or higher: 25.5%
Graduate or professional degree: 9.1%
Unemployed: 3.2%
Mean travel time to work (commute): 23.4 minutes
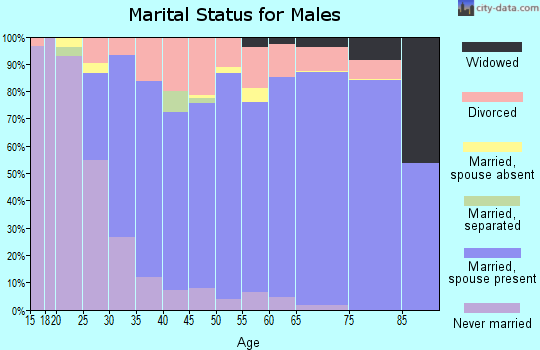
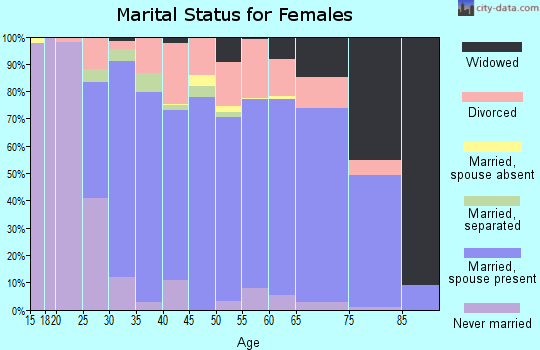
For population 15 years and over in 49437:
Never married: 21.5%
Now married: 62.0%
Separated: 0.8%
Widowed: 5.4%
Divorced: 10.2%
Zip code 49437 compared to state average:
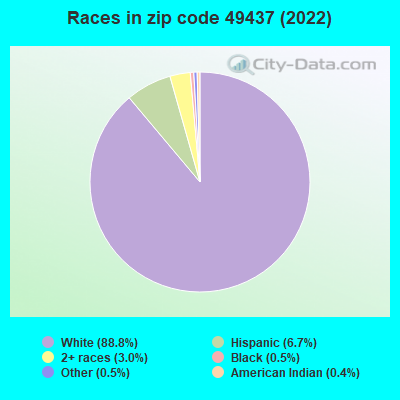
Black race population percentage significantly below state average.
Foreign-born population percentage significantly below state average.
Renting percentage below state average.
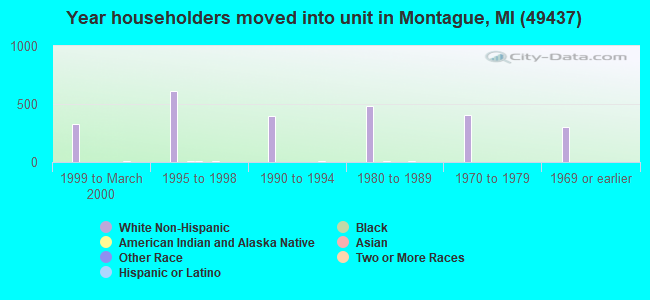
Length of stay since moving in above state average.
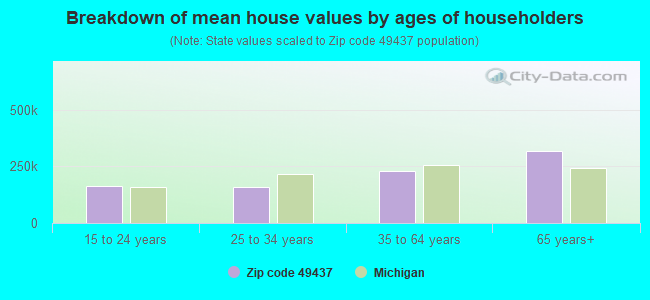
Estimated median house/condo value in 2022: $198,066
49437:
$198,066
Michigan:
$224,400
According to our research of Michigan and other state lists, there were 26 registered sex offenders living in 49437 zip code as of April 27, 2024. The ratio of all residents to sex offenders in zip code 49437 is 271 to 1. The ratio of registered sex offenders to all residents in this zip code is near the state average.
Median resident age:
This zip code:
43.5 years
Michigan median age:
40.3 years
Average household size:
This zip code:
2.5 people
Michigan:
2.4 people
Averages for the 2020 tax year for zip code 49437, filed in 2021:
Average Adjusted Gross Income (AGI) in 2020: $58,953 (Individual Income Tax Returns)
Here:
$58,953
State:
$68,945
Salary/wage: $48,263 (reported on 75.6% of returns)
Here:
$48,263
State:
$57,142
(% of AGI for various income ranges: 944.5% for AGIs below $25k, 3204.5% for AGIs $25k-50k, 5588.2% for AGIs $50k-75k, 8468.8% for AGIs $75k-100k, 14783.3% for AGIs $100k-200k)
Taxable interest for individuals: $1,541 (reported on 32.6% of returns)
This zip code:
$1,541
Michigan:
$1,630
(% of AGI for various income ranges: 20.5% for AGIs below $25k, 27.1% for AGIs $25k-50k, 35.2% for AGIs $50k-75k, 74.4% for AGIs $75k-100k, 222.6% for AGIs $100k-200k)
Ordinary dividends: $7,422 (reported on 17.8% of returns)
Here:
$7,422
State:
$6,972
(% of AGI for various income ranges: 27.0% for AGIs below $25k, 75.7% for AGIs $25k-50k, 72.2% for AGIs $50k-75k, 164.0% for AGIs $75k-100k, 368.9% for AGIs $100k-200k)
Net capital gain/loss in AGI: +$10,813 (reported on 17.0% of returns)
Here:
+$10,813
State:
+$20,064
(% of AGI for various income ranges: 41.3% for AGIs below $25k, 23.1% for AGIs $25k-50k, 80.2% for AGIs $50k-75k, 201.6% for AGIs $75k-100k, 668.5% for AGIs $100k-200k)
Profit/loss from business: +$9,527 (reported on 13.6% of returns)
Here:
+$9,527
State:
+$11,172
(% of AGI for various income ranges: 36.2% for AGIs below $25k, 126.9% for AGIs $25k-50k, 116.8% for AGIs $50k-75k, 334.0% for AGIs $75k-100k, 530.7% for AGIs $100k-200k)
Taxable individual retirement arrangement distribution: $18,755 (reported on 14.4% of returns)
49437:
$18,755
Michigan:
$19,803
(% of AGI for various income ranges: 121.8% for AGIs below $25k, 204.3% for AGIs $25k-50k, 383.2% for AGIs $50k-75k, 455.2% for AGIs $75k-100k, 1682.6% for AGIs $100k-200k)
Total itemized deductions: $34,464 (reported on 4.0% of returns)
Here:
$34,464
State:
$34,117
(% of AGI for various income ranges: 80.5% for AGIs below $25k, 278.2% for AGIs $50k-75k, 621.9% for AGIs $100k-200k)
Charity contributions: $12,682 (reported on 3.1% of returns)
Here:
$12,682
State:
$13,548
(% of AGI for various income ranges: 47.5% for AGIs $50k-75k, 191.1% for AGIs $100k-200k)
Taxes paid: $7,886 (reported on 4.0% of returns)
49437:
$7,886
State:
$7,972
(% of AGI for various income ranges: 17.0% for AGIs below $25k, 72.5% for AGIs $50k-75k, 159.6% for AGIs $100k-200k)
Earned income credit: $1,872 (reported on 13.0% of returns)
Here:
$1,872
State:
$2,251
(% of AGI for various income ranges: 57.7% for AGIs below $25k, 57.8% for AGIs $25k-50k)
Percentage of individuals using paid preparers for their 2020 taxes: 94.6%
Here:
95%
State:
93%
(% for various income ranges: 92.7% for AGIs below $25k, 95.3% for AGIs $25k-50k, 98.1% for AGIs $50k-75k, 94.4% for AGIs $75k-100k, 93.5% for AGIs $100k-200k, 100.0% for AGIs over 200k)
Averages for the 2012 tax year for zip code 49437, filed in 2013:
Average Adjusted Gross Income (AGI) in 2012: $48,140 (Individual Income Tax Returns)
Here:
$48,140
State:
$55,609
Salary/wage: $41,737 (reported on 79.3% of returns)
Here:
$41,737
State:
$46,782
(% of AGI for various income ranges: 66.4% for AGIs below $25k, 76.0% for AGIs $25k-50k, 75.5% for AGIs $50k-75k, 70.1% for AGIs $75k-100k, 74.0% for AGIs $100k-200k, 44.9% for AGIs over 200k)
Taxable interest for individuals: $1,241 (reported on 34.5% of returns)
This zip code:
$1,241
Michigan:
$1,491
(% of AGI for various income ranges: 1.7% for AGIs below $25k, 0.9% for AGIs $25k-50k, 0.5% for AGIs $50k-75k, 1.1% for AGIs $75k-100k, 0.8% for AGIs $100k-200k, 0.8% for AGIs over 200k)
Ordinary dividends: $2,687 (reported on 19.2% of returns)
Here:
$2,687
State:
$6,225
(% of AGI for various income ranges: 2.2% for AGIs below $25k, 0.8% for AGIs $25k-50k, 0.7% for AGIs $50k-75k, 1.1% for AGIs $75k-100k, 1.3% for AGIs $100k-200k, 0.7% for AGIs over 200k)
Net capital gain/loss in AGI: +$3,383 (reported on 14.3% of returns)
Here:
+$3,383
State:
+$9,326
(% of AGI for various income ranges: 0.5% for AGIs $50k-75k, 0.7% for AGIs $75k-100k, 0.9% for AGIs $100k-200k, 4.3% for AGIs over 200k)
Profit/loss from business: +$7,365 (reported on 13.1% of returns)
Here:
+$7,365
State:
+$11,523
(% of AGI for various income ranges: 5.7% for AGIs below $25k, 2.1% for AGIs $25k-50k, 1.7% for AGIs $50k-75k, 1.4% for AGIs $75k-100k, 2.5% for AGIs $100k-200k)
Taxable individual retirement arrangement distribution: $13,645 (reported on 14.9% of returns)
49437:
$13,645
Michigan:
$15,298
(% of AGI for various income ranges: 6.7% for AGIs below $25k, 3.9% for AGIs $25k-50k, 2.9% for AGIs $50k-75k, 7.3% for AGIs $75k-100k, 5.3% for AGIs $100k-200k)
Total itemized deductions: $20,610 (21% of AGI, reported on 25.6% of returns)
Here:
$20,610
State:
$21,628
Here:
21.4% of AGI
State:
18.4% of AGI
(% of AGI for various income ranges: 10.7% for AGIs below $25k, 8.4% for AGIs $25k-50k, 9.7% for AGIs $50k-75k, 10.0% for AGIs $75k-100k, 13.6% for AGIs $100k-200k, 13.2% for AGIs over 200k)
Charity contributions: $3,583 (reported on 21.3% of returns)
Here:
$3,583
State:
$4,225
(% of AGI for various income ranges: 1.0% for AGIs below $25k, 1.3% for AGIs $25k-50k, 1.4% for AGIs $50k-75k, 1.8% for AGIs $75k-100k, 2.6% for AGIs $100k-200k, 1.0% for AGIs over 200k)
Taxes paid: $7,387 (reported on 25.3% of returns)
49437:
$7,387
State:
$8,327
(% of AGI for various income ranges: 2.3% for AGIs below $25k, 2.4% for AGIs $25k-50k, 3.2% for AGIs $50k-75k, 3.8% for AGIs $75k-100k, 5.4% for AGIs $100k-200k, 5.6% for AGIs over 200k)
Earned income credit: $2,183 (reported on 18.0% of returns)
Here:
$2,183
State:
$2,306
(% of AGI for various income ranges: 6.2% for AGIs below $25k, 1.2% for AGIs $25k-50k)
Percentage of individuals using paid preparers for their 2012 taxes: 55.2%
Here:
55%
State:
57%
(% for various income ranges: 49.6% for AGIs below $25k, 58.7% for AGIs $25k-50k, 57.7% for AGIs $50k-75k, 63.3% for AGIs $75k-100k, 57.7% for AGIs $100k-200k, 75.0% for AGIs over 200k)
Averages for the 2004 tax year for zip code 49437, filed in 2005:
Average Adjusted Gross Income (AGI) in 2004: $39,476 (Individual Income Tax Returns)
Here:
$39,476
State:
$48,204
Salary/wage: $35,931 (reported on 82.5% of returns)
Here:
$35,931
State:
$42,791
(% of AGI for various income ranges: 91.0% for AGIs below $10k, 67.1% for AGIs $10k-25k, 80.3% for AGIs $25k-50k, 82.8% for AGIs $50k-75k, 80.3% for AGIs $75k-100k, 56.4% for AGIs over 100k)
Taxable interest for individuals: $1,322 (reported on 47.4% of returns)
This zip code:
$1,322
Michigan:
$1,725
(% of AGI for various income ranges: 3.7% for AGIs below $10k, 3.3% for AGIs $10k-25k, 1.3% for AGIs $25k-50k, 1.0% for AGIs $50k-75k, 0.7% for AGIs $75k-100k, 2.5% for AGIs over 100k)
Taxable dividends: $2,067 (reported on 24.7% of returns)
Here:
$2,067
State:
$3,420
(% of AGI for various income ranges: 3.7% for AGIs below $10k, 2.2% for AGIs $10k-25k, 1.1% for AGIs $25k-50k, 0.9% for AGIs $50k-75k, 1.2% for AGIs $75k-100k, 1.4% for AGIs over 100k)
Net capital gain/loss: +$5,615 (reported on 18.8% of returns)
Here:
+$5,615
State:
+$8,532
(% of AGI for various income ranges: -0.8% for AGIs below $10k, 0.5% for AGIs $10k-25k, 0.7% for AGIs $25k-50k, 0.8% for AGIs $50k-75k, 0.9% for AGIs $75k-100k, 10.5% for AGIs over 100k)
Profit/loss from business: +$5,444 (reported on 15.5% of returns)
Here:
+$5,444
State:
+$9,547
(% of AGI for various income ranges: 5.7% for AGIs below $10k, 4.6% for AGIs $10k-25k, 2.0% for AGIs $25k-50k, 2.0% for AGIs $50k-75k, 2.1% for AGIs $75k-100k, 0.9% for AGIs over 100k)
IRA payment deduction: $3,114 (reported on 2.7% of returns)
49437:
$3,114
Michigan:
$2,875
(% of AGI for various income ranges: 0.2% for AGIs $10k-25k, 0.3% for AGIs $25k-50k, 0.1% for AGIs $50k-75k, 0.2% for AGIs $75k-100k, 0.2% for AGIs over 100k)
Self-employed pension: $4,385 (reported on 0.4% of returns)
Here:
$4,385
Michigan:
$13,826
Total itemized deductions: $15,035 (22% of AGI, reported on 30.1% of returns)
Here:
$15,035
State:
$18,509
Here:
21.8% of AGI
State:
20.7% of AGI
(% of AGI for various income ranges: 14.2% for AGIs below $10k, 8.9% for AGIs $10k-25k, 9.7% for AGIs $25k-50k, 11.0% for AGIs $50k-75k, 12.8% for AGIs $75k-100k, 13.8% for AGIs over 100k)
Charity contributions deductions: $2,708 (4% of AGI, reported on 26.0% of returns)
Here:
$2,708
State:
$3,365
Here:
3.7% of AGI
State:
3.6% of AGI
(% of AGI for various income ranges: 1.2% for AGIs below $10k, 1.0% for AGIs $10k-25k, 1.3% for AGIs $25k-50k, 1.8% for AGIs $50k-75k, 1.7% for AGIs $75k-100k, 2.9% for AGIs over 100k)
Total tax: $5,100 (reported on 73.5% of returns)
49437:
$5,100
State:
$7,691
(% of AGI for various income ranges: 3.1% for AGIs below $10k, 4.0% for AGIs $10k-25k, 6.4% for AGIs $25k-50k, 8.3% for AGIs $50k-75k, 10.4% for AGIs $75k-100k, 17.1% for AGIs over 100k)
Earned income credit: $1,701 (reported on 12.7% of returns)
Here:
$1,701
State:
$1,737
Percentage of individuals using paid preparers for their 2004 taxes: 56.0%
Here:
56%
State:
60%
(% for various income ranges: 46.9% for AGIs below $10k, 56.8% for AGIs $10k-25k, 58.1% for AGIs $25k-50k, 59.1% for AGIs $50k-75k, 57.4% for AGIs $75k-100k, 70.2% for AGIs over 100k)
Likely homosexual households (counted as self-reported same-sex unmarried-partner households)
Lesbian couples: 0.4% of all households
Gay men: 0.0% of all households
Household received Food Stamps/SNAP in the past 12 months: 235 Household did not receive Food Stamps/SNAP in the past 12 months: 2,339
Women who had a birth in the past 12 months: 30 (30 now married, 0 unmarried) Women who did not have a birth in the past 12 months: 1,210 (655 now married, 550 unmarried)
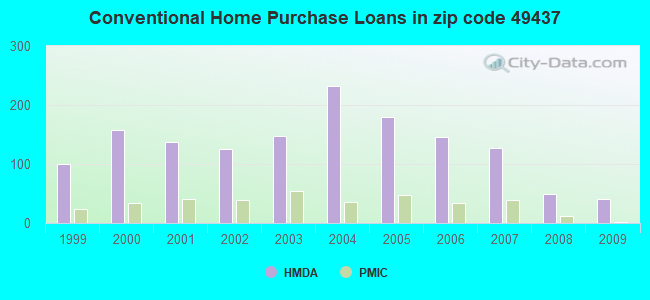
Housing units in zip code 49437 with a mortgage: 1,223 (59 second mortgage, 62 both second mortgage and home equity loan) Houses without a mortgage: 40
Median monthly owner costs for units with a mortgage: $1,222 Median monthly owner costs for units without a mortgage: $538
Residents with income below the poverty level in 2022:
This zip code:
6.8%
Whole state:
13.4%
Residents with income below 50% of the poverty level in 2022:
This zip code:
3.3%
Whole state:
6.9%
Median number of rooms in houses and condos:
Here:
6.2
State:
6.5
Median number of rooms in apartments:
Here:
4.2
State:
4.3
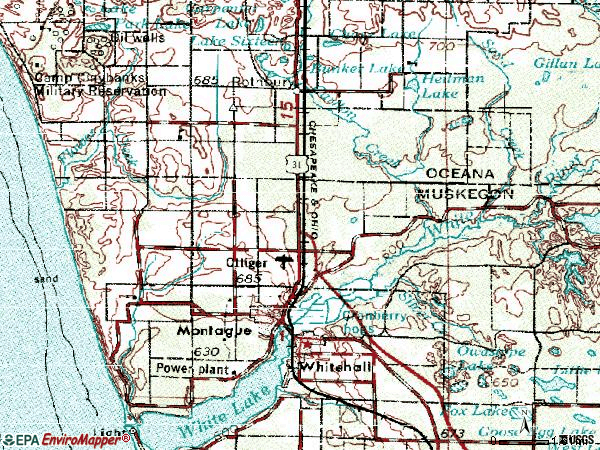
Notable locations in this zip code not listed on our city pages
Notable locations in zip code 49437: Camp Pendalouah (A), Camp Emery (B), Montague Marina (C), Pines Campground (D), White River Campground (E), Trailway Campground (F), Rothbury Rest Area (G), North Pier Light (H), Grover Fisheries (I), Old Channel Trail Golf Course (J), Montague Township Hall (K), Montague Fire Department (L), Montague Police Department (M), Montague City Public Library (N), Montague City Hall (O), Montague City Museum (P). Display/hide their locations on the map
Churches in zip code 49437 include: Bible Church (A), Whitelake Church (B), Saint Johns Church (C), Peace Church (D), Claybanke Church (E), Saint James Catholic Church (F), Ferry Memorial Reformed Church (G), Montague United Methodist Church (H), Saint James Lutheran Church (I). Display/hide their locations on the map
Cemeteries: Saint John's Catholic Cemetery (1), Oak Grove Cemetery (2), Mouth Cemetery (3), Mount Calvary Cemetery (4), Flower Creek Cemetery (5), Sammis Cemetery (6), Peace Cemetery (7). Display/hide their locations on the map
Rivers and creeks: Whisky Creek (A), White River (B), Carlton Creek (C), Cleveland Creek (D), Sand Creek (E), Flower Creek (F). Display/hide their locations on the map
Parks in zip code 49437 include: Medbury Park (1), Claybanks Township Park (2), Mouth Cemetery Historical Marker (3), Ellenwood Park (4), Cullen Field (5), Maple Grove Park (6), Montague Township Park (7), Meinert Park (8). Display/hide their locations on the map
1,161 married couples with children.
241 single-parent households (111 men, 130 women).
96.8% of residents of 49437 zip code speak English at home.
2.9% of residents speak Spanish at home (78% very well, 2% well, 20% not at all).
0.1% of residents speak other Indo-European language at home (100% not well).
0.4% of residents speak other language at home (55% very well, 45% not well).
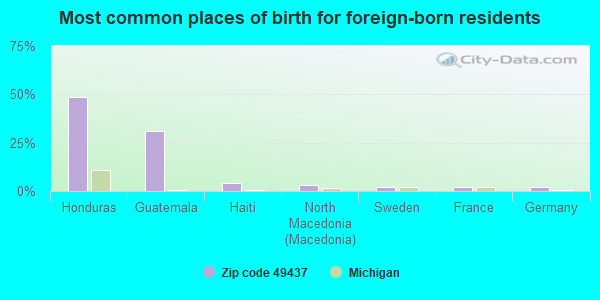
Foreign born population: 101 (1.6%) (27.2% of them are naturalized citizens)
This zip code:
1.6%
Whole state:
6.9%
49%Honduras
31%Guatemala
4%Haiti
3%North Macedonia (Macedonia)
2%Sweden
2%France
2%Germany
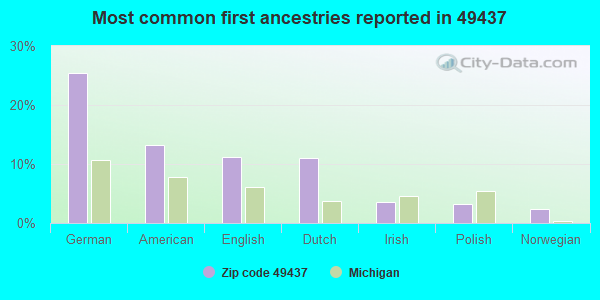
25%German
13%American
11%English
11%Dutch
3%Irish
3%Polish
2%Norwegian
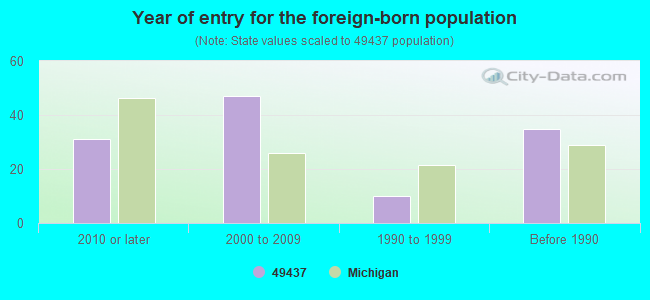
Year of entry for the foreign-born population
312010 or later
472000 to 2009
101990 to 1999
35Before 1990
Facilities with environmental interests located in this zip code:
E.I. DU PONT DE NEMOURS & CO., INC. (6270 WILKES ROAD in MONTAGUE, MI)
AIR MINOR (AIRS/AFS) SUPERFUND (Superfund database) (Integrated Compliance Information System) - ICIS-05-1991-0190, FORMAL ENFORCEMENT ACTION COMPLIANCE ACTIVITY (Tracking inspections of insecticide, fungicide, and rodenticide, and toxic substances) National Pollutant Discharge Elimination System NON-MAJOR (Tracking pollutant discharge elimination systems) - permit HAZARDOUS WASTE BIENNIAL REPORTER (Resource Conservation and Recovery Act (tracking hazardous waste)) Small Quantity Generators, between 100 kg and 1000 kg of hazardous waste/month (Resource Conservation and Recovery Act (tracking hazardous waste)) TSD (Resource Conservation and Recovery Act (tracking hazardous waste)) TRI REPORTER (Tracking of toxic chemicals releasing facilities) Business SIC classification: SYNTHETIC RUBBER (VULCANIZABLE ELASTOMERS); INDUSTRIAL ORGANIC CHEMICALS Business NAICS classification: ALL OTHER BASIC ORGANIC CHEMICAL MANUFACTURING. Organizations: E I DU PONT DE NEMOURS AND CO (CONTACT/OPERATOR)
, E.I. DUPONT DE NEMOURS CO. (CONTACT/OWNER)
Alternative names: DU PONT E I DE NEMOURS CO, DU PONT E I DE NEMOURS CO MONTAGUE WKS, DU PONT E I DE NEMOURS CO MONTAGUE WORKS, DU PONT, MONTAGUE WORKS, DUPONT EI DE NEMOURS/MONTAGUE PLANT, DUPONT-MONTAGUE, DUPONT MONTAGUE WORK, E.I. DU PONT DE NEMOURS & CO., INC. (MONTAGUE PLANT), E.I. DU PONT (MONTAGUE PLANT), EI DU PONT DE NEMOURS MONTAGUE PLANT, EI DUPONT DE NEMOURS
DOUBLE L ENTERPRISES INC (5215 INDUSTRIAL PARK in MONTAGUE, MI)
(Resource Conservation and Recovery Act (tracking hazardous waste))
MI DEPT/MILITARY & VETERANS AFFAIRS (8061 COOK ST in MONTAGUE, MI)
Conditionally Exempt Small Quantity Generators, less than 100 kg/month of hazardous waste (Resource Conservation and Recovery Act (tracking hazardous waste)) Alternative names: MONTAGUE ARMORY
Housing units lacking complete plumbing facilities: 0.8% Housing units lacking complete kitchen facilities: 0.3%
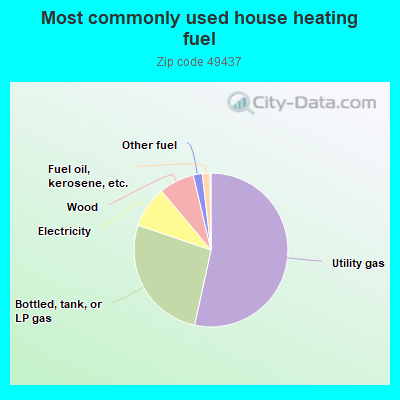
53.5%Utility gas
26.8%Bottled, tank, or LP gas
8.7%Electricity
7.4%Wood
1.9%Other fuel
1.6%Fuel oil, kerosene, etc.
Population in 1990: 4,953. Population change in the 1990s: +1,809 (+36.5%).
Place of birth for U.S.-born residents:
This state: 5,540
Northeast: 93
Midwest: 470
South: 129
West: 135
66% of the 49437 zip code residents lived in the same house 5 years ago. Out of people who lived in different houses, 61% lived in this county. Out of people who lived in different counties, 50% lived in Michigan.
94% of the 49437 zip code residents lived in the same house 1 year ago. Out of people who lived in different houses, 51% moved from this county. Out of people who lived in different houses, 31% moved from different county within same state. Out of people who lived in different houses, 17% moved from different state. Out of people who lived in different houses, 3% moved from abroad.
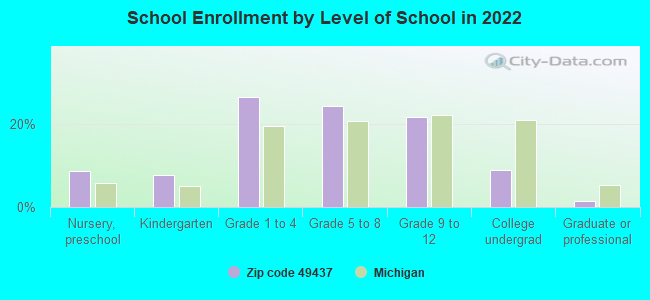
Private vs. public school enrollment:
Students in private schools in grades 1 to 8 (elementary and middle school): 57
Here:
7.7%
Michigan:
12.4%
Students in private schools in grades 9 to 12 (high school): 8
Here:
2.7%
Michigan:
9.8%
Students in private undergraduate colleges: 15
Here:
11.7%
Michigan:
14.9%
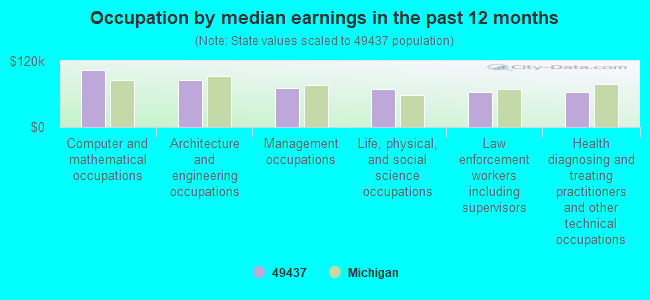
Occupation by median earnings in the past 12 months ($)
103,796Computer and mathematical occupations
85,705Architecture and engineering occupations
70,778Management occupations
69,343Life, physical, and social science occupations
64,411Law enforcement workers including supervisors
63,434Health diagnosing and treating practitioners and other technical occupations
Companies with federal contracts located in this zip code:
SHELLCAST INC (5230 INDUSTRIAL PARK RD in MONTAGUE, MI; small business) : $120,442 in 5 contractsfrom 2004 to 2005
Contracts for Hardware, Commercial by Defense Logistics Agency Signed by year:2000: $0; 2001: $0; 2002: $0; 2003: $0; 2004: $32,800; 2005: $87,642; 2006: $0.
Biggest contracts:
$35,260 with Defense Logistics Agency for Hardware, Commercial. Signed on 2005-01-15. Completion date: 2005-03-30.
$32,800, same as above.Signed on 2004-03-09. Completion date: 2004-06-07.
$28,858, same as above.Signed on 2005-12-15. Completion date: 2006-02-13.
$12,429, same as above.Signed on 2005-11-17. Completion date: 2006-01-12.
Top industries in this zip code by the number of employees in 2005:
2002 - 2018 National Fire Incident Reporting System (NFIRS) incidents
According to the data from the years 2002 - 2018 the average number of fire incidents per year is 27. The highest number of reported fire incidents - 39 took place in 2005, and the least - 6 in 2012. The data has a declining trend.
When looking into fire subcategories, the most incidents belonged to: Outside Fires (36.9%), and Structure Fires (32.7%).
Fire incident types reported to NFIRS in Zip Code 49437
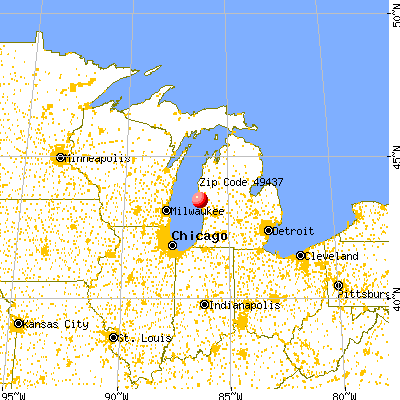


 Nearest zip codes: 49446, 49461, 49452, 49455, 49445, 49436.


 According to the data from the years 2002 - 2018 the average number of fire incidents per year is 27. The highest number of reported fire incidents - 39 took place in 2005, and the least - 6 in 2012. The data has a declining trend.
 When looking into fire subcategories, the most incidents belonged to: Outside Fires (36.9%), and Structure Fires (32.7%).