Estimated zip code population in 2022: 20,521 Zip code population in 2010: 19,515 Zip code population in 2000: 18,911
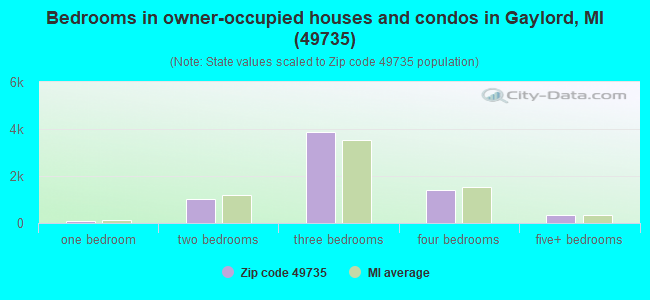
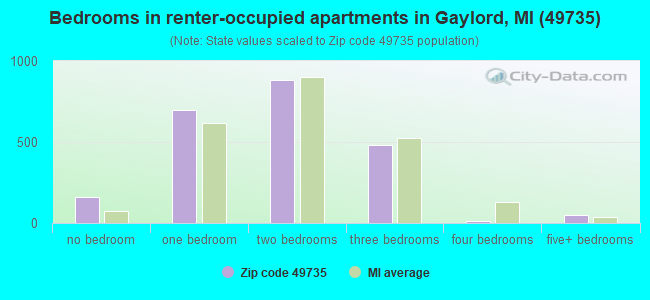
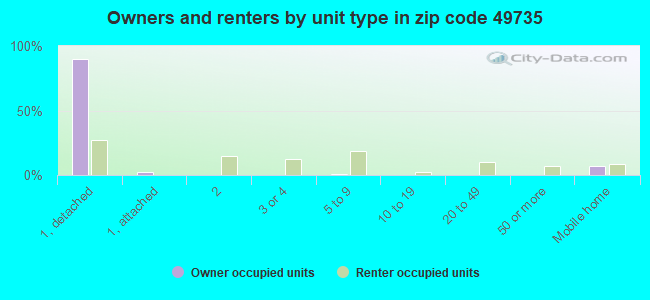
Houses and condos: 11,547 Renter-occupied apartments: 2,303
% of renters here:
25%
State:
27%
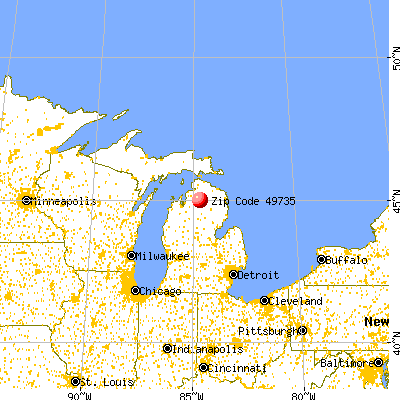
March 2022 cost of living index in zip code 49735: 81.6 (low, U.S. average is 100)
Land area: 250.6 sq. mi. Water area: 8.0 sq. mi.
Population density: 82 people per square mile
(very low).
OSM Map
General Map
Google Map
MSN Map
OSM Map
General Map
Google Map
MSN Map
OSM Map
General Map
Google Map
MSN Map
OSM Map
General Map
Google Map
MSN Map
Please wait while loading the map...
Real estate property taxes paid for housing units in 2022:
This zip code:
0.9% ($1,764)
Michigan:
1.2% ($2,746)
Median real estate property taxes paid for housing units with mortgages in 2022: $1,810 (0.9%) Median real estate property taxes paid for housing units with no mortgage in 2022: $1,707 (0.9%)
Averages for the 2020 tax year for zip code 49735, filed in 2021:
Average Adjusted Gross Income (AGI) in 2020: $58,098 (Individual Income Tax Returns)
Here:
$58,098
State:
$68,945
Salary/wage: $45,381 (reported on 78.0% of returns)
Here:
$45,381
State:
$57,142
(% of AGI for various income ranges: 1017.8% for AGIs below $25k, 3149.2% for AGIs $25k-50k, 5710.8% for AGIs $50k-75k, 8225.3% for AGIs $75k-100k, 15354.2% for AGIs $100k-200k, 58582.5% for AGIs over 200k)
Taxable interest for individuals: $1,434 (reported on 26.9% of returns)
This zip code:
$1,434
Michigan:
$1,630
(% of AGI for various income ranges: 15.2% for AGIs below $25k, 22.5% for AGIs $25k-50k, 39.2% for AGIs $50k-75k, 57.7% for AGIs $75k-100k, 115.2% for AGIs $100k-200k, 1820.0% for AGIs over 200k)
Ordinary dividends: $4,612 (reported on 15.8% of returns)
Here:
$4,612
State:
$6,972
(% of AGI for various income ranges: 21.0% for AGIs below $25k, 34.6% for AGIs $25k-50k, 70.2% for AGIs $50k-75k, 110.8% for AGIs $75k-100k, 288.8% for AGIs $100k-200k, 3347.5% for AGIs over 200k)
Net capital gain/loss in AGI: +$8,807 (reported on 15.5% of returns)
Here:
+$8,807
State:
+$20,064
(% of AGI for various income ranges: 8.6% for AGIs below $25k, 40.9% for AGIs $25k-50k, 79.7% for AGIs $50k-75k, 182.9% for AGIs $75k-100k, 646.9% for AGIs $100k-200k, 7880.0% for AGIs over 200k)
Profit/loss from business: +$12,557 (reported on 14.0% of returns)
Here:
+$12,557
State:
+$11,172
(% of AGI for various income ranges: 95.7% for AGIs below $25k, 159.4% for AGIs $25k-50k, 201.6% for AGIs $50k-75k, 368.3% for AGIs $75k-100k, 668.0% for AGIs $100k-200k, 3648.7% for AGIs over 200k)
Taxable individual retirement arrangement distribution: $18,837 (reported on 11.0% of returns)
49735:
$18,837
Michigan:
$19,803
(% of AGI for various income ranges: 73.6% for AGIs below $25k, 122.7% for AGIs $25k-50k, 235.6% for AGIs $50k-75k, 534.8% for AGIs $75k-100k, 1101.2% for AGIs $100k-200k, 3878.8% for AGIs over 200k)
Total itemized deductions: $36,129 (reported on 3.1% of returns)
Here:
$36,129
State:
$34,117
(% of AGI for various income ranges: 26.1% for AGIs below $25k, 51.8% for AGIs $25k-50k, 90.9% for AGIs $50k-75k, 161.7% for AGIs $75k-100k, 343.1% for AGIs $100k-200k, 6487.5% for AGIs over 200k)
Charity contributions: $14,519 (reported on 2.6% of returns)
Here:
$14,519
State:
$13,548
(% of AGI for various income ranges: 6.5% for AGIs below $25k, 20.9% for AGIs $50k-75k, 30.0% for AGIs $75k-100k, 110.3% for AGIs $100k-200k, 3096.2% for AGIs over 200k)
Taxes paid: $7,506 (reported on 3.1% of returns)
49735:
$7,506
State:
$7,972
(% of AGI for various income ranges: 4.0% for AGIs below $25k, 5.9% for AGIs $25k-50k, 19.6% for AGIs $50k-75k, 36.1% for AGIs $75k-100k, 96.5% for AGIs $100k-200k, 1287.5% for AGIs over 200k)
Earned income credit: $2,082 (reported on 14.9% of returns)
Here:
$2,082
State:
$2,251
(% of AGI for various income ranges: 66.8% for AGIs below $25k, 68.0% for AGIs $25k-50k, 2.1% for AGIs $50k-75k)
Percentage of individuals using paid preparers for their 2020 taxes: 92.9%
Here:
93%
State:
93%
(% for various income ranges: 90.8% for AGIs below $25k, 93.7% for AGIs $25k-50k, 93.7% for AGIs $50k-75k, 94.6% for AGIs $75k-100k, 94.7% for AGIs $100k-200k, 96.2% for AGIs over 200k)
Averages for the 2012 tax year for zip code 49735, filed in 2013:
Average Adjusted Gross Income (AGI) in 2012: $45,823 (Individual Income Tax Returns)
Here:
$45,823
State:
$55,609
Salary/wage: $37,776 (reported on 81.0% of returns)
Here:
$37,776
State:
$46,782
(% of AGI for various income ranges: 72.2% for AGIs below $25k, 71.7% for AGIs $25k-50k, 71.4% for AGIs $50k-75k, 70.8% for AGIs $75k-100k, 67.0% for AGIs $100k-200k, 46.0% for AGIs over 200k)
Taxable interest for individuals: $1,469 (reported on 32.9% of returns)
This zip code:
$1,469
Michigan:
$1,491
(% of AGI for various income ranges: 1.5% for AGIs below $25k, 0.8% for AGIs $25k-50k, 0.6% for AGIs $50k-75k, 0.7% for AGIs $75k-100k, 1.1% for AGIs $100k-200k, 1.9% for AGIs over 200k)
Ordinary dividends: $4,457 (reported on 17.5% of returns)
Here:
$4,457
State:
$6,225
(% of AGI for various income ranges: 1.4% for AGIs below $25k, 0.9% for AGIs $25k-50k, 1.1% for AGIs $50k-75k, 1.1% for AGIs $75k-100k, 2.3% for AGIs $100k-200k, 3.4% for AGIs over 200k)
Net capital gain/loss in AGI: +$3,687 (reported on 14.5% of returns)
Here:
+$3,687
State:
+$9,326
(% of AGI for various income ranges: 0.2% for AGIs below $25k, 0.2% for AGIs $25k-50k, 0.4% for AGIs $50k-75k, 0.2% for AGIs $75k-100k, 1.8% for AGIs $100k-200k, 4.2% for AGIs over 200k)
Profit/loss from business: +$8,585 (reported on 14.7% of returns)
Here:
+$8,585
State:
+$11,523
(% of AGI for various income ranges: 5.0% for AGIs below $25k, 2.7% for AGIs $25k-50k, 2.5% for AGIs $50k-75k, 2.4% for AGIs $75k-100k, 3.5% for AGIs $100k-200k, 0.8% for AGIs over 200k)
Taxable individual retirement arrangement distribution: $13,143 (reported on 12.5% of returns)
49735:
$13,143
Michigan:
$15,298
(% of AGI for various income ranges: 3.6% for AGIs below $25k, 3.8% for AGIs $25k-50k, 3.3% for AGIs $50k-75k, 4.4% for AGIs $75k-100k, 4.3% for AGIs $100k-200k, 1.9% for AGIs over 200k)
Self-employment retirement plans: $14,700 (reported on 0.3% of returns)
49735:
$14,700
Michigan:
$20,834
Total itemized deductions: $19,291 (20% of AGI, reported on 24.3% of returns)
Here:
$19,291
State:
$21,628
Here:
20.4% of AGI
State:
18.4% of AGI
(% of AGI for various income ranges: 7.7% for AGIs below $25k, 8.6% for AGIs $25k-50k, 9.1% for AGIs $50k-75k, 10.4% for AGIs $75k-100k, 12.4% for AGIs $100k-200k, 12.2% for AGIs over 200k)
Charity contributions: $3,823 (reported on 19.8% of returns)
Here:
$3,823
State:
$4,225
(% of AGI for various income ranges: 0.7% for AGIs below $25k, 1.0% for AGIs $25k-50k, 1.1% for AGIs $50k-75k, 1.5% for AGIs $75k-100k, 2.2% for AGIs $100k-200k, 3.3% for AGIs over 200k)
Taxes paid: $6,266 (reported on 24.2% of returns)
49735:
$6,266
State:
$8,327
(% of AGI for various income ranges: 1.5% for AGIs below $25k, 1.9% for AGIs $25k-50k, 2.5% for AGIs $50k-75k, 3.2% for AGIs $75k-100k, 4.6% for AGIs $100k-200k, 5.6% for AGIs over 200k)
Earned income credit: $2,157 (reported on 19.5% of returns)
Here:
$2,157
State:
$2,306
(% of AGI for various income ranges: 5.8% for AGIs below $25k, 1.4% for AGIs $25k-50k)
Percentage of individuals using paid preparers for their 2012 taxes: 53.7%
Here:
54%
State:
57%
(% for various income ranges: 48.0% for AGIs below $25k, 55.1% for AGIs $25k-50k, 57.1% for AGIs $50k-75k, 57.7% for AGIs $75k-100k, 68.2% for AGIs $100k-200k, 76.9% for AGIs over 200k)
Averages for the 2004 tax year for zip code 49735, filed in 2005:
Average Adjusted Gross Income (AGI) in 2004: $41,028 (Individual Income Tax Returns)
Here:
$41,028
State:
$48,204
Salary/wage: $33,846 (reported on 84.1% of returns)
Here:
$33,846
State:
$42,791
(% of AGI for various income ranges: 124.8% for AGIs below $10k, 71.1% for AGIs $10k-25k, 74.8% for AGIs $25k-50k, 77.2% for AGIs $50k-75k, 77.9% for AGIs $75k-100k, 51.0% for AGIs over 100k)
Taxable interest for individuals: $1,704 (reported on 44.5% of returns)
This zip code:
$1,704
Michigan:
$1,725
(% of AGI for various income ranges: 5.0% for AGIs below $10k, 2.5% for AGIs $10k-25k, 1.6% for AGIs $25k-50k, 1.2% for AGIs $50k-75k, 1.2% for AGIs $75k-100k, 2.4% for AGIs over 100k)
Taxable dividends: $2,566 (reported on 23.6% of returns)
Here:
$2,566
State:
$3,420
(% of AGI for various income ranges: 3.3% for AGIs below $10k, 1.3% for AGIs $10k-25k, 1.0% for AGIs $25k-50k, 1.0% for AGIs $50k-75k, 1.0% for AGIs $75k-100k, 2.4% for AGIs over 100k)
Net capital gain/loss: +$13,202 (reported on 19.5% of returns)
Here:
+$13,202
State:
+$8,532
(% of AGI for various income ranges: 0.4% for AGIs below $10k, 0.6% for AGIs $10k-25k, 0.6% for AGIs $25k-50k, 0.9% for AGIs $50k-75k, 1.6% for AGIs $75k-100k, 19.0% for AGIs over 100k)
Profit/loss from business: +$8,340 (reported on 16.7% of returns)
Here:
+$8,340
State:
+$9,547
(% of AGI for various income ranges: 3.3% for AGIs below $10k, 4.3% for AGIs $10k-25k, 3.3% for AGIs $25k-50k, 2.6% for AGIs $50k-75k, 1.7% for AGIs $75k-100k, 4.6% for AGIs over 100k)
IRA payment deduction: $2,839 (reported on 2.4% of returns)
49735:
$2,839
Michigan:
$2,875
(% of AGI for various income ranges: 0.2% for AGIs $10k-25k, 0.2% for AGIs $25k-50k, 0.2% for AGIs $50k-75k, 0.1% for AGIs $75k-100k, 0.1% for AGIs over 100k)
Self-employed pension: $13,244 (reported on 0.5% of returns)
Here:
$13,244
Michigan:
$13,826
Total itemized deductions: $16,460 (21% of AGI, reported on 30.7% of returns)
Here:
$16,460
State:
$18,509
Here:
21.1% of AGI
State:
20.7% of AGI
(% of AGI for various income ranges: 11.9% for AGIs below $10k, 9.3% for AGIs $10k-25k, 12.0% for AGIs $25k-50k, 13.9% for AGIs $50k-75k, 13.8% for AGIs $75k-100k, 11.7% for AGIs over 100k)
Charity contributions deductions: $3,047 (4% of AGI, reported on 26.8% of returns)
Here:
$3,047
State:
$3,365
Here:
3.7% of AGI
State:
3.6% of AGI
(% of AGI for various income ranges: 0.7% for AGIs below $10k, 1.0% for AGIs $10k-25k, 1.3% for AGIs $25k-50k, 1.8% for AGIs $50k-75k, 1.9% for AGIs $75k-100k, 3.1% for AGIs over 100k)
Total tax: $5,785 (reported on 72.0% of returns)
49735:
$5,785
State:
$7,691
(% of AGI for various income ranges: 2.9% for AGIs below $10k, 3.8% for AGIs $10k-25k, 6.1% for AGIs $25k-50k, 7.9% for AGIs $50k-75k, 9.8% for AGIs $75k-100k, 17.5% for AGIs over 100k)
Earned income credit: $1,713 (reported on 14.1% of returns)
Here:
$1,713
State:
$1,737
Percentage of individuals using paid preparers for their 2004 taxes: 57.3%
Here:
57%
State:
60%
(% for various income ranges: 47.8% for AGIs below $10k, 56.8% for AGIs $10k-25k, 59.0% for AGIs $25k-50k, 60.7% for AGIs $50k-75k, 63.5% for AGIs $75k-100k, 75.0% for AGIs over 100k)
Household received Food Stamps/SNAP in the past 12 months: 1,170 Household did not receive Food Stamps/SNAP in the past 12 months: 7,865
Women who had a birth in the past 12 months: 203 (102 now married, 98 unmarried) Women who did not have a birth in the past 12 months: 3,942 (1,589 now married, 2,352 unmarried)
Housing units in zip code 49735 with a mortgage: 4,303 (300 second mortgage, 7 home equity loan, 246 both second mortgage and home equity loan) Houses without a mortgage: 90
Median monthly owner costs for units with a mortgage: $1,235 Median monthly owner costs for units without a mortgage: $459
Residents with income below the poverty level in 2022:
This zip code:
10.6%
Whole state:
13.4%
Residents with income below 50% of the poverty level in 2022:
This zip code:
5.8%
Whole state:
6.9%
Median number of rooms in houses and condos:
Here:
6.4
State:
6.5
Median number of rooms in apartments:
Here:
3.8
State:
4.3
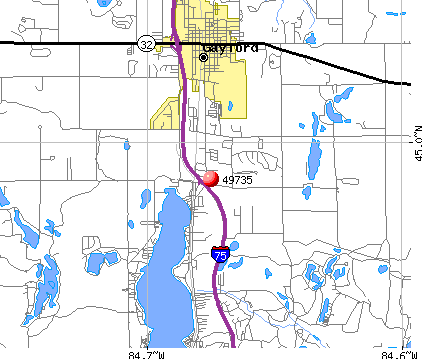
Notable locations in this zip code not listed on our city pages
Notable locations in zip code 49735: Maple Grove Cabins (A), Green Trees Golf Course (B), Gaylord Station (C), Treetops Resort Ski Area (D), Threetops Golf Course (E), Treetops Signature Golf Course (F), Treetops Premier Golf Course (G), Treetops Tradition Golf Course (H), Otsego Club's The Tribute Course (I), Otsego Club's The Classic Course (J), Michaywe Pines Golf Course (K), Mountain Lake Golf Course (L), Gaylord-Michaywe Wilderness Resort KOA Campground (M), The Loon Golf Course (N), Marsh Ridge Golf Course (O), Natural Golf Course (P), Edelweiss Shopping Plaza (Q), Otsego County Fairgrounds (R), Waters Station (S), Gaylord Country Club (T). Display/hide their locations on the map
Churches in zip code 49735 include: Peace Lutheran Church (A), First Presbyterian Church of Gaylord (B), Freedom Covenant Fellowship Church (C), Jehovah's Witnesses (D), Gaylord Family Fellowship Church (E), Our Savior Evangelical Church (F), Gaylord Seventh Day Adventist Church (G), Saint Andrew's Episcopal Church (H), Life Tabernacle Apostolic Church (I). Display/hide their locations on the map
Cemeteries: Hallock Cemetery (1), Hayes Cemetery (2), Otsego Lake Cemetery (3), Fairview Cemetery (4), Saint Marys Cemetery (5), Bagley Cemetery (6), Resurrection Catholic Cemetery (7). Display/hide their locations on the map
Lakes and reservoirs: Martin Lake (A), Lake Manuka (B), Turtle Lake (C), Lynn Lake (D), Lake Twentyseven (E), Lower Chub Lake (F), Loon Lake (G), Long Lake (H). Display/hide their locations on the map
Rivers and creeks: Frenchman Creek (A), South Branch Pigeon River (B), Saunders Creek (C), Chub Creek (D), Mossback Creek (E). Display/hide their locations on the map
Parks in zip code 49735 include: Freel Park (1), Hale Park (2), Doumas Park (3), Hutchins Park (4), Aspen Park (5), First Congregational Church Historical Marker (6), Otsego County Historical Marker (7), Frank and Rae Kramer House Historical Marker (8), Saint Mary's Catholic Church Historical Marker (9). Display/hide their locations on the map
2,331 married couples with children.
1,367 single-parent households (423 men, 944 women).
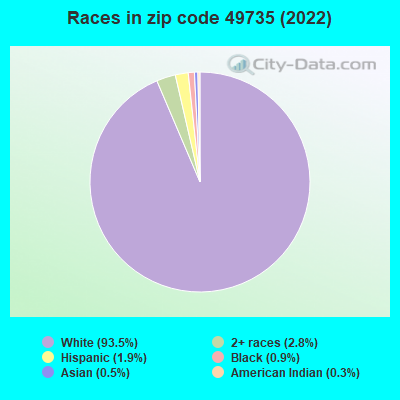
98.1% of residents of 49735 zip code speak English at home.
0.3% of residents speak Spanish at home (56% very well, 15% well, 29% not at all).
1.1% of residents speak other Indo-European language at home (95% very well, 5% not well).
0.3% of residents speak Asian or Pacific Island language at home (52% very well, 48% well).
0.2% of residents speak other language at home (79% very well, 21% well).
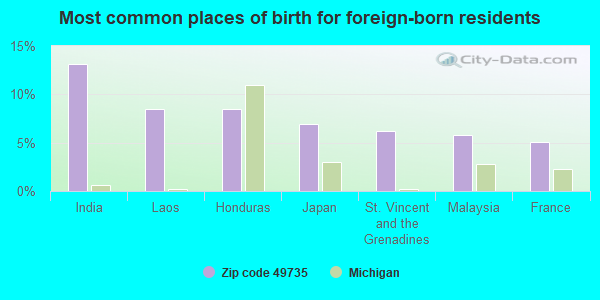
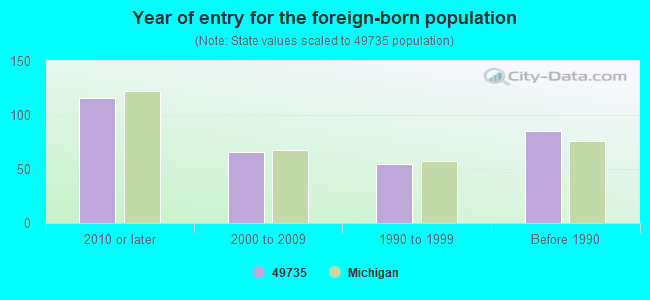
Foreign born population: 257 (1.3%) (55.2% of them are naturalized citizens)
This zip code:
1.3%
Whole state:
6.9%
13%India
9%Laos
9%Honduras
7%Japan
6%St. Vincent and the Grenadines
6%Malaysia
5%France
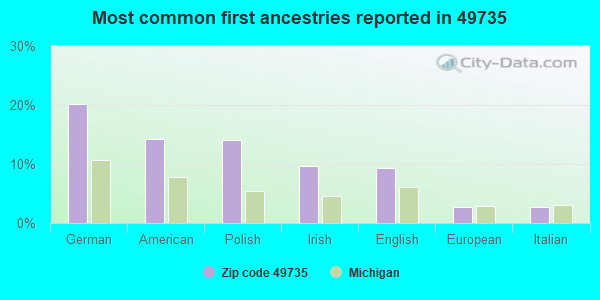
20%German
14%American
14%Polish
10%Irish
9%English
3%European
3%Italian
Year of entry for the foreign-born population
1162010 or later
662000 to 2009
551990 to 1999
85Before 1990
Major facilities with environmental interests located in this zip code:
FRUEHAUF LLC (990 SOUTH WISCONSIN AVENUE in GAYLORD, MI)
MERCURY EXPLORATION COMPANY (SW4 NW4 T31N R2E SEC 36 in GAYLORD, MI)
AIR SYNTHETIC MINOR (AIRS/AFS) (Integrated Compliance Information System) - ICIS-05-1997-0067, FORMAL ENFORCEMENT ACTION CRITERIA AND HAZARDOUS AIR POLLUTANT INVENTORY (Inventory of air pollution sources) Business SIC classification: CRUDE PETROLEUM AND NATURAL GAS
GAYLORD ALTERNATIVE PROGRAM (615 S. ELM STREET in GAYLORD, MI)
(National Center for Education Statistics) - STATE ID-08481 Organizations: GAYLORD COMMUNITY SCHOOLS (SCHOOL DISTRICT)
GAYLORD COMMUNITY SCHOOLS (615 S ELM ST in GAYLORD, MI)
COMPLIANCE ACTIVITY (Tracking inspections of insecticide, fungicide, and rodenticide, and toxic substances) Conditionally Exempt Small Quantity Generators, less than 100 kg/month of hazardous waste (Resource Conservation and Recovery Act (tracking hazardous waste)) (Resource Conservation and Recovery Act (tracking hazardous waste)) Alternative names: GAYLORD COMM SCHS
GAYLORD HIGH SCHOOL/VOC. BLDG. (90 LIVINGSTON BOULEVARD in GAYLORD, MI)
(National Center for Education Statistics) - STATE ID-01375 Organizations: GAYLORD COMMUNITY SCHOOLS (SCHOOL DISTRICT)
GAYLORD MIDDLE SCHOOL (600 E. 5TH STREET in GAYLORD, MI)
(National Center for Education Statistics) - STATE ID-01374 Organizations: GAYLORD COMMUNITY SCHOOLS (SCHOOL DISTRICT)
GAYLORD INTERMEDIATE SCHOOL (240 E. 4TH STREET in GAYLORD, MI)
(National Center for Education Statistics) - STATE ID-07965 Organizations: GAYLORD COMMUNITY SCHOOLS (SCHOOL DISTRICT)
ECONO LODGE (2880 OLD 27 S in GAYLORD, MI)
(Integrated Compliance Information System) - ICIS-05-1998-0720, FORMAL ENFORCEMENT ACTION Business SIC classification: HOTELS AND MOTELS
DEVONIAN ENERGY INC (209 N ILLINOIS in GAYLORD, MI)
(Integrated Compliance Information System) - ICIS-05-1996-0283, FORMAL ENFORCEMENT ACTION
MERIT ENERGY CHARLTON C (SPARR ROAD in GAYLORD, MI)
AIR SYNTHETIC MINOR (AIRS/AFS) AIR MAJOR (AIRS/AFS) CRITERIA AND HAZARDOUS AIR POLLUTANT INVENTORY (Inventory of air pollution sources) Business SIC classification: CRUDE PETROLEUM AND NATURAL GAS; NONCLASSIFIABLE ESTABLISHMENTS Alternative names: MERIT ENERGY COMPANY, CHA, MERIT ENERGY COMPANY, CHARLTON C, MERIT ENERGY-CHESTER 34, MERIT ENERGY COMPANY, CHARLTON C, SHELL WESTERN E&P, INC.
MI DEPT/TRANSPORTATION (NORTH REGION MDOT in GAYLORD, MI)
(Resource Conservation and Recovery Act (tracking hazardous waste)) Organizations: MICH DEPT OF TRANSPORTATION (CONTACT/OPERATOR)
A S GOTTLOEB TRUST (114 S CENTER in GAYLORD, MI)
(Resource Conservation and Recovery Act (tracking hazardous waste)) Organizations: IKNAYAN CHARLES N MD (CONTACT/OPERATOR)
Alternative names: NORTHERN LOWER PENINSULA LABORATORIES IN
MI DEPT/TRANSPORTATION (109 W MAIN ST in GAYLORD, MI)
(Resource Conservation and Recovery Act (tracking hazardous waste)) Organizations: MICH DEPT OF TRANSPORTATION (CONTACT/OPERATOR)
Alternative names: MIDOT RIGHT OF WAY
Housing units lacking complete plumbing facilities: 0.8% Housing units lacking complete kitchen facilities: 1.9%
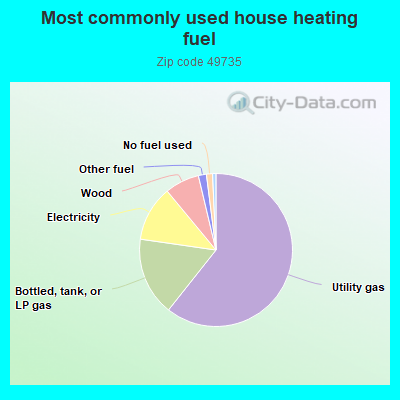
60.6%Utility gas
16.6%Bottled, tank, or LP gas
11.7%Electricity
7.3%Wood
1.7%Other fuel
1.3%No fuel used
0.7%Fuel oil, kerosene, etc.
Population in 1990: 11,598. Population change in the 1990s: +7,313 (+63.1%).
Place of birth for U.S.-born residents:
This state: 17,391
Northeast: 390
Midwest: 1,197
South: 713
West: 499
55% of the 49735 zip code residents lived in the same house 5 years ago. Out of people who lived in different houses, 45% lived in this county. Out of people who lived in different counties, 50% lived in Michigan.
91% of the 49735 zip code residents lived in the same house 1 year ago. Out of people who lived in different houses, 38% moved from this county. Out of people who lived in different houses, 48% moved from different county within same state. Out of people who lived in different houses, 14% moved from different state.
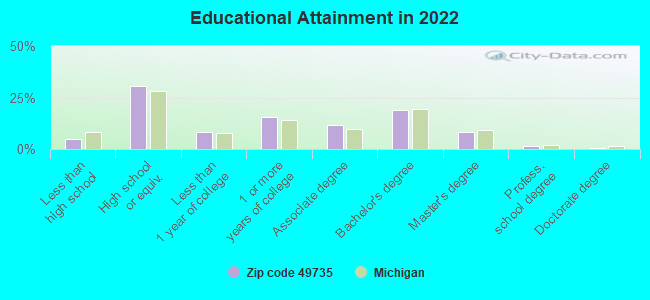
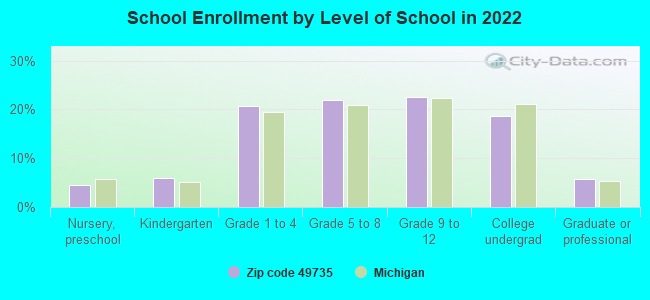
Private vs. public school enrollment:
Students in private schools in grades 1 to 8 (elementary and middle school): 313
Here:
18.3%
Michigan:
12.4%
Students in private schools in grades 9 to 12 (high school): 54
Here:
6.1%
Michigan:
9.8%
Students in private undergraduate colleges: 51
Here:
6.9%
Michigan:
14.9%
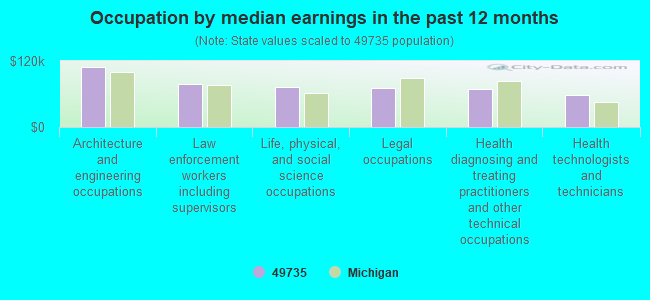
Occupation by median earnings in the past 12 months ($)
109,317Architecture and engineering occupations
77,836Law enforcement workers including supervisors
73,353Life, physical, and social science occupations
71,512Legal occupations
68,694Health diagnosing and treating practitioners and other technical occupations
57,740Health technologists and technicians
Companies with federal contracts located in this zip code (GAYLORD, MI):
BRADLEY J BUTCHER AND ASSOCIA (147 W MAIN STREET SUITE 3; small business) : $1,259,608 in 25 contractsfrom 2001 to 2006
Contracts for Administrative and Service Buildings, Architect - Engineer Services (including landscaping, interior layout, and designing) by Army Signed by year:2000: $0; 2001: $85,609; 2002: $126,100; 2003: $632,148; 2004: $222,951; 2005: $61,966; 2006: $130,834.
Biggest contracts:
$517,714 with Army for Administrative and Service Buildings. Signed on 2003-09-26. Completion date: 2003-07-30.
$110,002 with Army for Architect - Engineer Services (including landscaping, interior layout, and designing). Signed on 2006-06-29. Completion date: 2007-06-29.
$84,546, same as above.Signed on 2004-09-30. Completion date: 2006-08-31.
$79,985, same as above.Signed on 2001-02-21. Completion date: 2002-02-20.
M & M EXCAVATING CO , INC (17 OLD STATE RD; small business) : $219,450 in 4 contractsin 2004
$98,225 with U.S. Army Corps of Engineers - civil program financing only for Other Environmental Services, Studies, and Analytical Support. Signed on 2004-06-03. Completion date: 2004-06-23.
$98,225 with Army for Other Environmental Services, Studies, and Analytical Support. Signed on 2004-06-03. Completion date: 2004-06-23.
$15,000, same as above.Signed on 2004-09-30. Completion date: 2004-06-23.
$8,000, same as above.Signed on 2004-12-20. Completion date: 2004-06-23.
ELAM CORPORATION OF OTSEGO COU (990 N CENTER AVE; small business) : $9,643 in 3 contractsin 2005
$7,298 with Army for Food Services. Signed on 2005-01-27. Completion date: 2005-01-31.
$1,431, same as above.Signed on 2005-02-02. Completion date: 2005-01-31.
$914, same as above.Signed on 2005-02-04. Completion date: 2005-01-31.
MID-AMERICAN INSPECTION SERVIC (1206 EFFIE BLVD; small business)
$4,800 with Army for Equipment and Materials Testing -- Pumps and Compressors. Signed on 2005-11-09. Completion date: 2006-03-01.
HANNAH AUTO SALES (1510 DICKERSON RD; small business)
$3,160 with Army for Maintenance, Repair and Rebuilding of Equipment -- Ground Effect Vehicles, Motor Vehicles, Trailers, and Cycles. Signed on 2005-07-22. Completion date: 2006-07-31.
Top industries in this zip code by the number of employees in 2005:
Health Care and Social Assistance: General Medical and Surgical Hospitals (500-999 employees: 1 establishment)
Accommodation and Food Services: Hotels (except Casino Hotels) and Motels (250-499: 1, 20-49: 4, 10-19: 2, 5-9: 1, 1-4: 1)
Administrative and Support and Waste Management and Remediation Services: All Other Support Services (100-249: 1, 1-4: 1)
People in group quarters in 2010:
104 people in nursing facilities/skilled-nursing facilities
84 people in college/university student housing
56 people in group homes intended for adults
33 people in local jails and other municipal confinement facilities
29 people in mental (psychiatric) hospitals and psychiatric units in other hospitals
20 people in emergency and transitional shelters (with sleeping facilities) for people experiencing homelessness
People in group quarters in 2000:
86 people in nursing homes
65 people in other group homes
36 people in local jails and other confinement facilities (including police lockups)
21 people in homes for the mentally retarded
Fatal accident statistics in 2014:
Fatal accident count: 1
Vehicles involved in fatal accidents: 2
Fatal accidents caused by drunken drivers: 0
Fatalities: 2
Persons involved in fatal accidents: 3
Pedestrians involved in fatal accidents: 0
Fatal accident statistics in 2013:
Fatal accident count: 1
Vehicles involved in fatal accidents: 2
Fatal accidents caused by drunken drivers: 0
Fatalities: 1
Persons involved in fatal accidents: 2
Pedestrians involved in fatal accidents: 0
2002 - 2018 National Fire Incident Reporting System (NFIRS) incidents
Based on the data from the years 2002 - 2018 the average number of fire incidents per year is 67. The highest number of reported fires - 111 took place in 2004, and the least - 6 in 2013. The data has a dropping trend.
When looking into fire subcategories, the most reports belonged to: Structure Fires (45.5%), and Outside Fires (33.2%).
Fire incident types reported to NFIRS in Zip Code 49735


 Nearest zip codes: 49795, 49733, 49730, 49751, 49713, 49799.


 Based on the data from the years 2002 - 2018 the average number of fire incidents per year is 67. The highest number of reported fires - 111 took place in 2004, and the least - 6 in 2013. The data has a dropping trend.
 When looking into fire subcategories, the most reports belonged to: Structure Fires (45.5%), and Outside Fires (33.2%).